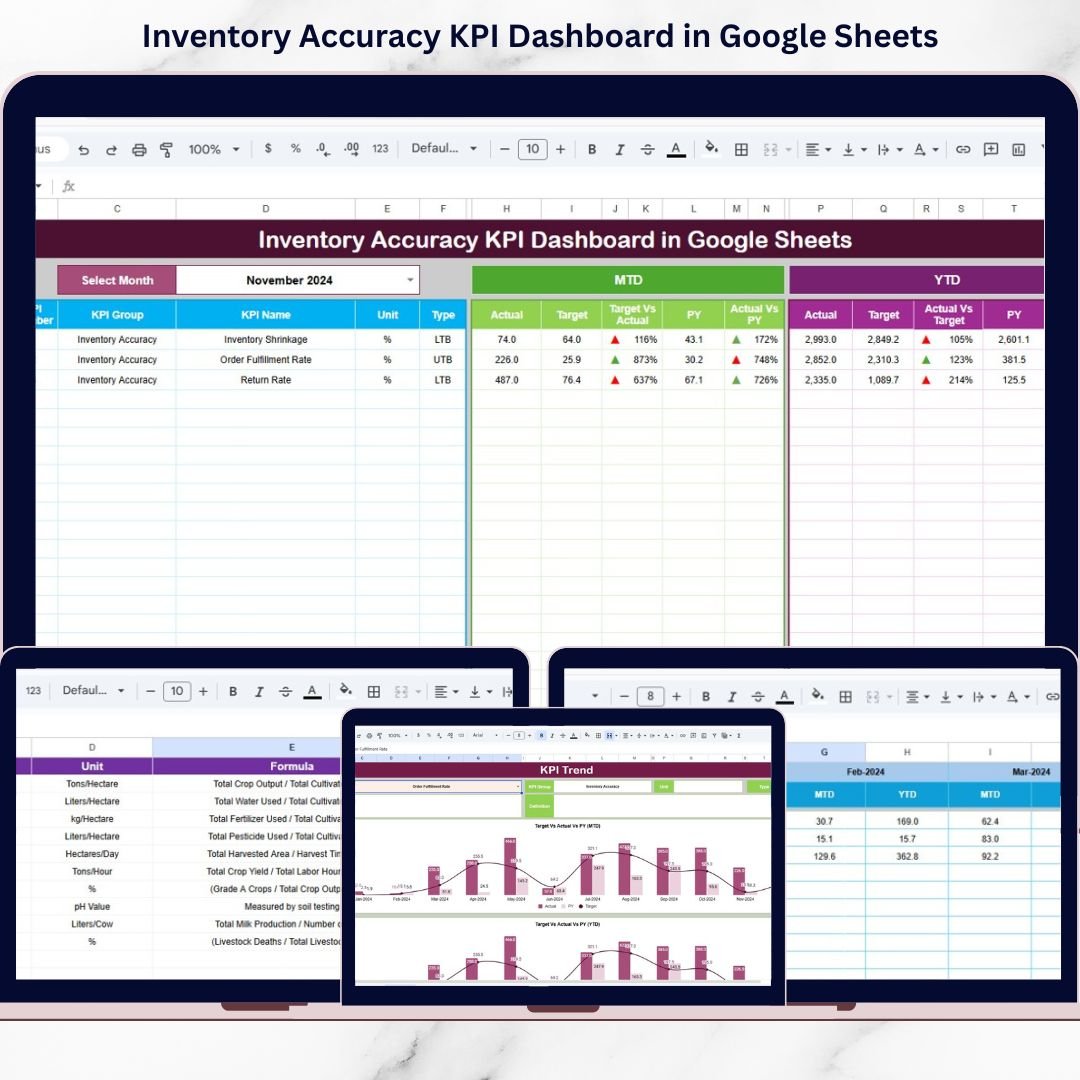
📦 Inventory Accuracy KPI Dashboard in Google Sheets
Inventory mistakes are expensive. A small mismatch in stock records can cause stock-outs, overstocking, delayed shipments, and financial losses. Yet many warehouses still rely on disconnected spreadsheets and manual checks.
What if you could monitor inventory accuracy, compare targets, and track trends — all in one automated Google Sheets dashboard?
Introducing the Inventory Accuracy KPI Dashboard in Google Sheets — a ready-to-use performance tracking system designed for warehouses, supply chain teams, and inventory managers.
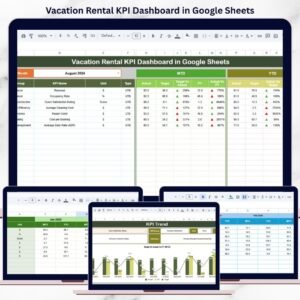
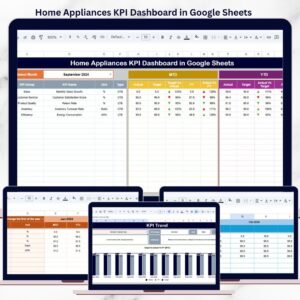
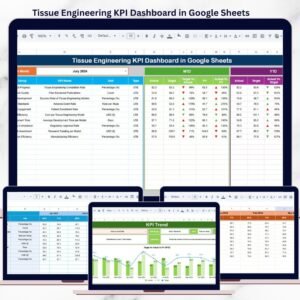
This powerful template allows you to track MTD and YTD performance, compare Actual vs Target, analyze Previous Year performance, and review KPI trends visually. Simply select the month from the drop-down menu, and the entire dashboard updates instantly.
No complex formulas to build. No confusing reports. Just clear, actionable inventory insights.
If you want tighter stock control, better forecasting, and improved warehouse efficiency — this dashboard is your complete inventory command center.

🚀 Key Features of Inventory Accuracy KPI Dashboard in Google Sheets
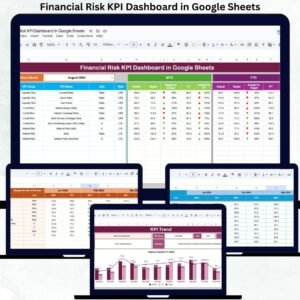
📊 Interactive Month Selector (Range D3) – Choose any month and the dashboard updates automatically.
📈 MTD & YTD Performance Tracking – Monitor both monthly and yearly results in one view.
🎯 Actual vs Target Comparison – Instantly measure performance gaps using percentage variance.
🔁 Previous Year Comparison – Evaluate improvement using historical data.
🚦 Conditional Formatting with Arrows – Up and down indicators show performance changes instantly.
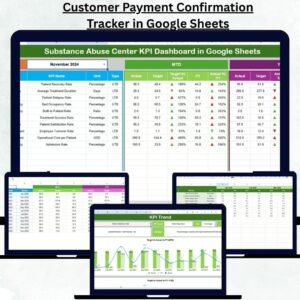
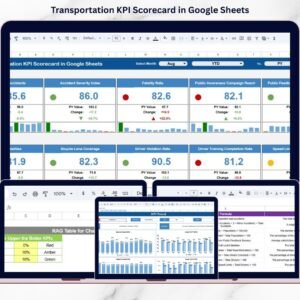
📉 KPI Trend Sheet (Range C3 Selection) – Select a KPI and view monthly and yearly trend charts.
📘 Centralized KPI Definition Sheet – Clearly define KPI group, unit, formula, and logic.
📝 Separate Data Input Sheets – Reduce reporting errors with structured data entry tabs.
Because everything runs on Google Sheets, your team can collaborate in real time from anywhere.
📦 What’s Inside the Inventory Accuracy KPI Dashboard in Google Sheets
This dashboard includes 6 structured worksheets:
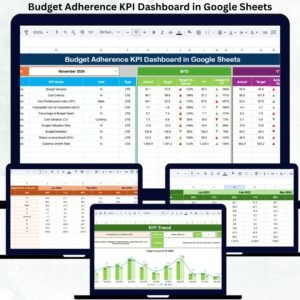
1️⃣ Dashboard Sheet Tab
The main reporting page showing:
-
MTD Section (Actual, Target, Previous Year, Variance %)
-
YTD Section (Actual, Target, Previous Year, Variance %)
-
Conditional formatting arrows
-
Automated calculations
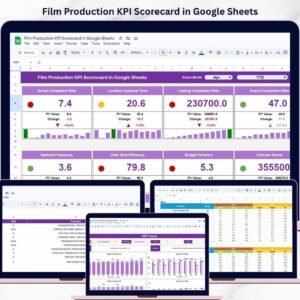
2️⃣ KPI Trend Sheet Tab
Select a KPI (Range C3) and view:
-
KPI Group
-
Unit
-
KPI Type (Lower the Better / Upper the Better)
-
Formula
-
Definition
-
MTD & YTD Trend Charts
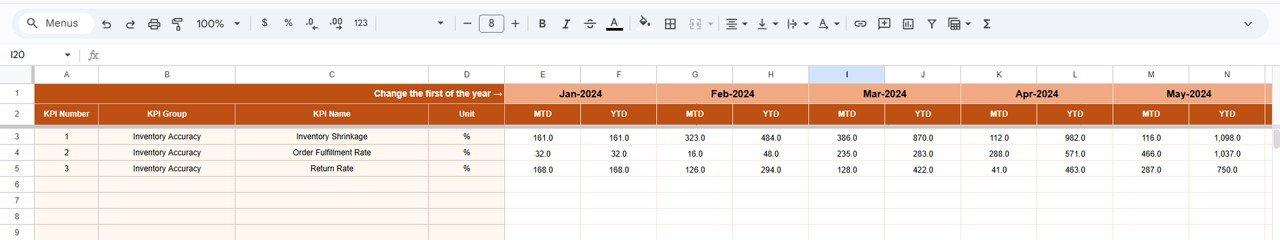
3️⃣ Actual Number Sheet Tab
Enter:
-
Monthly MTD actual values
-
YTD cumulative values
-
First month of financial year (Range E1)
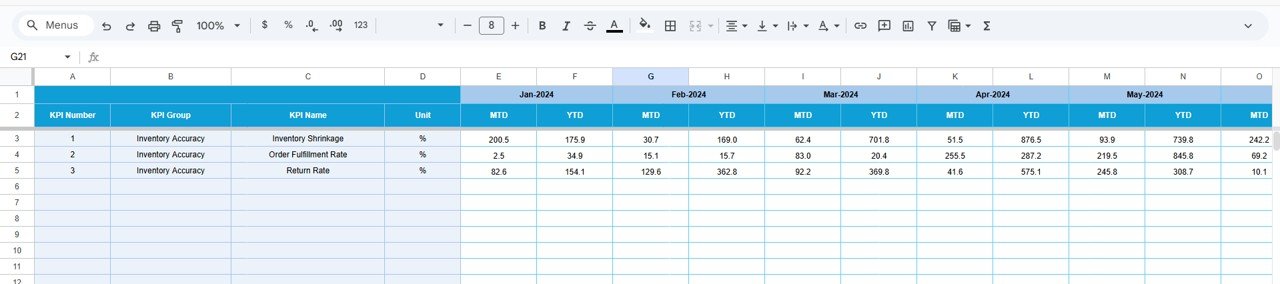
4️⃣ Target Sheet Tab
Input monthly targets for accurate comparison.
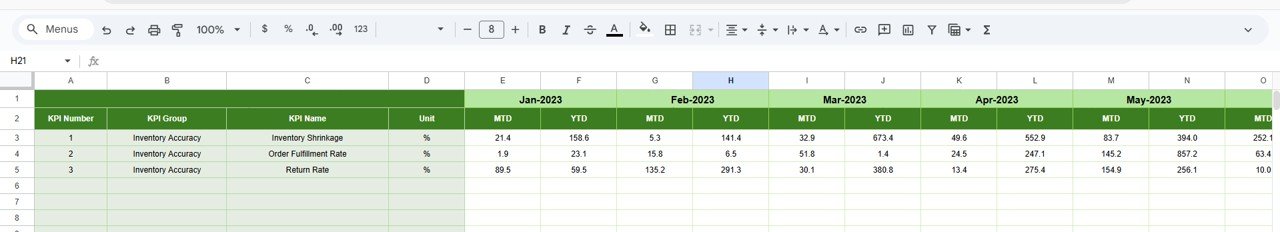
5️⃣ Previous Year Number Sheet Tab
Store historical MTD and YTD data for performance comparison.
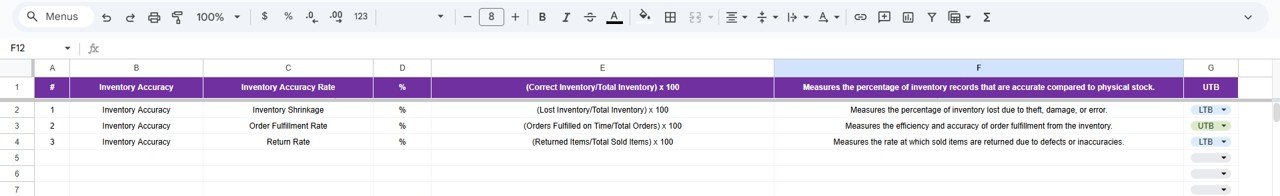
6️⃣ KPI Definition Sheet Tab
Centralize KPI logic and calculation rules to ensure consistency.
Each sheet is logically designed to keep data entry separate from reporting — minimizing errors and confusion.
⚙️ How to Use the Inventory Accuracy KPI Dashboard in Google Sheets
1️⃣ Enter monthly actual inventory data.
2️⃣ Input targets and previous year numbers.
3️⃣ Select the reporting month from the drop-down.
4️⃣ Review MTD and YTD sections.
5️⃣ Analyze arrows, percentage variance, and trend charts.
Within minutes, you can identify discrepancies, shrinkage risks, or performance gaps.
No technical skills required — just structured data entry and clear visualization.
👥 Who Can Benefit from This Inventory Accuracy KPI Dashboard?
This dashboard is ideal for:
🏭 Warehouse Managers
🚚 Supply Chain Teams
📦 Inventory Controllers
🛒 Retail Operations Managers
🏢 Distribution Centers
📊 Operations Analysts
📈 Business Owners
If inventory accuracy affects your revenue or customer satisfaction — this tool is built for you.
Why This Dashboard Is Essential
✔️ Detect stock discrepancies early
✔️ Reduce financial losses from shrinkage
✔️ Improve warehouse counting accuracy
✔️ Enhance demand forecasting
✔️ Support smarter purchasing decisions
✔️ Strengthen operational visibility
Inventory accuracy directly impacts profitability. When you monitor it visually and consistently, you prevent costly mistakes.
Stop guessing. Start measuring.
Click here to read the Detailed blog post
Watch the step-by-step video tutorial: