The healthcare industry is evolving faster than ever, and organizations need smart tools to stay ahead. The HealthTech KPI Dashboard in Excel is your all-in-one solution to track performance, improve efficiency, and make data-driven decisions—without spending on expensive software. Whether you run a hospital, clinic, or health startup, this dashboard will transform the way you monitor patient care, compliance, finance, and operations.
With seven interactive Excel sheets, you get complete visibility into monthly, yearly, and historical KPIs. From patient satisfaction scores to financial margins and compliance checks, every detail is structured, automated, and easy to understand. This ready-to-use template not only saves you time but also empowers your team to deliver better outcomes.
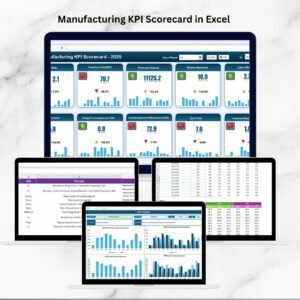
✨ Key Features of HealthTech KPI Dashboard in Excel
-
🏥 Centralized Reporting – All KPIs in one place, no more scattered spreadsheets.
-
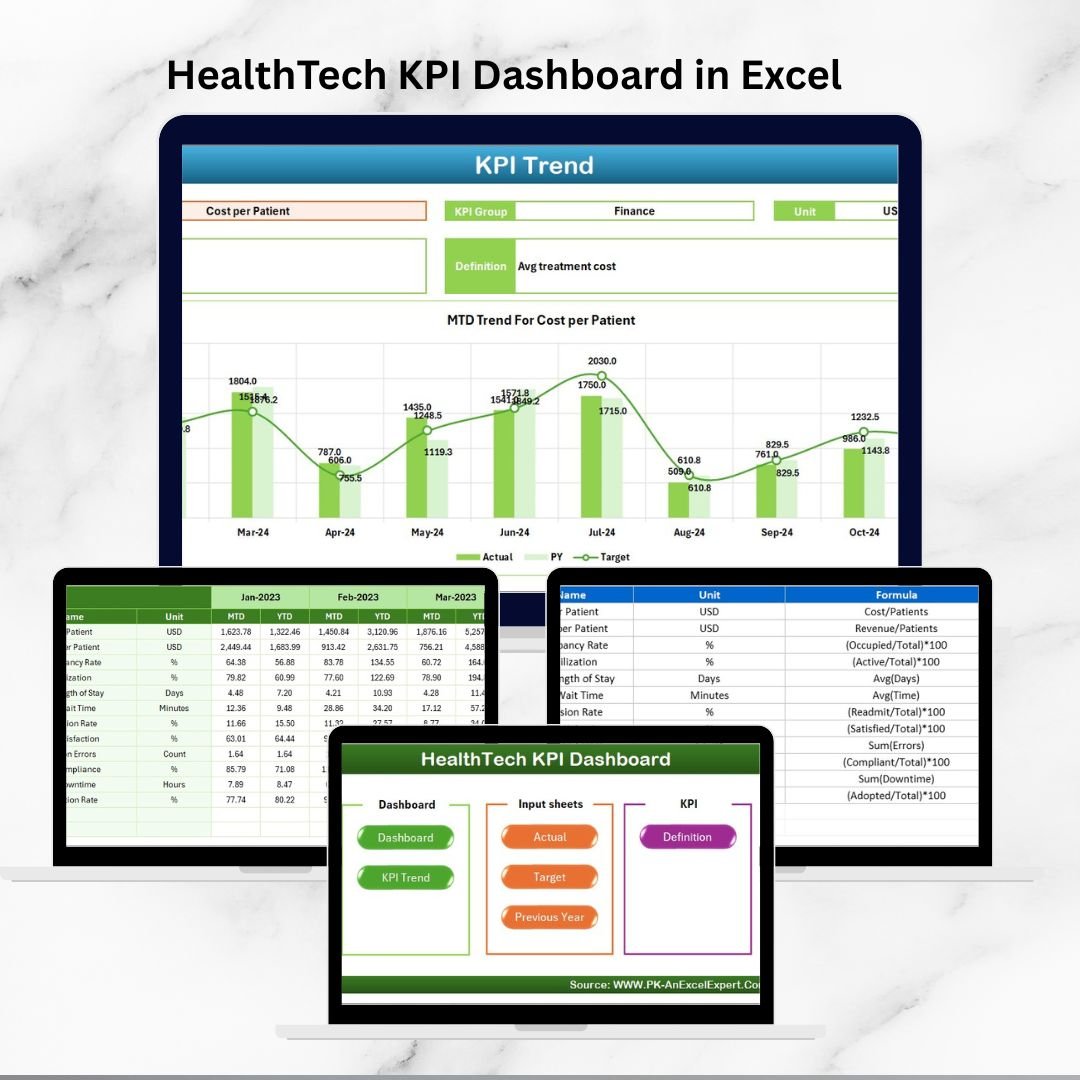
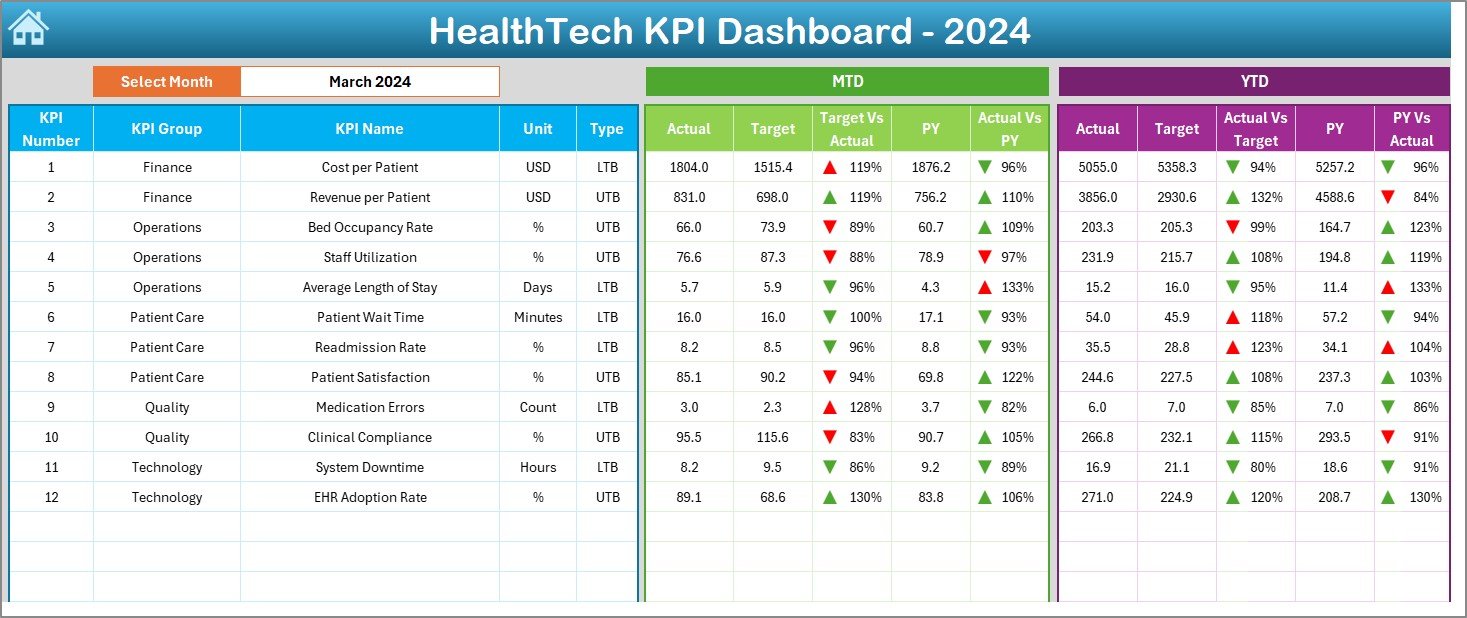
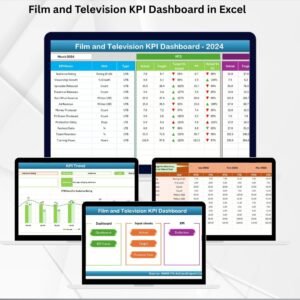
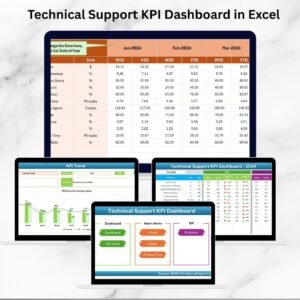
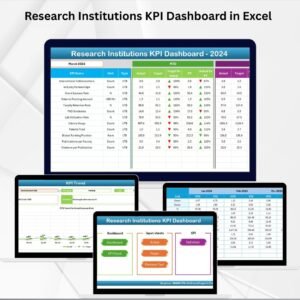
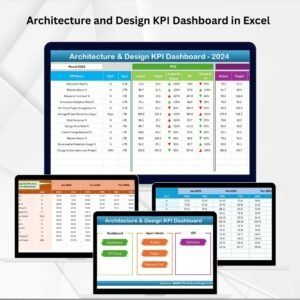
📊 Interactive Dashboard – Month selector to instantly update all figures.
-
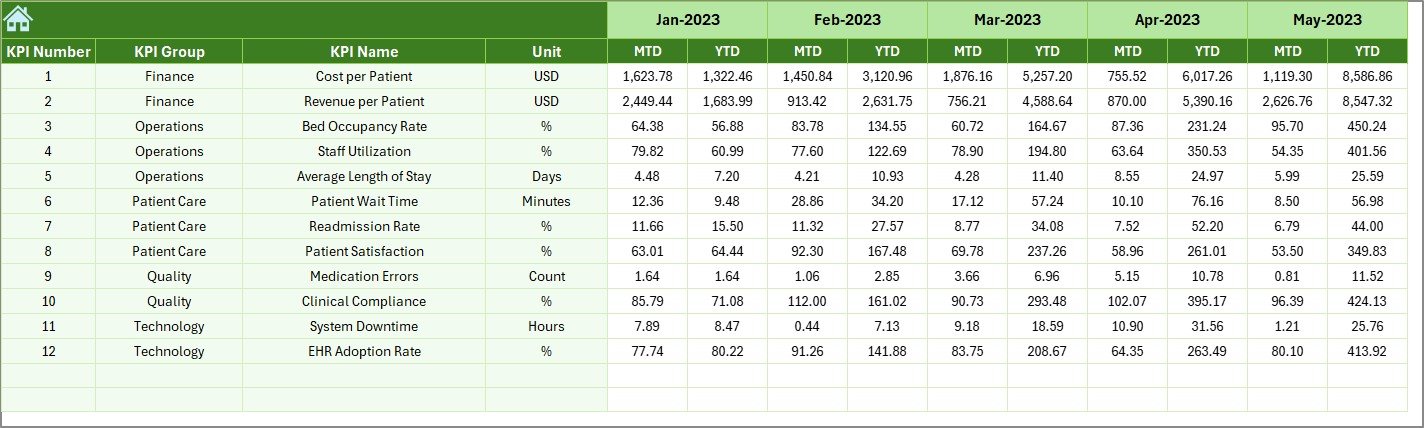
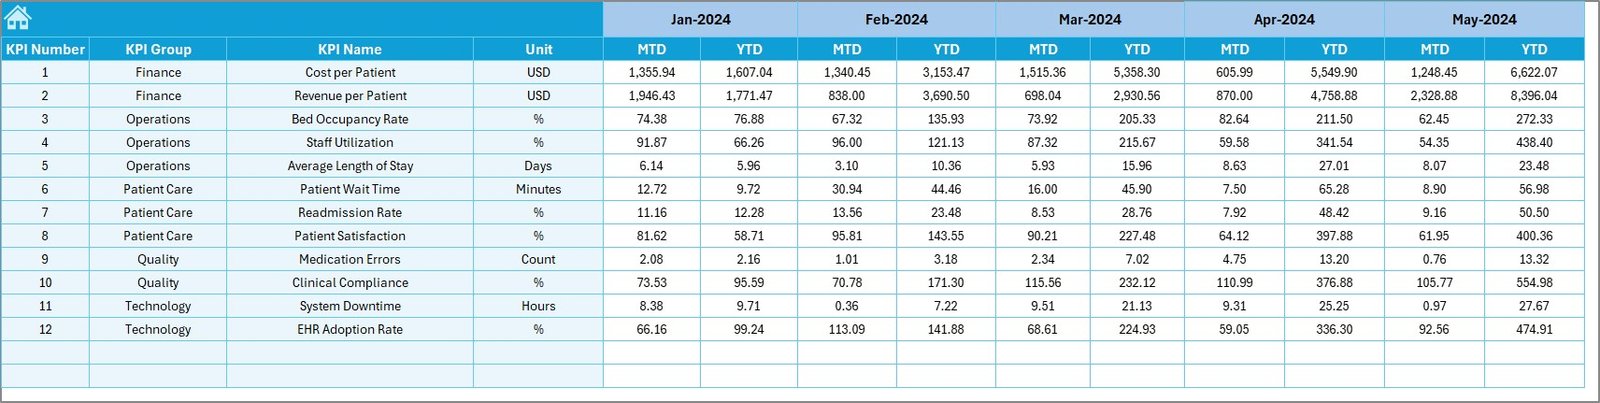
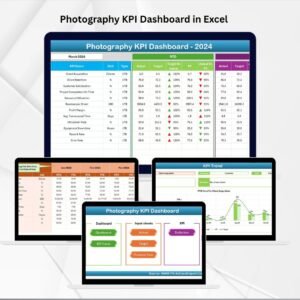
⏳ MTD & YTD Analysis – Track month-to-date and year-to-date performance side by side.
-
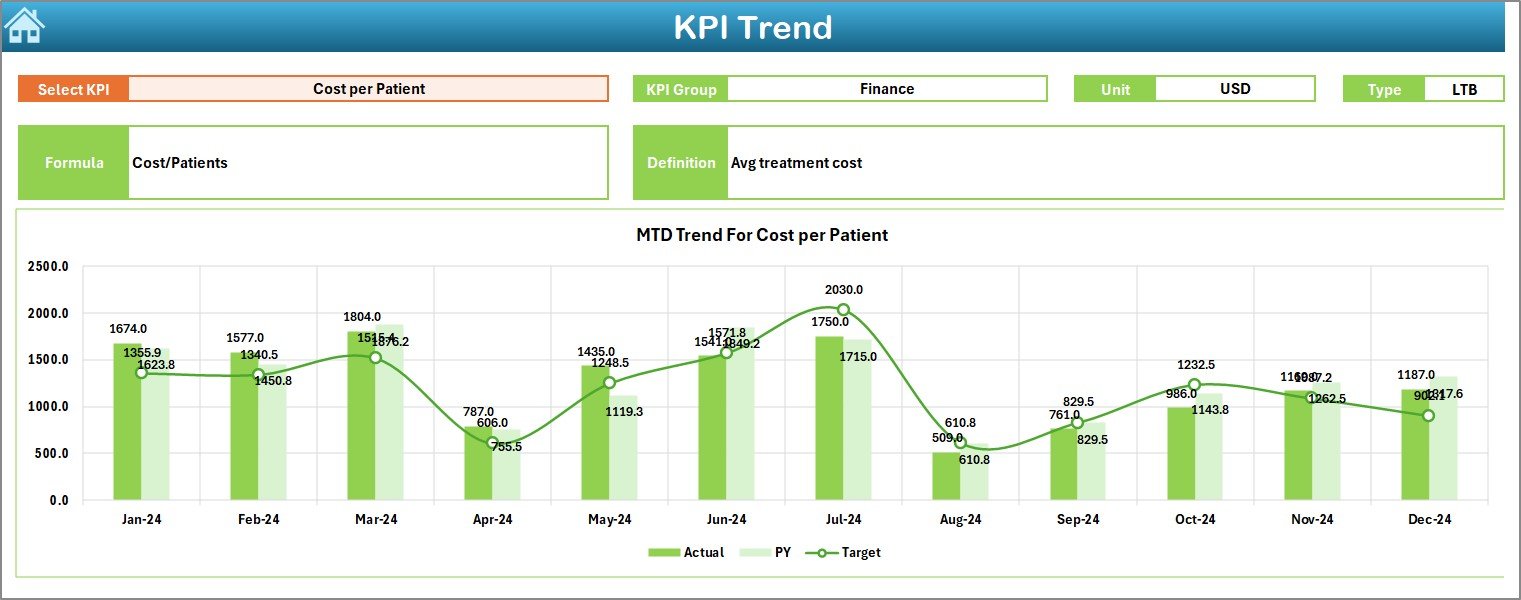
📈 Trend Monitoring – See actuals vs targets with dynamic charts and arrows.
-
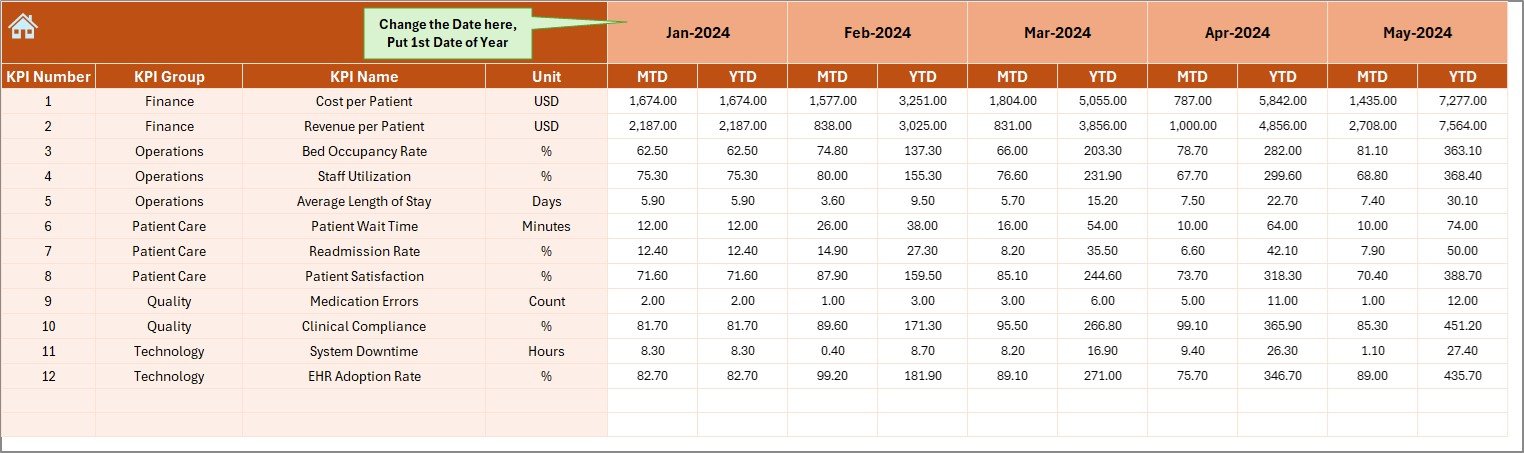
📂 Structured Data Input – Separate sheets for Actuals, Targets, and Previous Year.
-
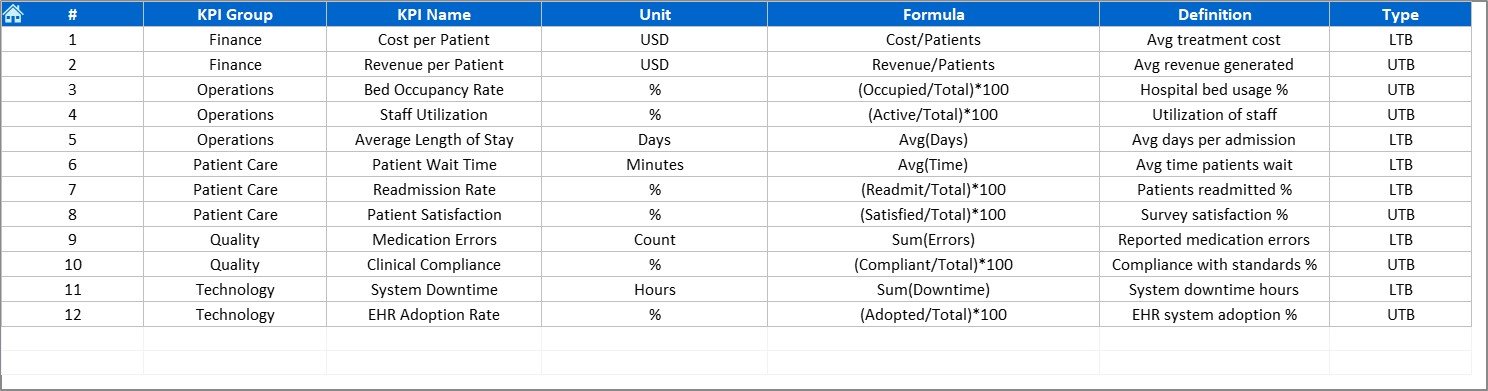
📜 KPI Definition Library – Store and reference all KPI logic in one tab.
-
💡 User-Friendly – Built in Excel with simple navigation, requires minimal training.
-
💸 Cost-Effective – No external tools needed—works right inside Microsoft Excel.
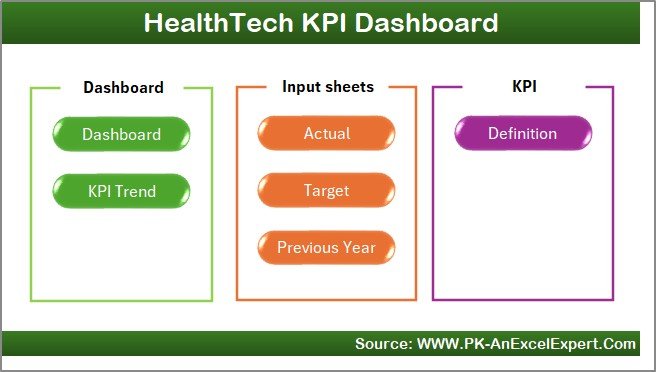
📦 What’s Inside the HealthTech KPI Dashboard
When you download this product, you get a complete Excel package with 7 fully designed sheets:
-
Home Sheet – Quick navigation buttons for all sections.
-
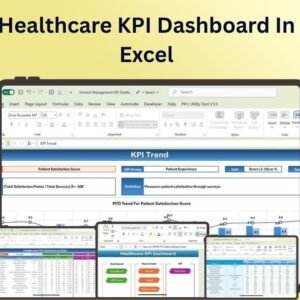
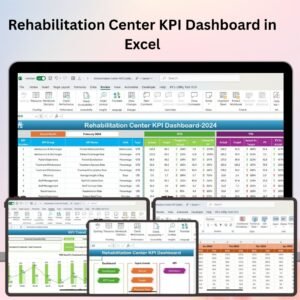
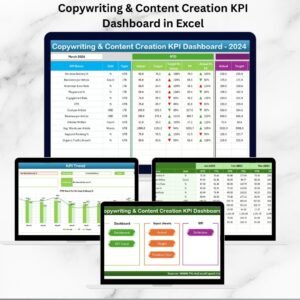
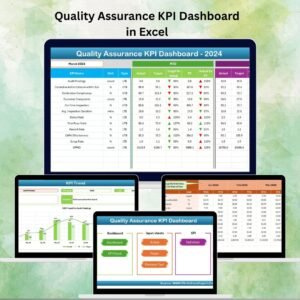
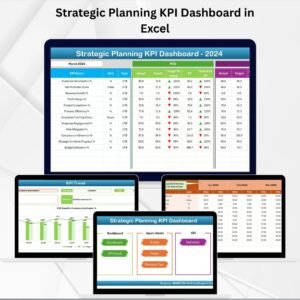
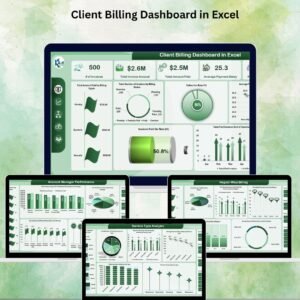
Dashboard Tab – The main reporting hub with instant updates.
-
KPI Trend Tab – Dropdown-based KPI analysis with charts.
-
Actual Numbers Input – Enter monthly figures with accuracy.
-
Target Sheet – Store MTD and YTD goals for easy comparison.
-
Previous Year Data – Capture last year’s performance for YoY analysis.
-
KPI Definition Sheet – Reference for KPI names, formulas, and units.
This structure ensures clarity, consistency, and smooth workflow for all healthcare managers and analysts.
🛠 How to Use the HealthTech KPI Dashboard
-
Enter Data – Fill in Actual Numbers monthly in the input sheet.
-
Set Targets – Define your organizational targets in the Target sheet.
-
Review Dashboard – Select the desired month and view updated performance.
-
Analyze Trends – Use the KPI Trend tab to explore long-term insights.
-
Compare Historical Data – Check against previous year values.
-
Share Insights – Present results to stakeholders with clarity and confidence.
No coding or advanced Excel knowledge is required—everything is pre-built and ready to use.
👥 Who Can Benefit from This HealthTech KPI Dashboard
-
🏥 Hospitals & Clinics – Track patient care, waiting times, and satisfaction.
-
💊 Pharmaceutical Companies – Monitor R&D efficiency, compliance, and revenue KPIs.
-
🔬 Diagnostic Labs – Keep an eye on appointment no-shows, turnaround times, and quality checks.
-
🚑 Healthcare Startups – Gain investor confidence with structured reporting.
-
📋 Compliance Teams – Ensure staff training, audit readiness, and regulatory adherence.
-
💰 Finance Managers – Monitor operating margin, cost per procedure, and revenue growth.
If you’re in healthcare, this dashboard will simplify reporting and supercharge decision-making.
📖 Click here to read the Detailed blog post
Visit our YouTube channel to learn step-by-step video tutorials
Watch the step-by-step video tutorial:


Reviews
There are no reviews yet.