Healthcare organizations today handle massive volumes of data—from appointments and cancellations to patient satisfaction, doctor performance, and even digital adoption metrics. Managing this manually is time-consuming and error-prone. That’s why we designed the Health Tech Dashboard in Excel, a ready-to-use, interactive reporting solution that transforms raw data into actionable insights.
Instead of juggling scattered spreadsheets, this dashboard centralizes healthcare performance into one intuitive platform. Whether you’re a hospital administrator, a clinic manager, or part of a healthcare IT team, you can monitor appointments, identify bottlenecks, and improve patient outcomes—all within Excel.
✨ Key Features of Health Tech Dashboard in Excel
-
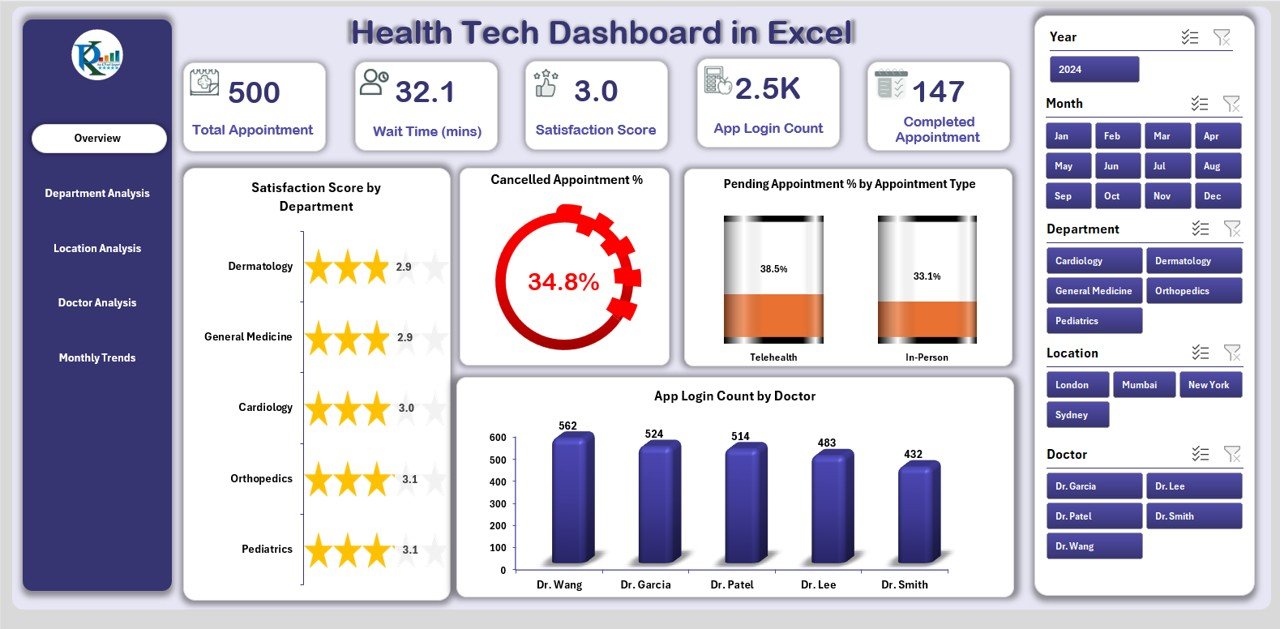
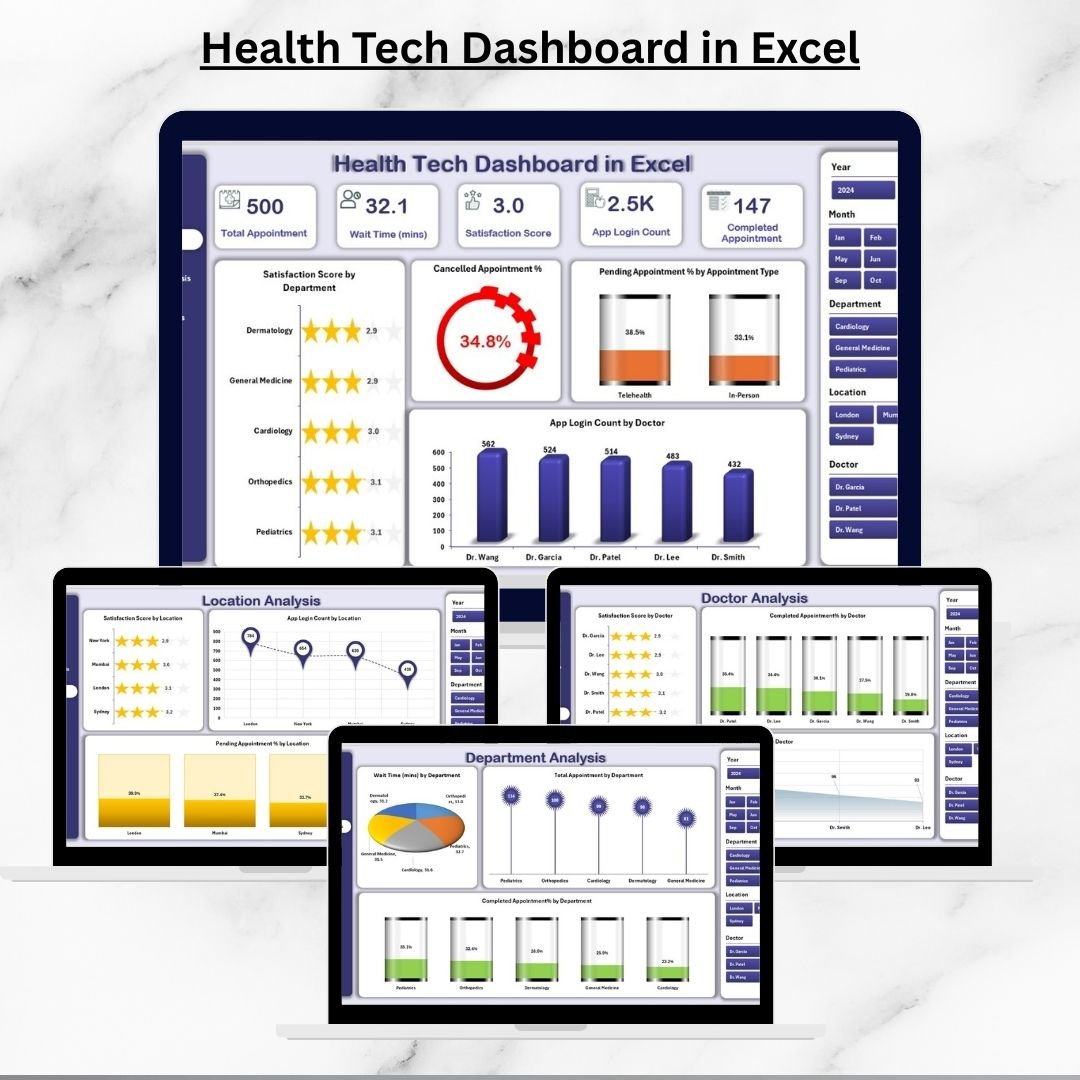
📊 5 Analytical Pages – Overview, Department, Location, Doctor, and Monthly Trends.
-
🎯 KPI Cards – Track total appointments, cancellations, pending %, satisfaction score, and logins.
-
⚡ Dynamic Charts – Visualize performance by department, doctor, and location.
-
🗂 Support Sheet – Easy backend data entry for automatic updates.
-
🚦 Interactive Slicers – Filter results by department, doctor, or time period instantly.
-
🛠 Customizable – Add KPIs like patient wait times or new digital metrics.
-
💰 Cost-Effective – Built in Excel, no pricey healthcare analytics software needed.
📂 What’s Inside the Dashboard
-
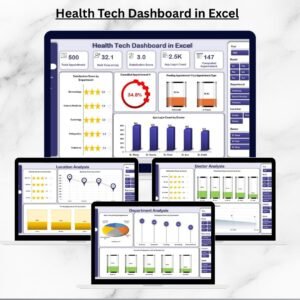
Overview Page – Central hub with 5 KPI cards and 4 charts covering satisfaction, cancellations, pending %, and digital adoption.
-
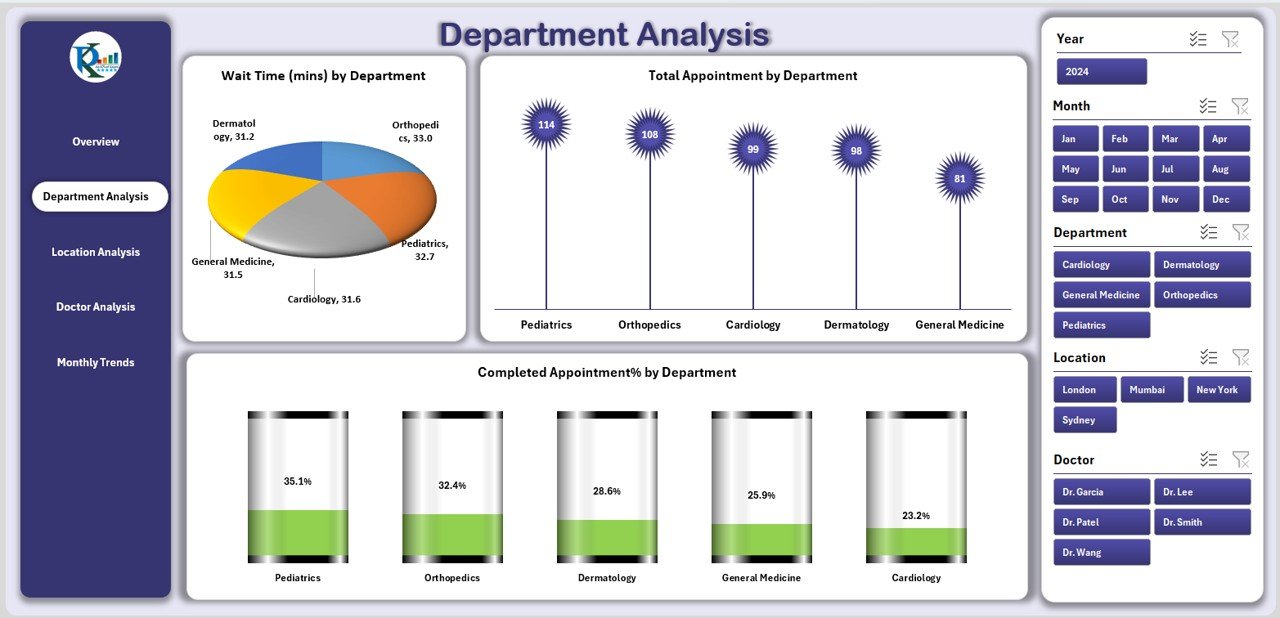
Department Analysis – Compare wait times, appointment counts, and completion rates across departments.
-
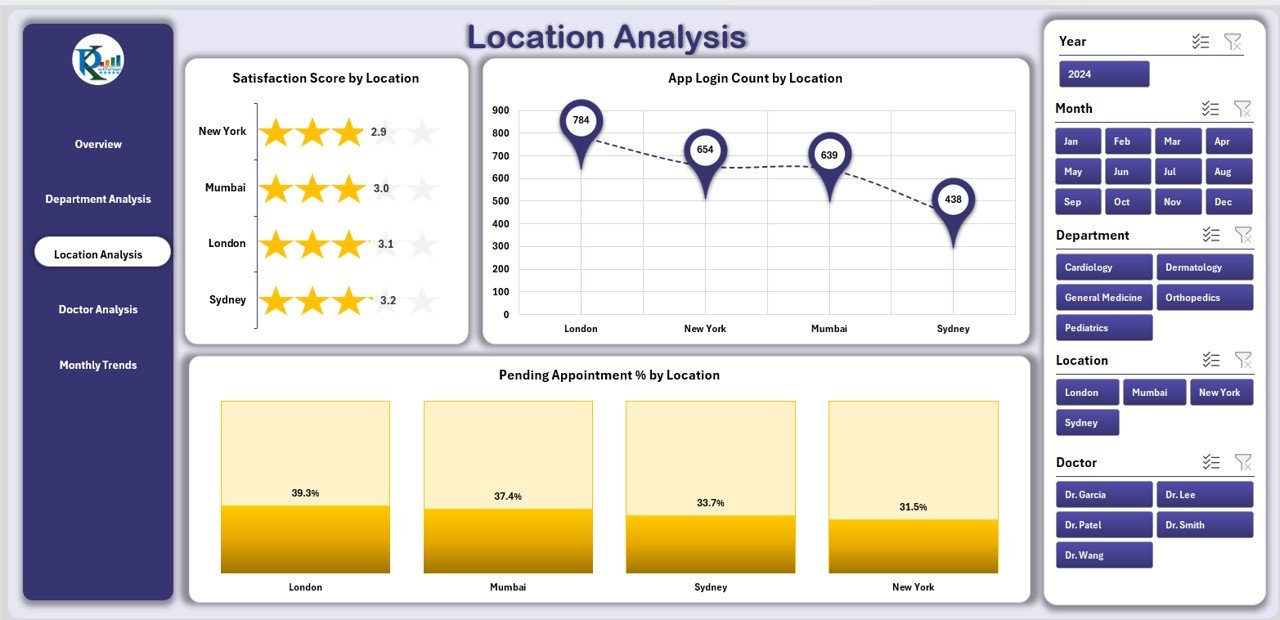
Location Analysis – Evaluate satisfaction, app usage, and pending % across hospitals or clinics.
-
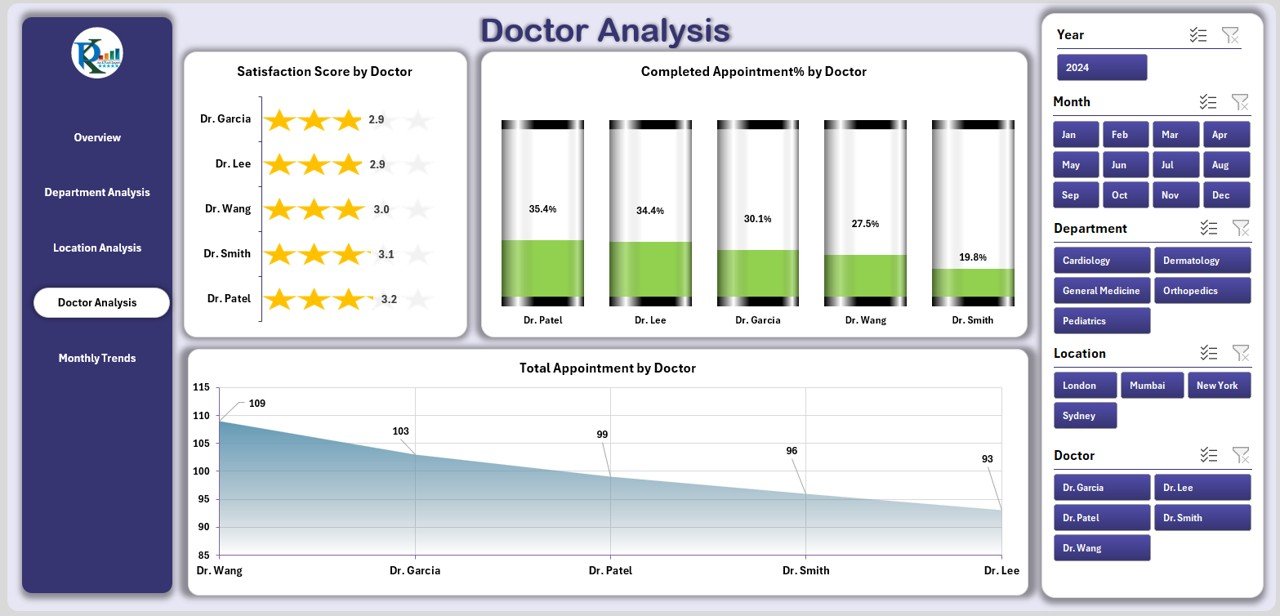
Doctor Analysis – Track satisfaction scores, total appointments, and completion % for each doctor.
-
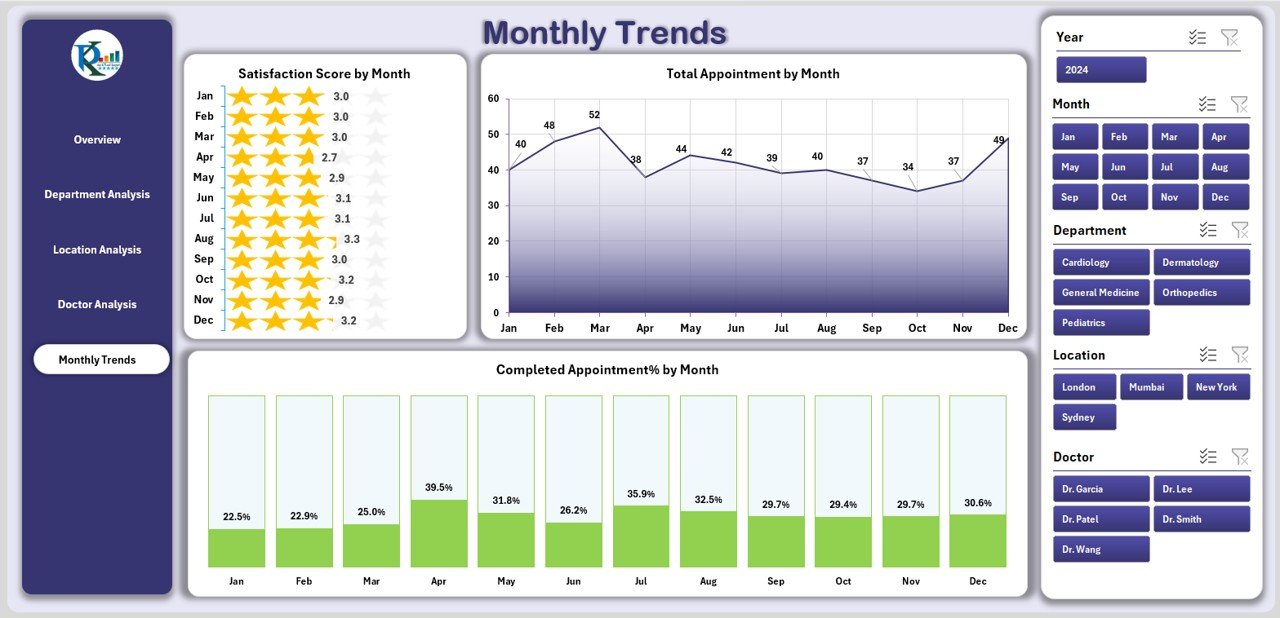
Monthly Trends – Monitor satisfaction scores, appointment counts, and completion rates month by month.
-
Support Sheet – Enter appointment details, doctor info, and patient feedback in a structured way.
📖 How to Use the Health Tech Dashboard
-
Enter Data – Add raw data (appointments, feedback, doctors, etc.) in the Support Sheet.
-
Navigate Pages – Use the left-side Page Navigator to switch views.
-
Filter Insights – Apply slicers to focus on specific departments, doctors, or months.
-
Analyze Trends – Check KPIs and trend charts to identify bottlenecks or success areas.
-
Take Action – Use insights to reduce cancellations, shorten wait times, and improve satisfaction.
👥 Who Can Benefit from This Dashboard?
-
🏥 Hospitals – Track department-level efficiency and doctor performance.
-
🩺 Clinics – Improve patient satisfaction and reduce appointment delays.
-
🚀 Health Startups – Monitor digital adoption and app usage trends.
-
🧑⚕️ Doctors & Managers – Compare performance across individuals and locations.
-
🏛 Healthcare Administrators – Gain high-level oversight for strategic decisions.
This dashboard ensures that patient care and operational efficiency remain measurable, trackable, and improvable.
✅ Click here to read the Detailed blog post
Visit our YouTube channel to learn step-by-step video tutorials











Reviews
There are no reviews yet.