The food and beverage industry operates in a fast-paced environment where businesses must constantly monitor production, inventory availability, sales performance, operational costs, and profitability. Even small delays in analyzing performance data can lead to stock shortages, revenue loss, or inefficient operations. However, many organizations still rely on disconnected spreadsheets and manual reporting methods, making real-time decision-making difficult.
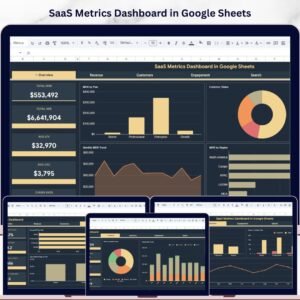
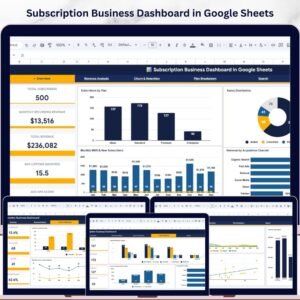
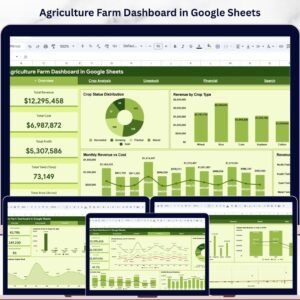
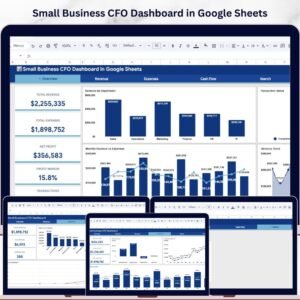
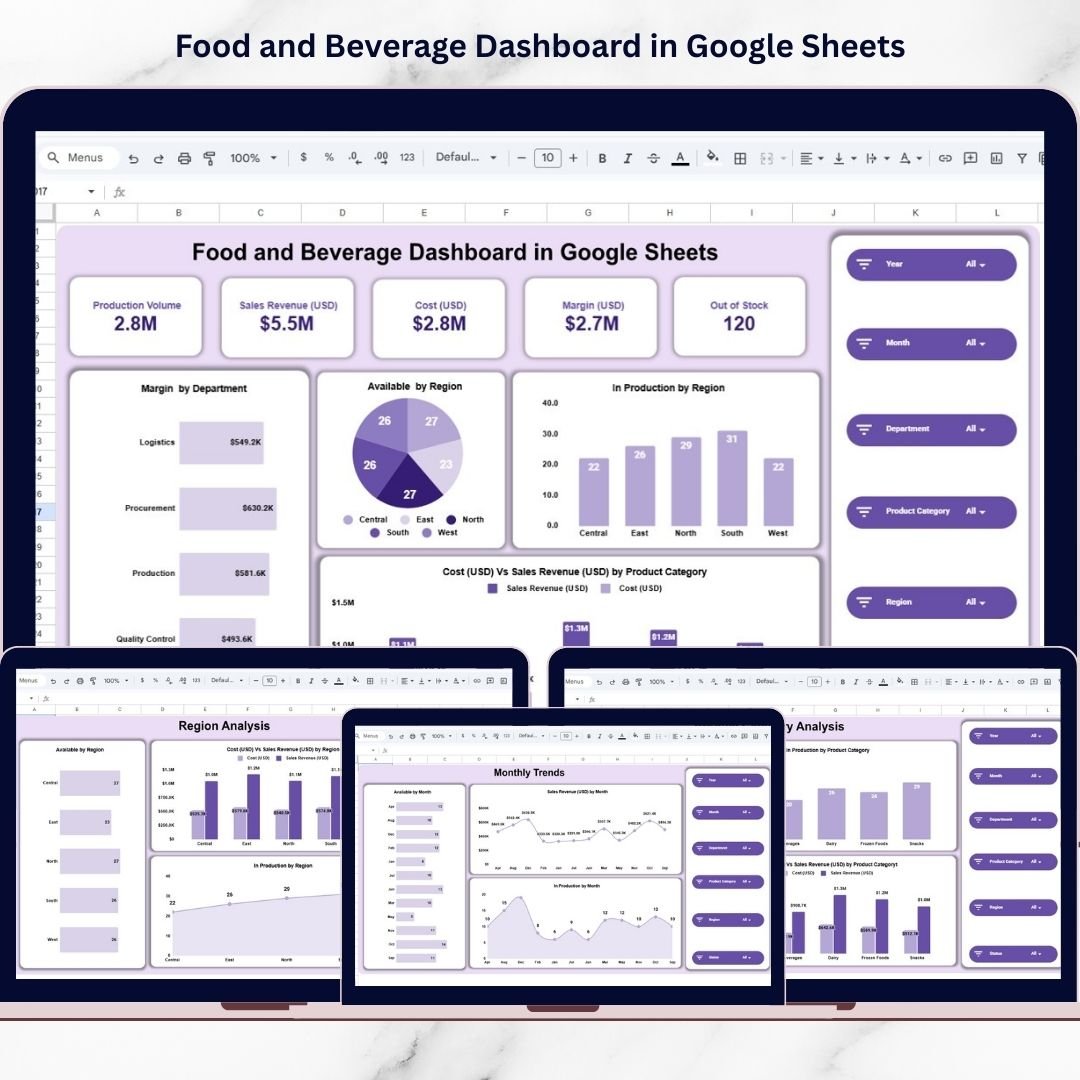
The Food and Beverage Dashboard in Google Sheets is a powerful, ready-to-use analytics solution designed to transform operational data into clear, actionable business insights. Built entirely in Google Sheets, this interactive dashboard provides centralized reporting, automated calculations, and dynamic visual analysis — all accessible from the cloud.
Instead of reviewing multiple reports separately, decision-makers can analyze production, sales, costs, margins, and inventory performance from a single professional dashboard interface. Because Google Sheets is cloud-based, teams can collaborate in real time, access dashboards from anywhere, and ensure data transparency across departments. 📊🍽️
Designed for simplicity and efficiency, the dashboard allows users to filter performance instantly using slicers such as year, month, department, product category, and region. As data updates, charts and KPI cards refresh automatically, enabling faster analysis and smarter decision-making.
Whether you manage a restaurant chain, food manufacturing company, beverage business, or retail food operation, this dashboard helps you gain operational visibility and improve profitability through data-driven insights.
## Key Features of Food and Beverage Dashboard in Google Sheets
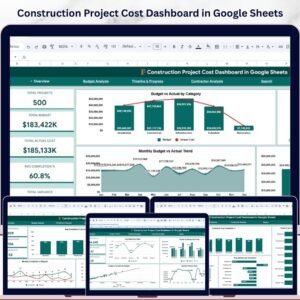
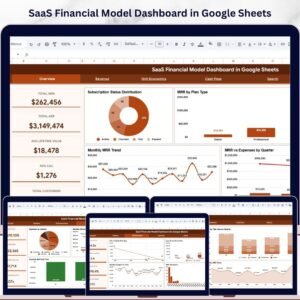
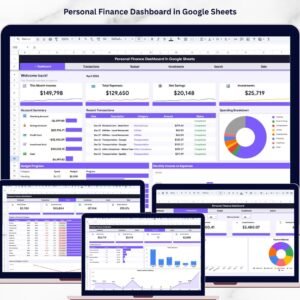
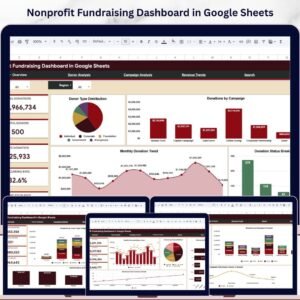
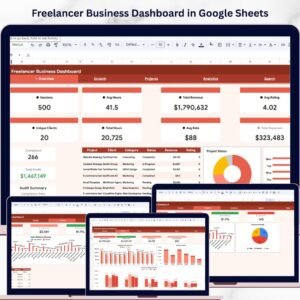
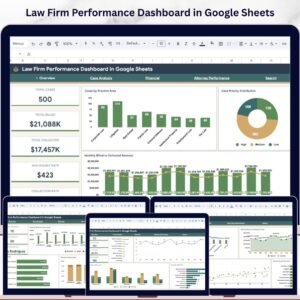
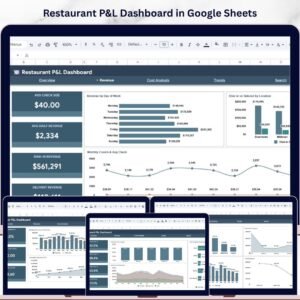
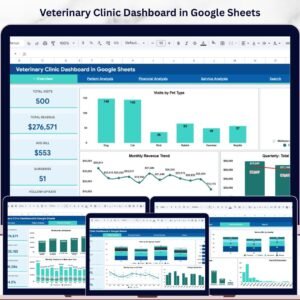
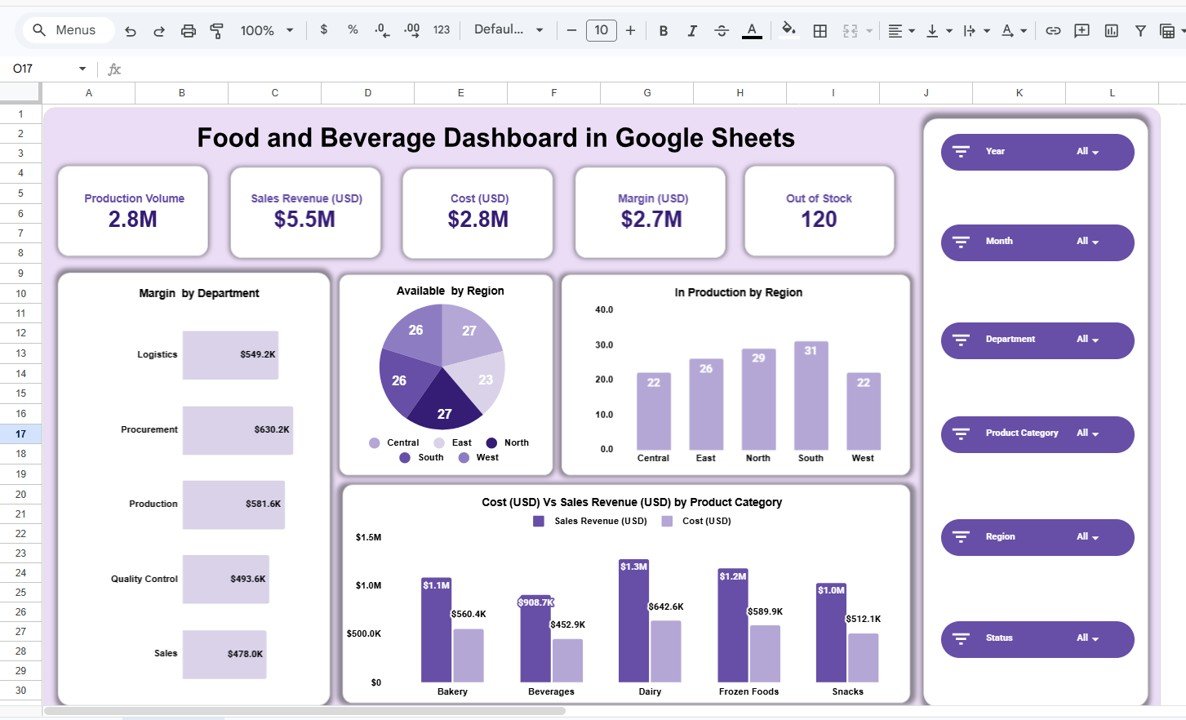
📊 Executive KPI Dashboard – Monitor production volume, revenue, costs, margins, and stock availability at a glance.
🎛️ Interactive Filters & Slicers – Analyze performance by Year, Month, Department, Product Category, Region, and Status.
📈 Dynamic Visual Charts – Automatically updated charts simplify performance analysis.
📦 Inventory Availability Monitoring – Identify out-of-stock risks quickly.
🌍 Regional Performance Analysis – Compare business performance across geographic markets.
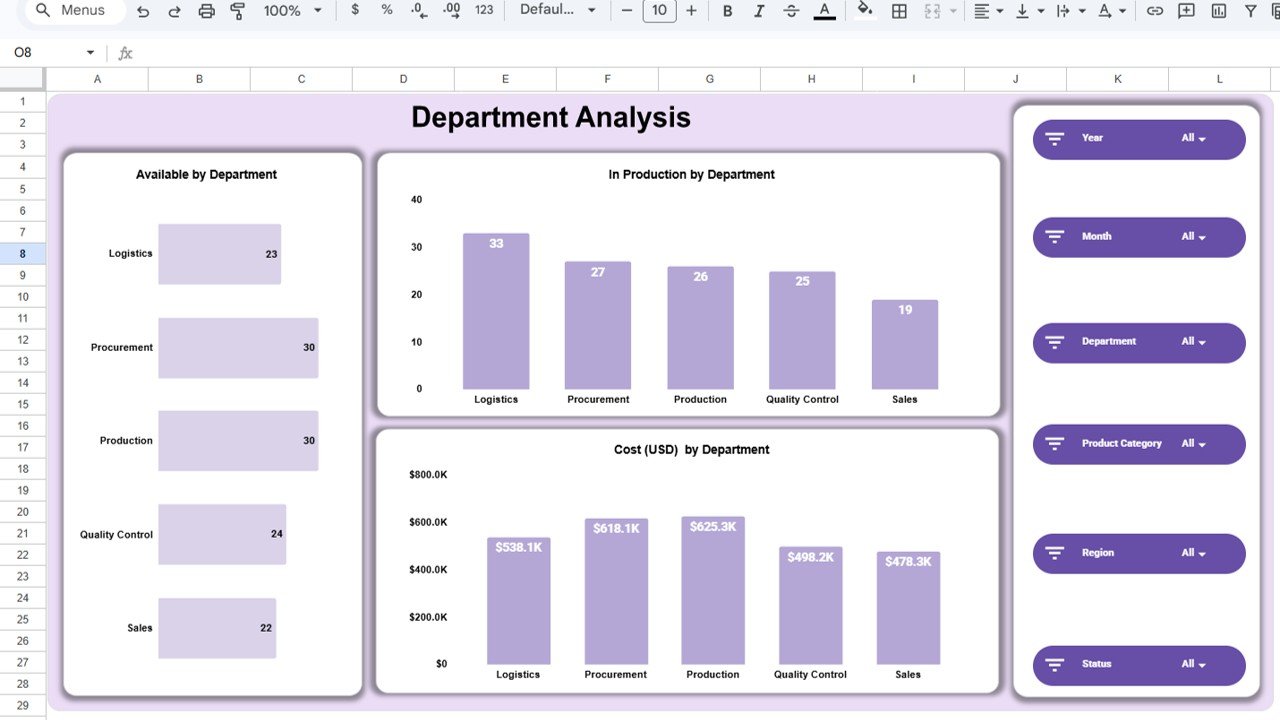
🏭 Department Efficiency Tracking – Evaluate operational performance across departments.
📅 Monthly Trend Analysis – Understand seasonality and demand patterns.
☁️ Cloud-Based Collaboration – Access and share dashboards anytime, anywhere.
These features convert Google Sheets into a lightweight business intelligence platform.
## What’s Inside the Food and Beverage Dashboard in Google Sheets
This ready-to-use dashboard includes multiple analytical pages:
✅ Main Dashboard – Executive summary displaying KPI cards and performance visuals.
✅ Department Analysis Page – Operational efficiency analysis by department.
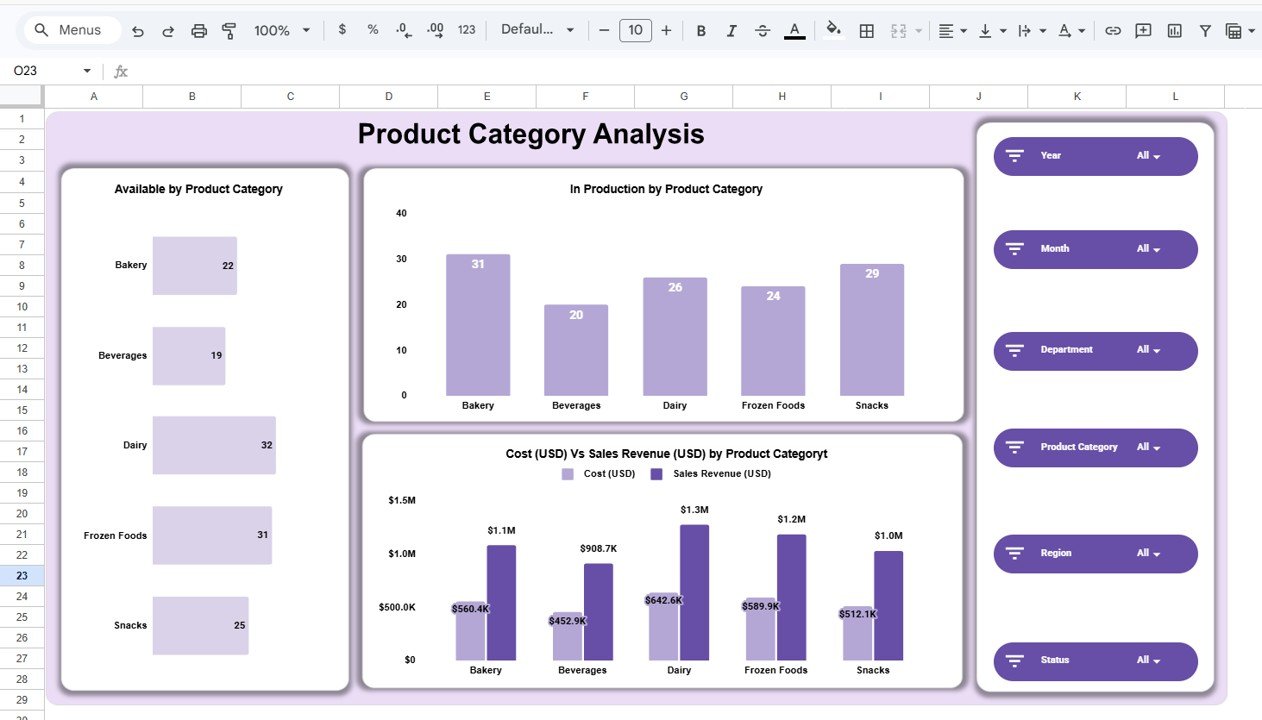
✅ Product Category Analysis Page – Profitability and performance across product categories.
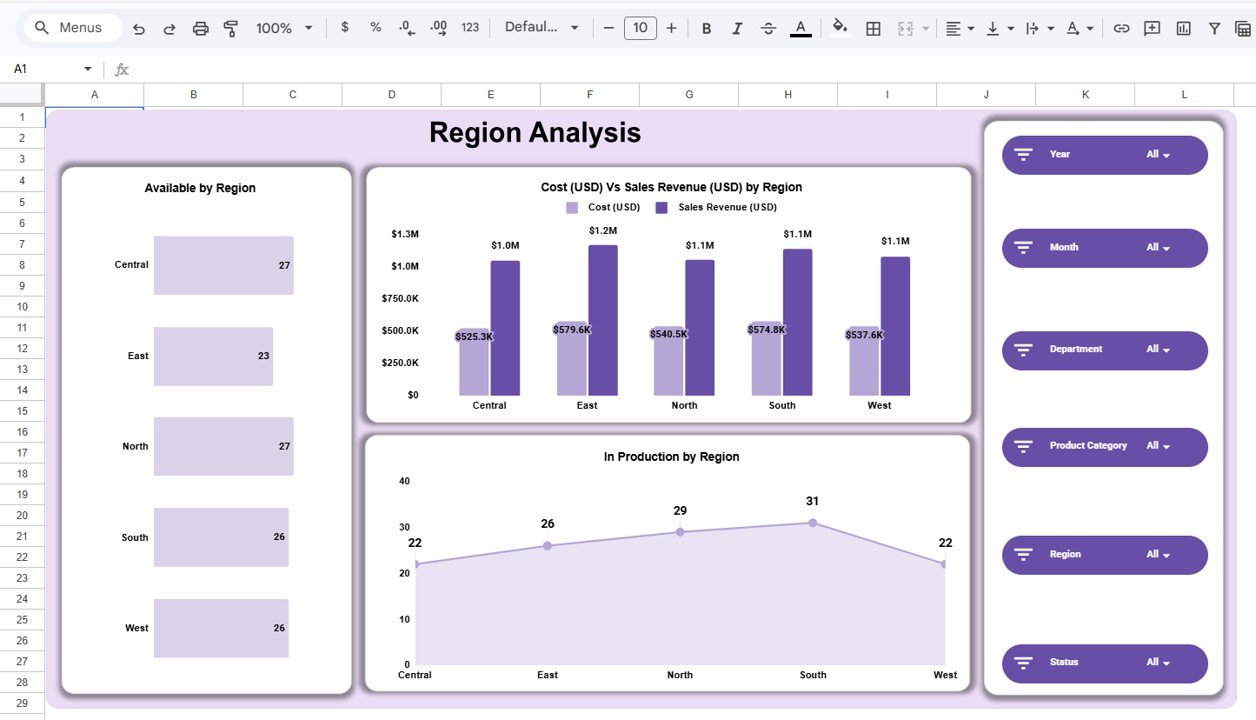
✅ Region Analysis Page – Geographic performance comparison dashboards.
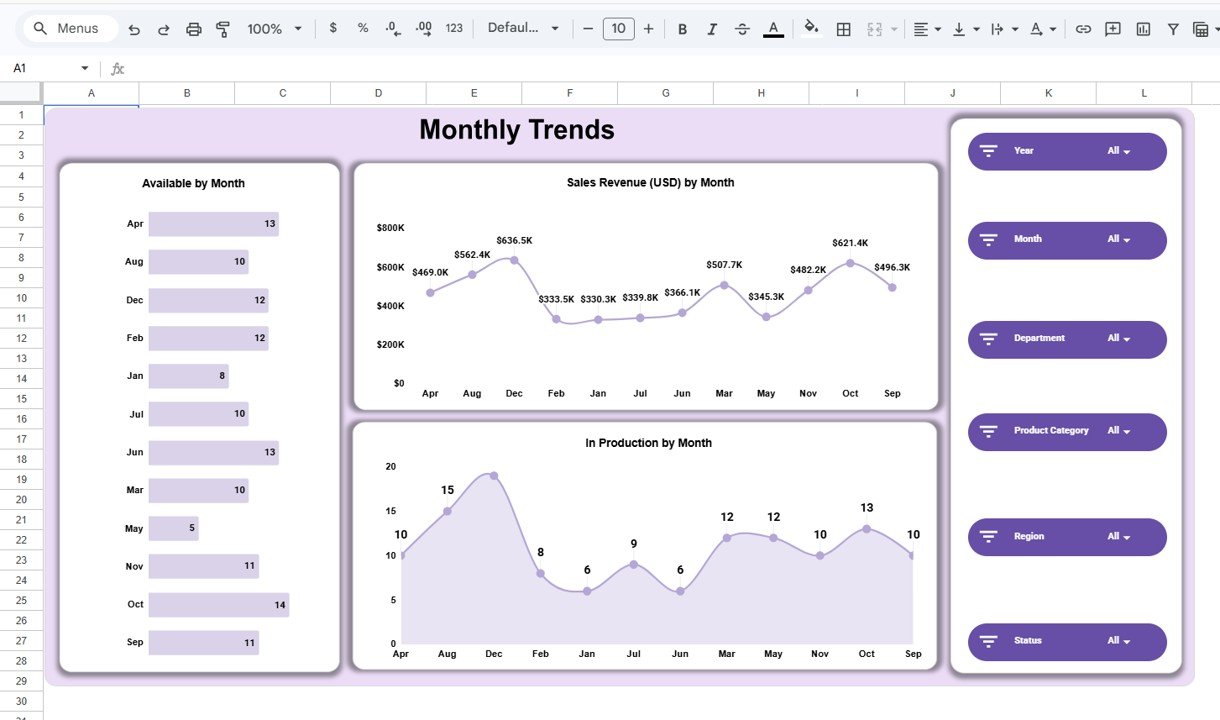
✅ Monthly Trends Page – Time-based analysis showing production, revenue, and availability trends.
Each page provides a focused analytical perspective to support better business decisions.
## How to Use the Food and Beverage Dashboard in Google Sheets
Using the dashboard is simple and beginner-friendly:
1️⃣ Enter or update operational data in the data sheet.
2️⃣ Open the main dashboard for performance overview.
3️⃣ Apply filters such as month, department, or region.
4️⃣ Review KPI cards and visual charts.
5️⃣ Analyze department, product, and regional performance.
6️⃣ Monitor trends to support strategic decisions.
Within minutes, businesses can start analyzing performance professionally.
## Who Can Benefit from This Food and Beverage Dashboard in Google Sheets
This dashboard is ideal for:
🍴 Restaurant chains and food service businesses
🏭 Food manufacturing companies
🥤 Beverage producers
📦 Supply chain and inventory managers
📊 Business analysts and operations managers
🛒 Retail food businesses
From small businesses to enterprise operations, anyone managing food and beverage performance can benefit from this dashboard.
A centralized analytics system empowers organizations to move beyond manual reporting. By combining KPI tracking, interactive filters, and automated visuals, the Food and Beverage Dashboard in Google Sheets enables faster insights and smarter decisions.
Instead of reacting to problems, businesses gain proactive control over production, inventory, and profitability — leading to improved operational efficiency and sustainable growth. ✅
### Click here to read the Detailed blog post
Watch the step-by-step video tutorial:
Visit our YouTube channel to learn step-by-step video tutorials:
👉 YouTube.com/@NeotechNavigators