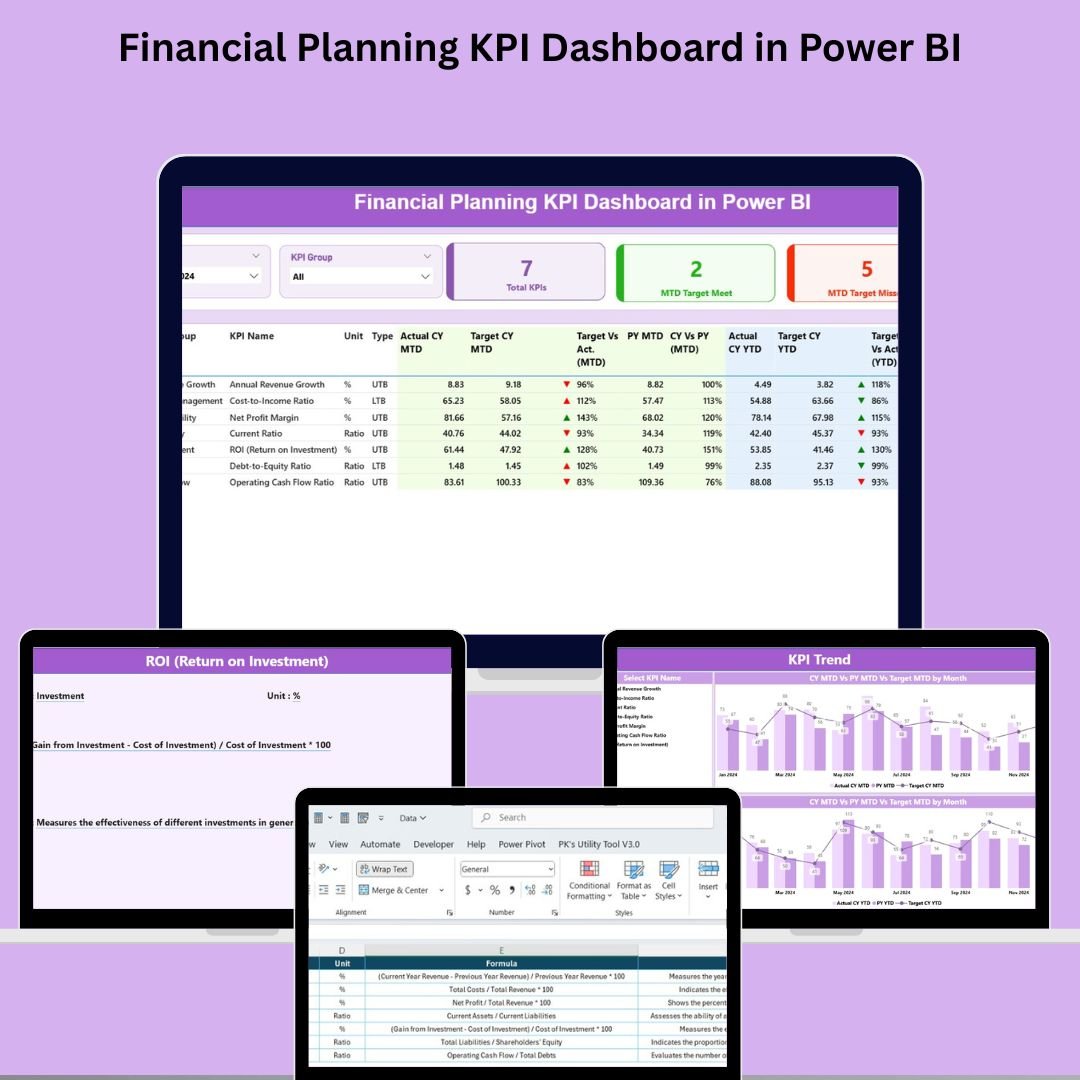
Financial planning is the heartbeat of every thriving organization. But in a world driven by data, spreadsheets and static reports are no longer enough. You need dynamic, real-time visibility into your performance—and that’s exactly what the Financial Planning KPI Dashboard in Power BI delivers.
Designed for CFOs, finance teams, and business strategists, this dashboard offers a crystal-clear view of your Month-to-Date (MTD) and Year-to-Date (YTD) financial performance. Whether you want to track revenue, control expenses, compare targets, or analyze trends—this is your all-in-one financial intelligence tool. 📊🚀
Let’s explore why this Power BI dashboard should be in every financial planner’s toolkit:
🛠️ Key Features of Financial Planning KPI Dashboard in Power BI
📌 Summary Page – Your Financial Control Hub
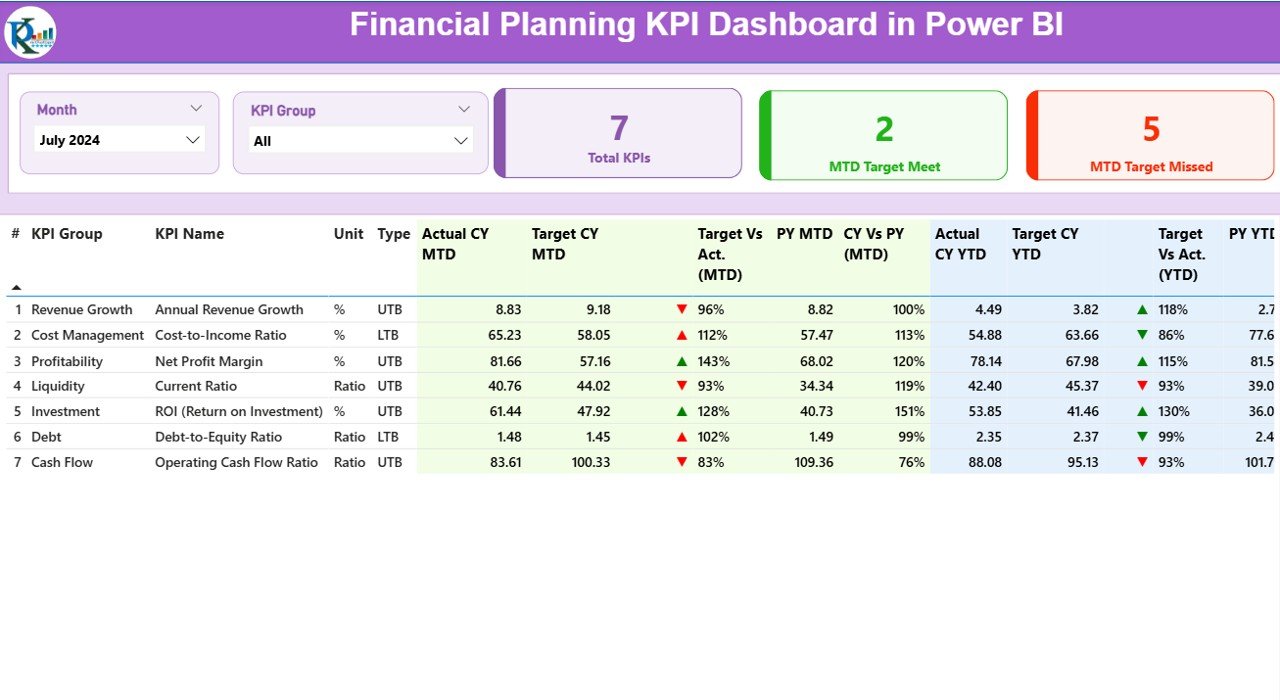
Filter by Month and KPI Group, and get an at-a-glance view of:
-
✅ Total KPIs
-
🎯 MTD Target Met
-
⚠️ MTD Target Missed
📋 Detailed KPI Table
View and compare for each KPI:
-
KPI Number, Name, Group, Unit, and Type (UTB/LTB)
-
MTD & YTD Actuals vs Targets with percentage performance
-
CY vs PY comparisons (MTD and YTD)
-
Conditional formatting with green/red arrows (▲▼) for instant visual cues
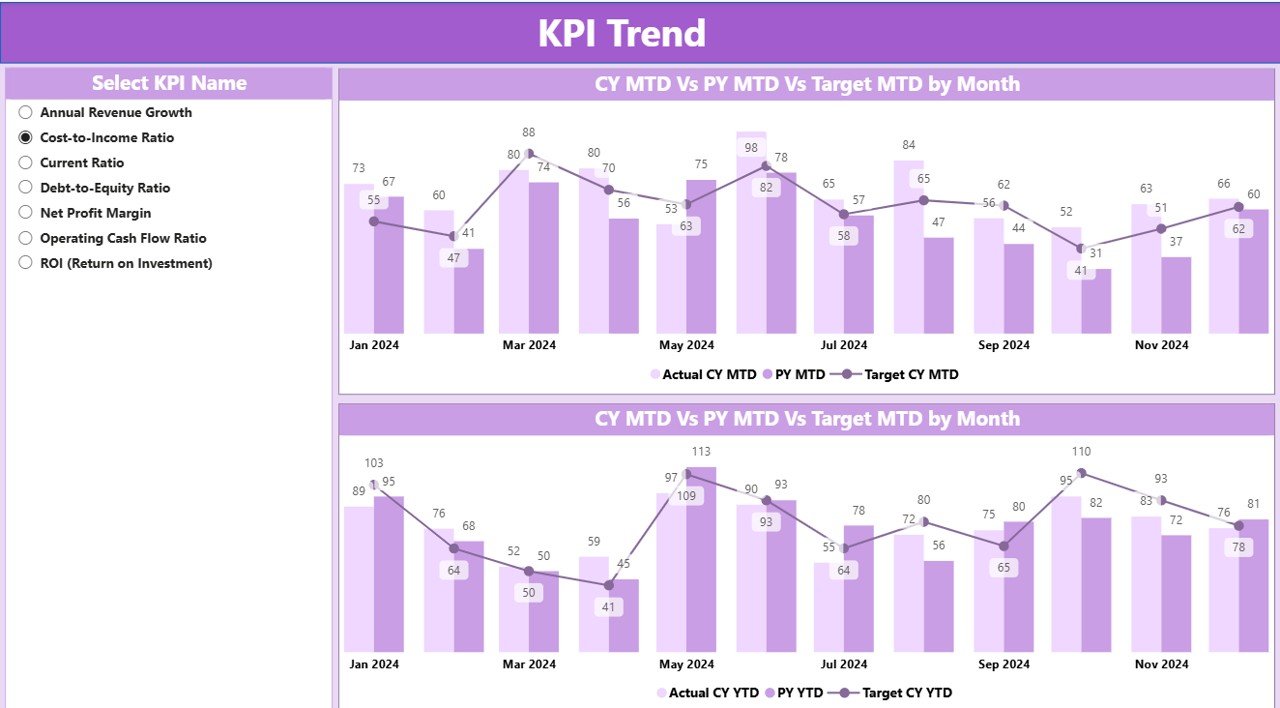
📈 KPI Trend Page – Visualize Growth Over Time
Use combo charts to track:
-
📅 Current Year vs Previous Year Actuals
-
🎯 Target Values
-
📉 Month-by-month trends to identify seasonal dips or spikes
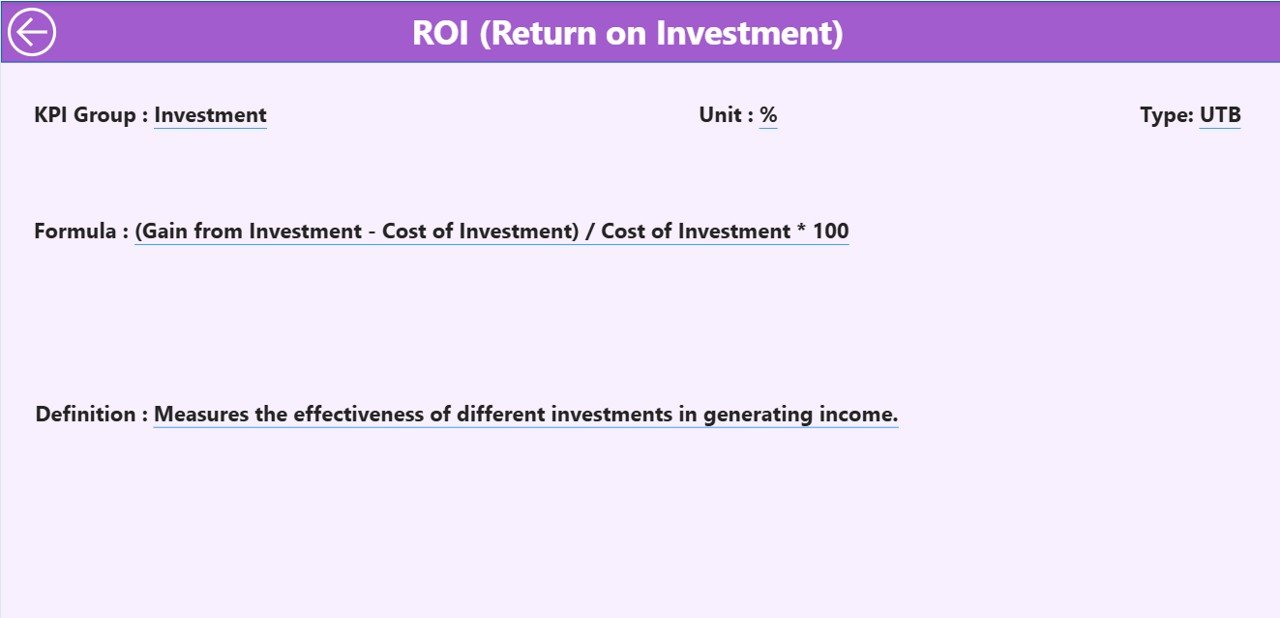
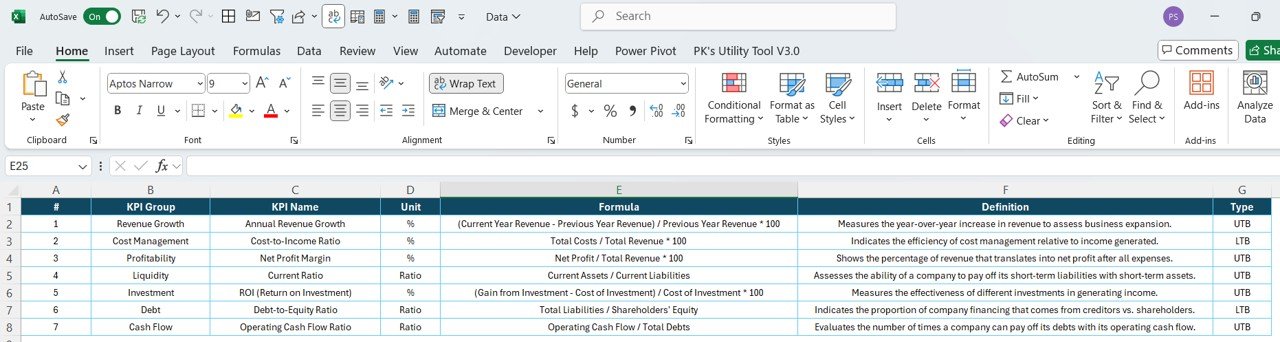
🎯 KPI Definition Page – Drill Through Transparency
Click on any KPI to drill through and access its:
-
Formula
-
Description
-
Unit of Measurement
-
Type (LTB or UTB)
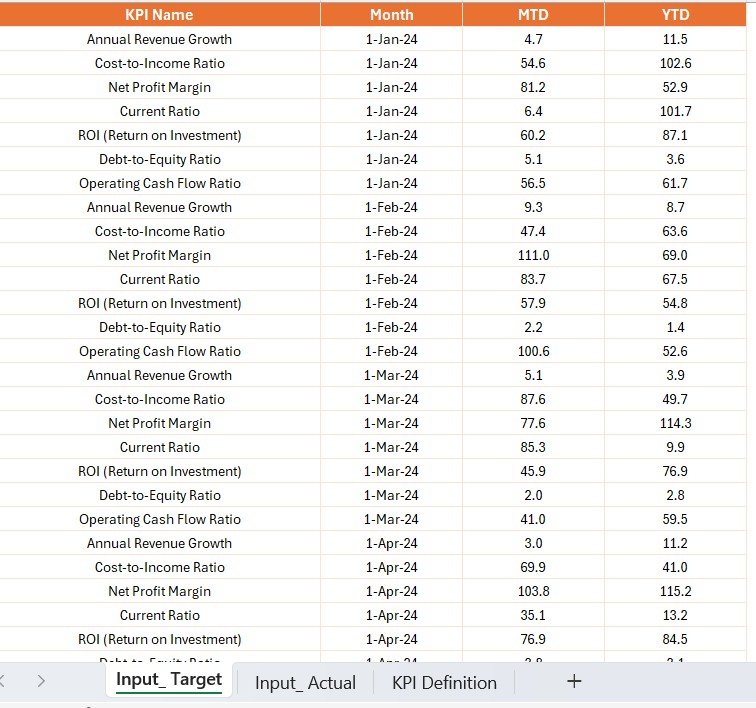
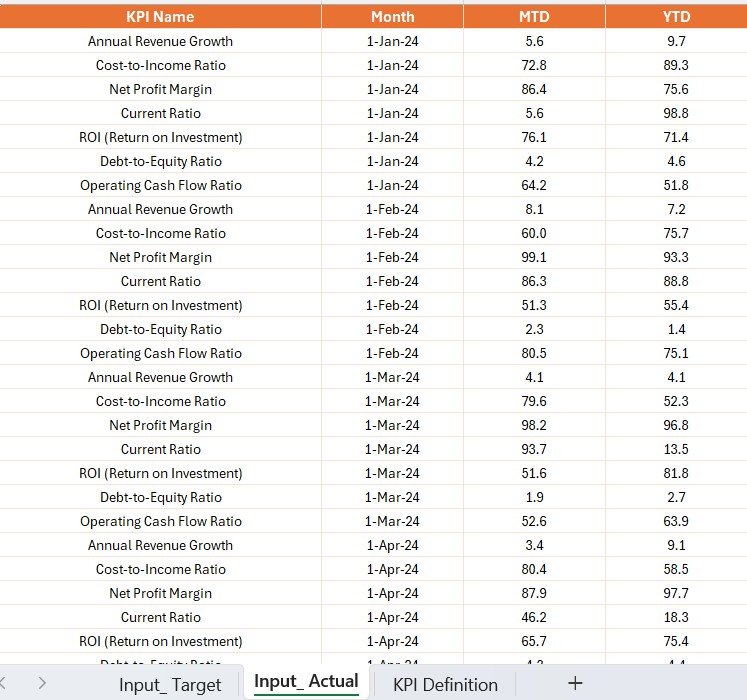
📥 Excel-Driven Backend
Connects directly to a structured Excel file with:
-
Input_ActualSheet – Enter actual monthly MTD & YTD data -
Input_TargetSheet – Define target values for each KPI -
KPI DefinitionSheet – Set KPI logic, formulas, units, and categories
📦 What’s Inside the Financial Planning KPI Dashboard?
🔸 Summary Page
Gives a big-picture overview of your financial health using slicers, cards, and a powerful data table.
🔸 KPI Trend Page
Visualize individual KPI performance over time with interactive combo charts.
🔸 KPI Definition Page
Understand every metric with in-depth drill-through access to KPI logic and definitions.
🔸 Excel Integration
Keep things flexible and user-friendly for your finance team—no need for SQL or ERP complexity.
📌 How to Use the Dashboard
✔️ Step 1: Enter actuals into the Input_Actual Excel sheet
✔️ Step 2: Define your monthly targets in the Input_Target sheet
✔️ Step 3: Set KPI logic and descriptions in the KPI Definition sheet
✔️ Step 4: Open Power BI and refresh the dataset
✔️ Step 5: Use filters, slicers, and drill-through to analyze performance and compare trends
👥 Who Can Benefit from This Dashboard?
✅ Finance Teams & CFOs – Monitor department budgets, variances, and forecasts
✅ Business Analysts – Dive deep into performance data for actionable insights
✅ Consulting Firms – Share KPI-rich dashboards with clients
✅ Startups & SMEs – Visualize growth targets without an ERP system
✅ Project Managers – Track cost per unit, spend ratios, and financial health
✅ Nonprofits & Educational Institutes – Manage grants, donations, and expenditures
🎯 Whether you’re reviewing monthly budgets or planning next quarter’s strategy, this dashboard gives you the clarity and agility to pivot at the right time.
🔗 Click here to read the Detailed blog post
🎥 Visit our YouTube channel to learn step-by-step video tutorials


Reviews
There are no reviews yet.