Are you still managing budgets and financial reports through scattered spreadsheets? If yes, you’re exposing your organization to delays, miscalculations, and costly financial risks.
Finance and accounting teams handle budget allocation, forecast planning, actual spending, and variance monitoring every single month. However, without structured reporting, it becomes difficult to see the complete financial picture in one place. Managers often struggle to track overspending departments, analyze expense categories, and monitor monthly trends efficiently.
The Finance and Accounting Dashboard in Google Sheets eliminates this chaos.
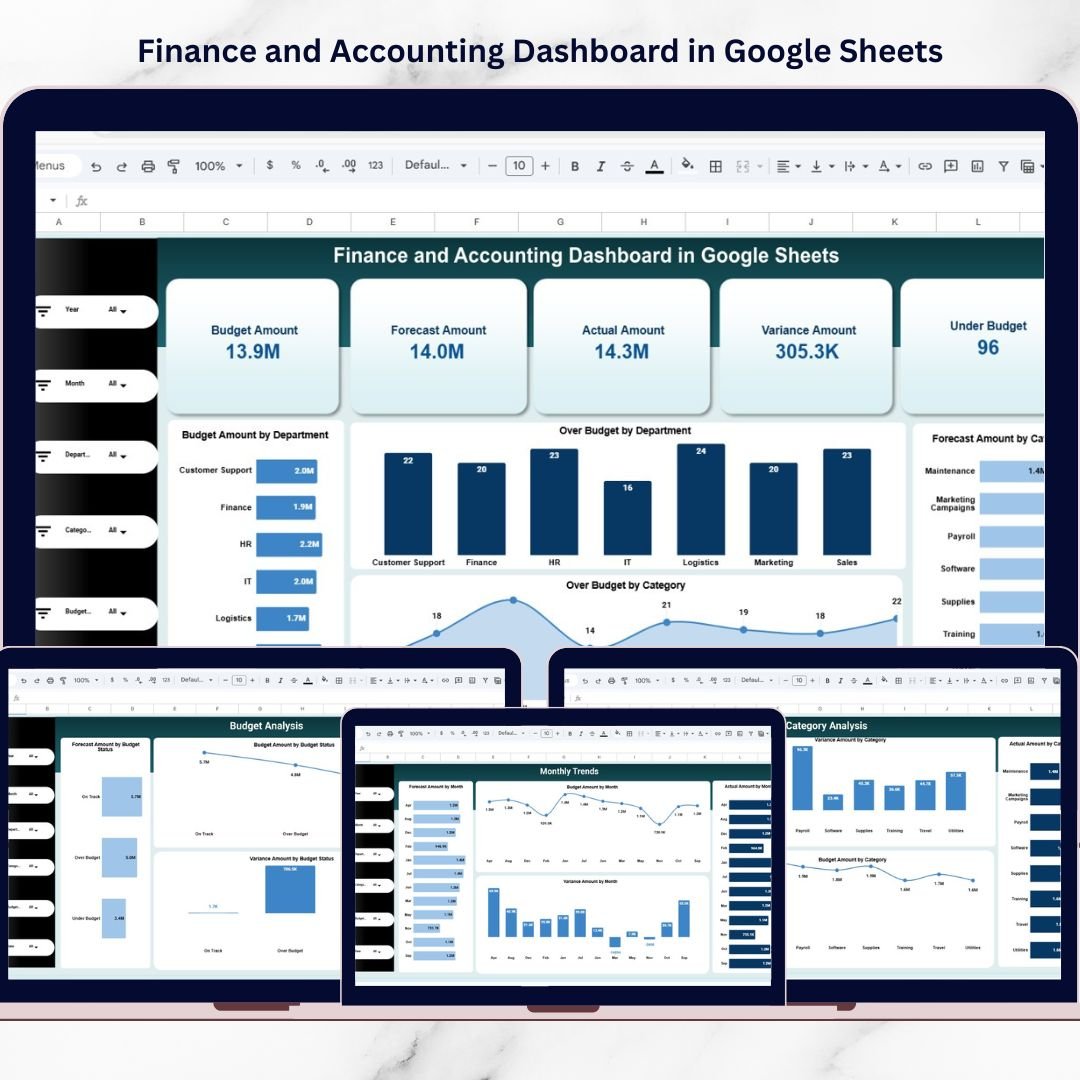
This ready-to-use, interactive financial monitoring system transforms raw accounting data into clear, visual, and actionable insights. Instead of reviewing multiple files manually, you get a centralized dashboard that tracks Budget Amount, Forecast Amount, Actual Spending, Variance, and Budget Status — all in one powerful interface.
Built entirely in Google Sheets, this dashboard enables real-time collaboration, dynamic filtering, and easy customization — without expensive ERP analytics modules or BI tools.
If you want stronger cost control, smarter forecasting, and improved financial discipline, this dashboard is built for you.
🚀 Key Feature of Finance and Accounting Dashboard in Google Sheets
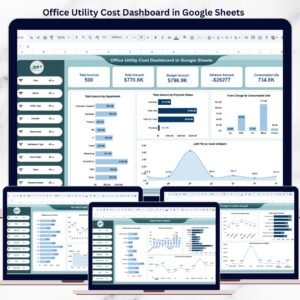
✅ Executive Summary KPI Cards – Instantly monitor Budget, Forecast, Actual, Variance, and Under Budget Count.
✅ Department-Level Analysis – Compare financial performance across teams.
✅ Category-Based Expense Tracking – Analyze spending by expense category.
✅ Budget Status Monitoring – Track Over Budget, Under Budget, and On Track performance.
✅ Monthly Trend Analysis – Identify seasonal financial patterns.
✅ Interactive Filters – Analyze by Year, Month, Department, Category, and Budget Status.
✅ Cloud-Based Collaboration – Multi-user real-time access.
✅ Easy Customization – Modify departments and categories effortlessly.
This dashboard becomes your financial control center.
📦 What’s Inside the Finance and Accounting Dashboard in Google Sheets
This solution includes multiple structured analysis pages:
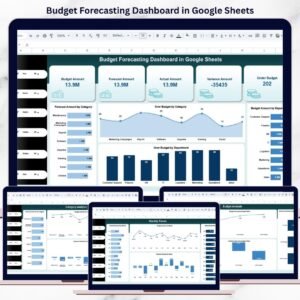
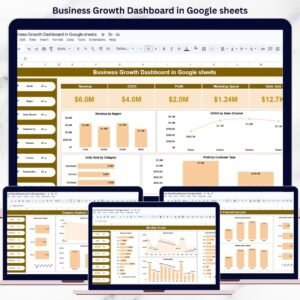
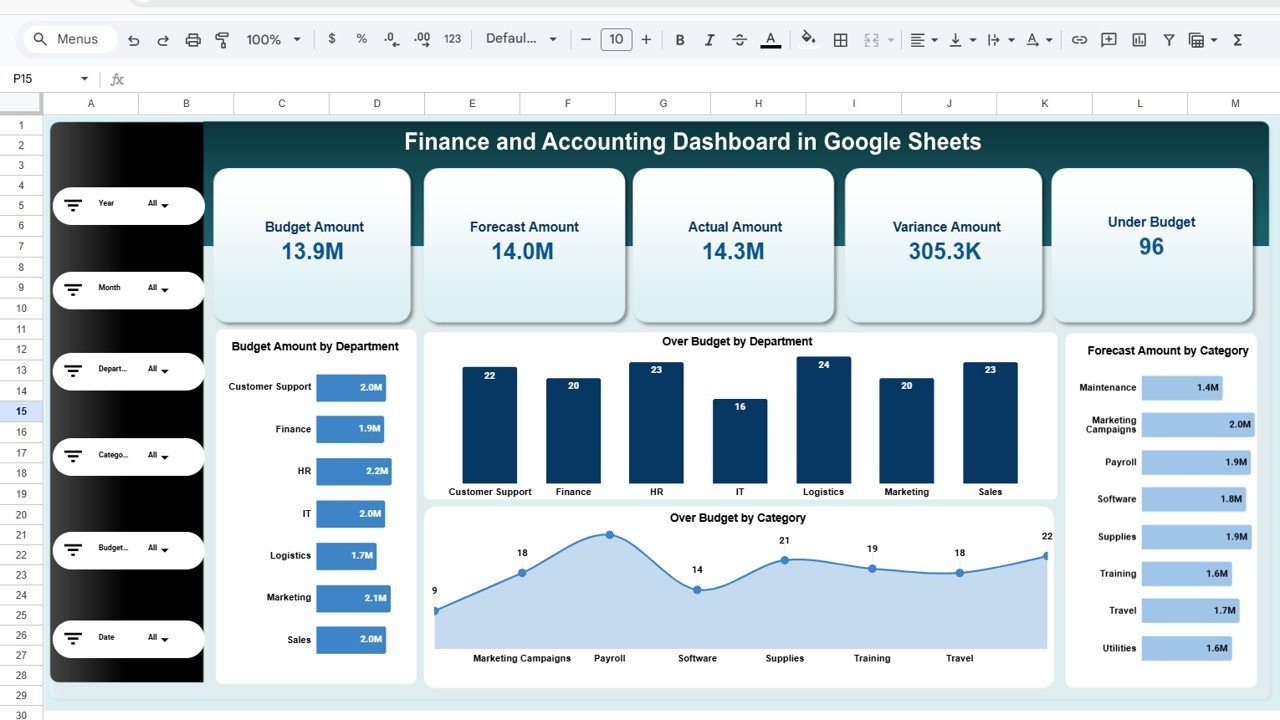
1️⃣ Main Dashboard (Executive Summary Page)
-
Budget Amount
-
Forecast Amount
-
Actual Amount
-
Variance Amount
-
Under Budget Count
-
Budget by Department
-
Over Budget by Department
-
Forecast by Category
-
Over Budget by Category
This page provides instant financial health visibility.
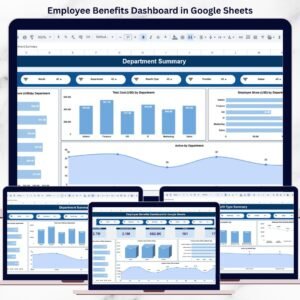
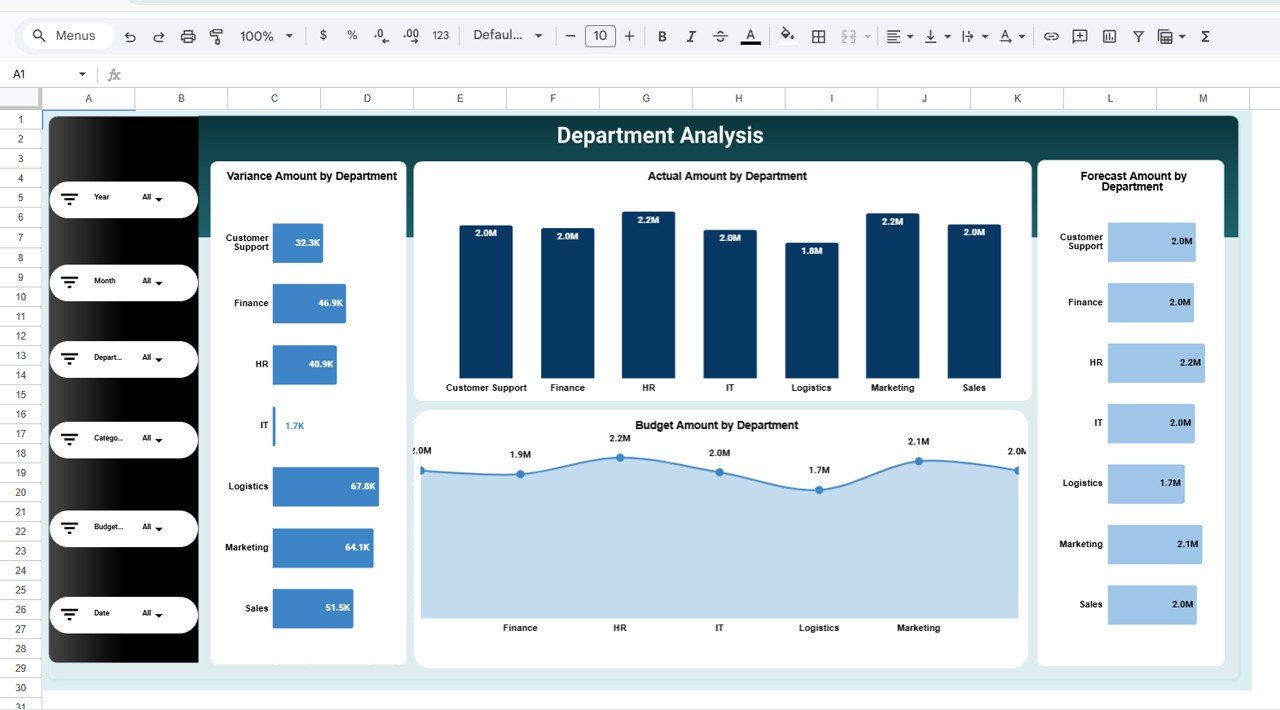
2️⃣ Department Analysis Page
-
Budget Amount by Department
-
Forecast Amount by Department
-
Actual Amount by Department
-
Variance by Department
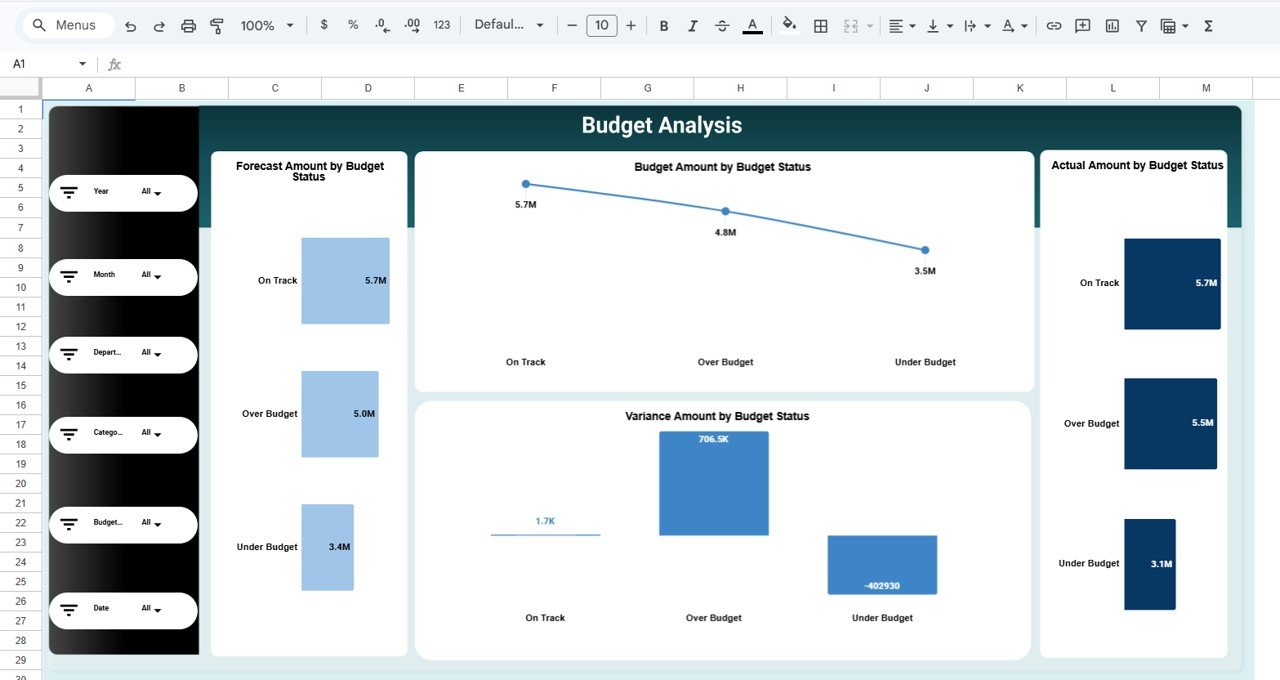
3️⃣ Budget Analysis Page
-
Forecast by Budget Status
-
Budget by Budget Status
-
Actual by Budget Status
-
Variance by Budget Status
Quickly identify overspending areas.
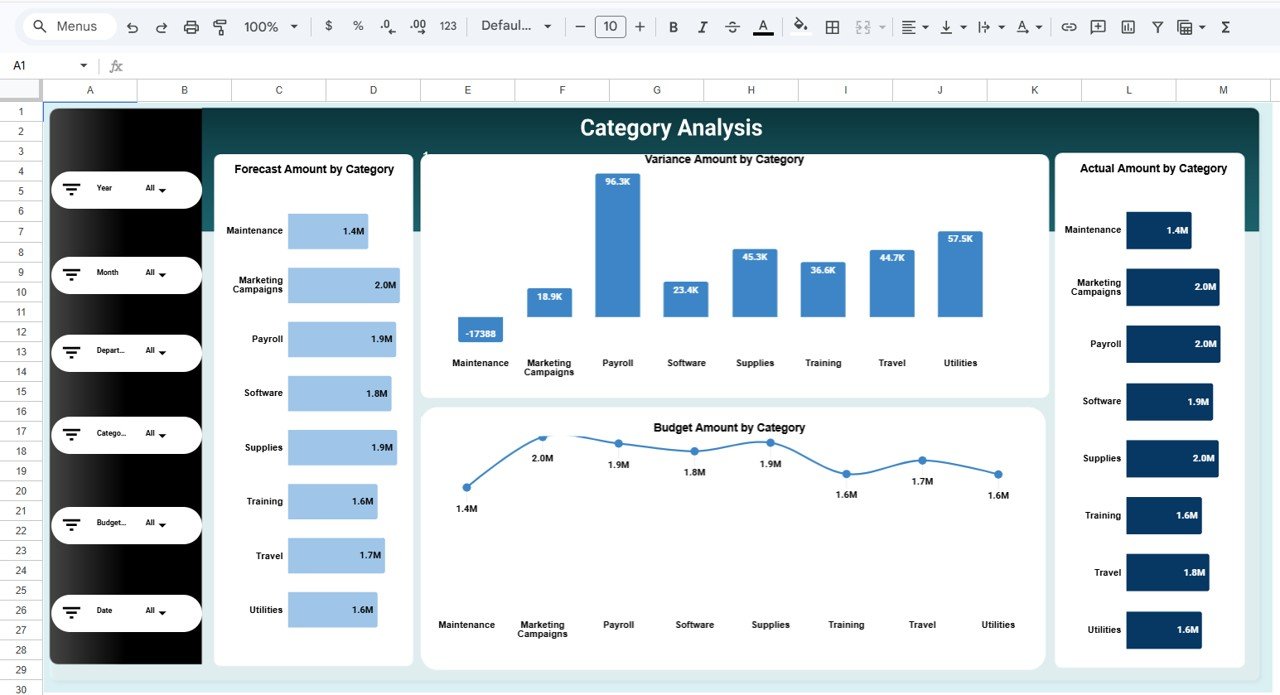
4️⃣ Category Analysis Page
-
Budget by Category
-
Forecast by Category
-
Actual by Category
-
Variance by Category
Analyze detailed expense breakdowns.
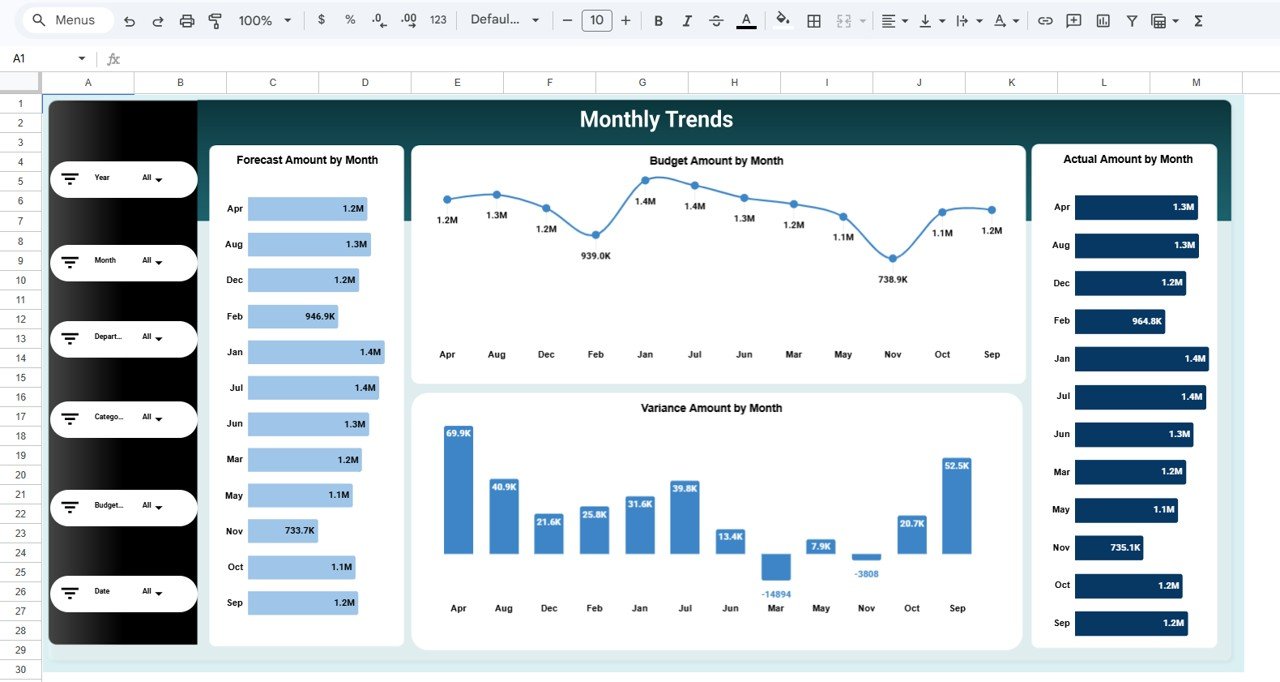
5️⃣ Monthly Trends Page
-
Budget by Month
-
Forecast by Month
-
Actual by Month
-
Variance by Month
Track financial movement over time.
Everything is structured for simple workflow: Input → Analyze → Control → Improve.
⚙️ How to Use the Finance and Accounting Dashboard in Google Sheets
Using the dashboard is straightforward:
-
Enter monthly Budget, Forecast, and Actual numbers in the data sheet.
-
Ensure department and category classification is consistent.
-
Use dropdown filters to analyze financial performance.
-
Review KPI summary cards for quick executive overview.
-
Monitor variance and budget status weekly.
-
Use Monthly Trends page for planning and forecasting improvements.
Within minutes, you gain complete financial visibility.
👥 Who Can Benefit from This Finance and Accounting Dashboard in Google Sheets
This dashboard is ideal for:
-
Finance Managers
-
Accounting Teams
-
CFOs
-
Small Business Owners
-
Department Heads
-
Budget Controllers
-
Operations Managers
-
Startups and Enterprises
Any organization that manages budgets and financial planning can use this dashboard effectively.
By centralizing budget, forecast, actual spending, and variance analysis, this dashboard eliminates financial confusion. Managers identify overspending departments quickly, improve forecast accuracy, and strengthen cost control policies.
Instead of reactive financial management, you shift toward proactive, data-driven financial leadership.
If you want structured budget tracking with interactive filtering and real-time collaboration, this dashboard delivers exactly what your business needs.