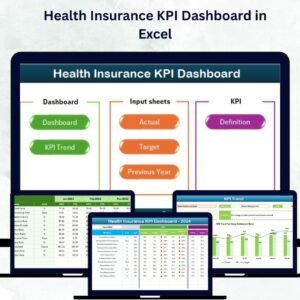
In today’s sustainability-driven world, businesses are under constant pressure to track, manage, and improve their environmental impact 🌿. The Environmental KPI Scorecard in Excel offers an easy, efficient, and affordable way to measure performance across key environmental indicators — empowering organizations to make data-backed decisions toward a greener future 🌎.
This ready-to-use Excel template brings all your Key Performance Indicators (KPIs) together in one interactive scorecard, helping you visualize energy consumption, water usage, waste recycling rates, carbon emissions, and more — all within a few clicks!
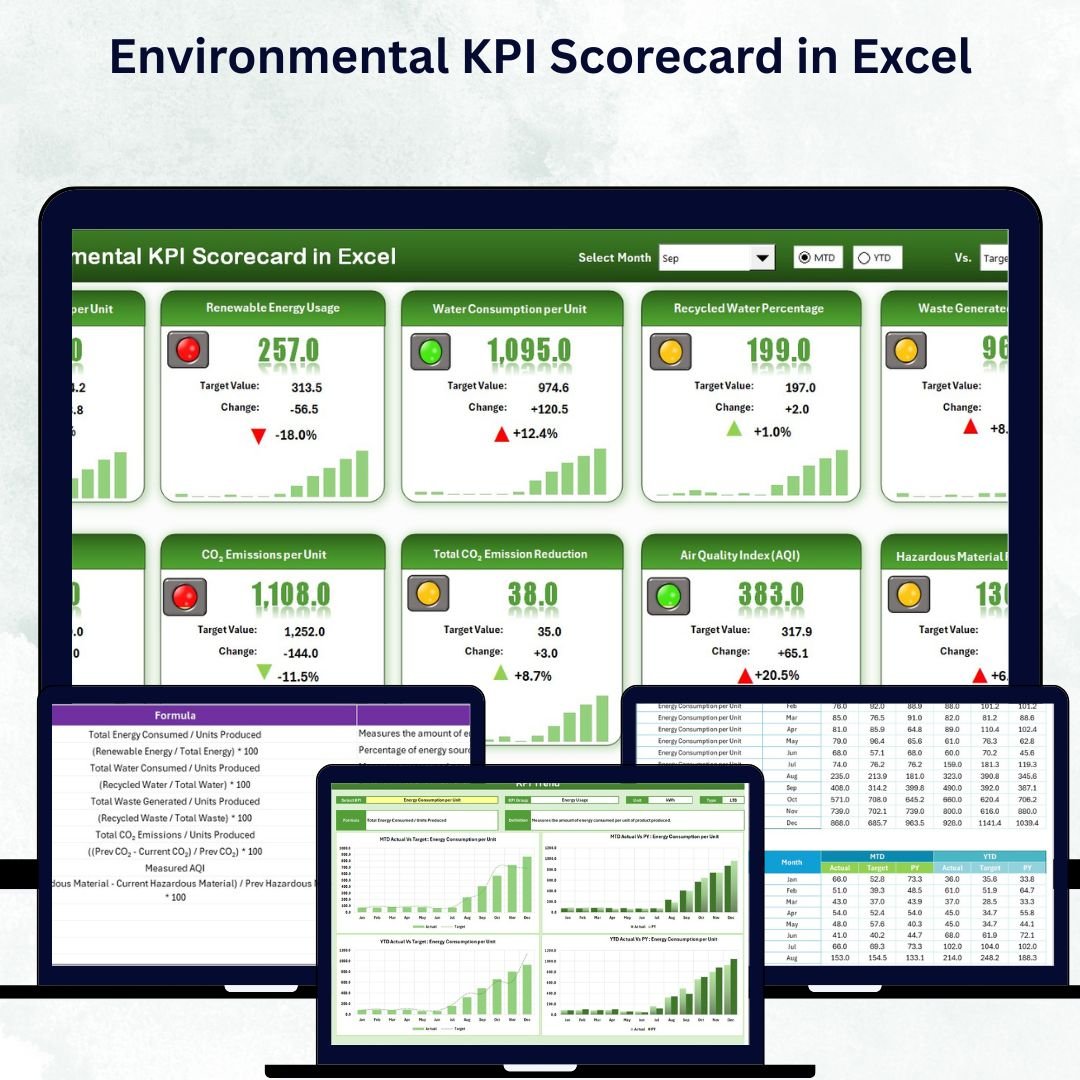
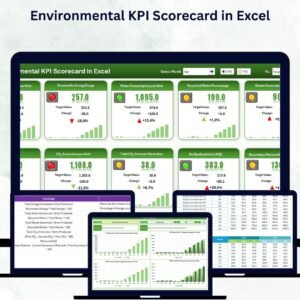
🌱 Key Features of Environmental KPI Scorecard in Excel
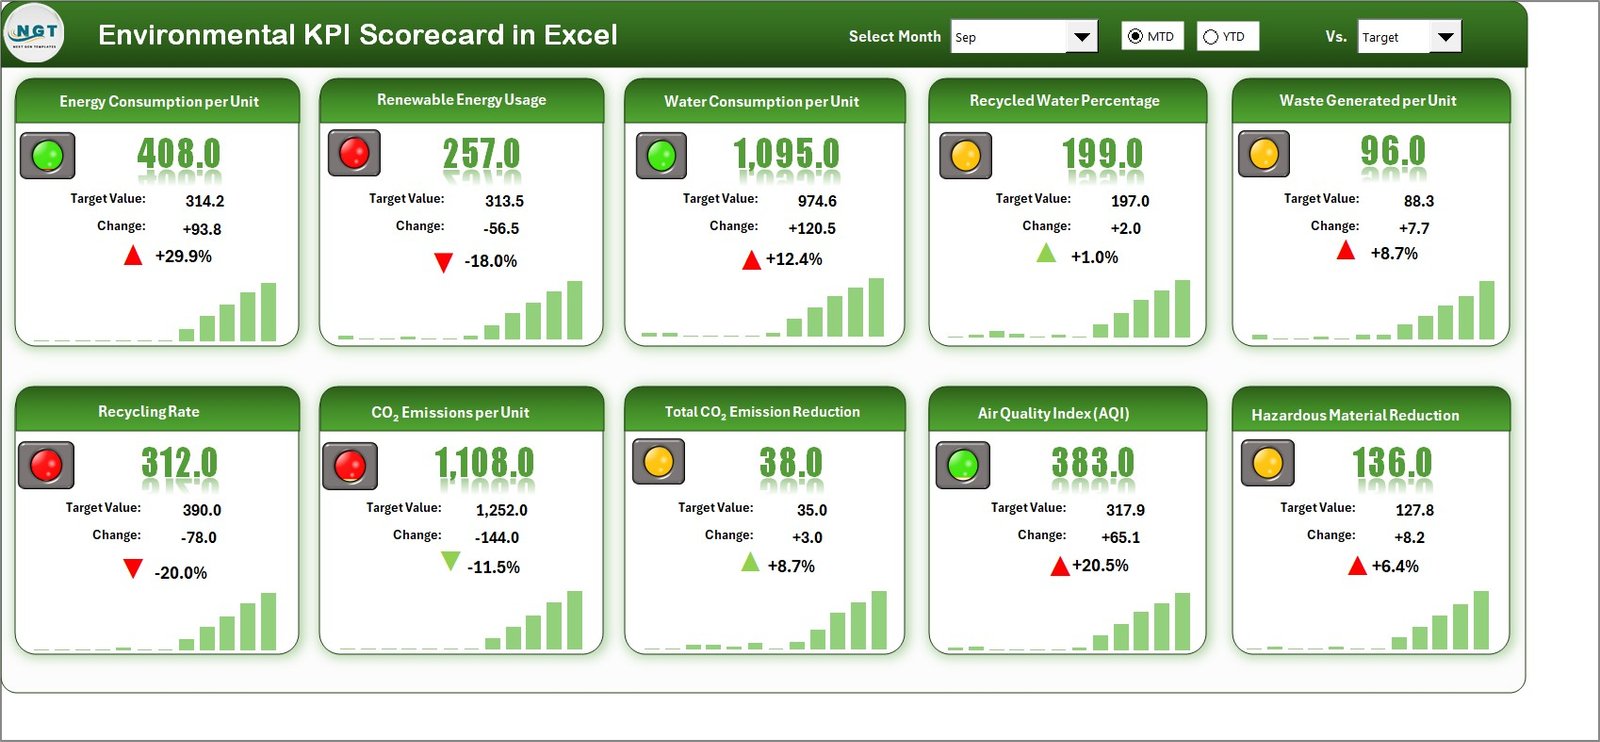
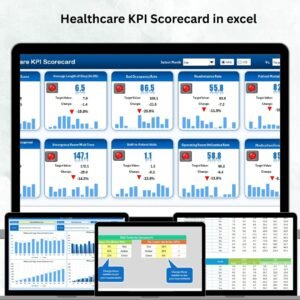
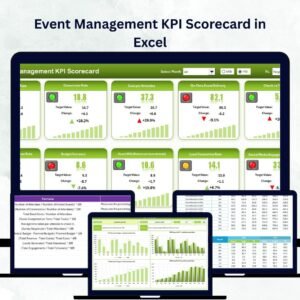
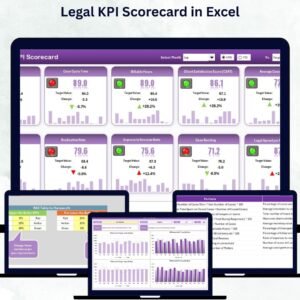
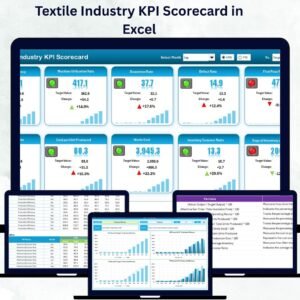
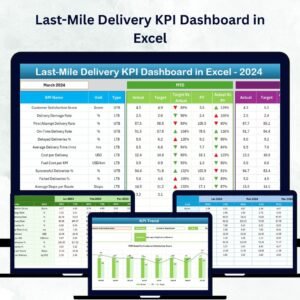
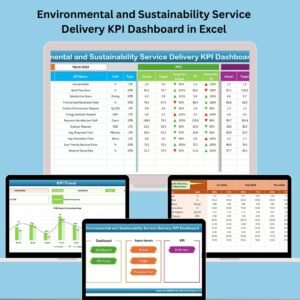
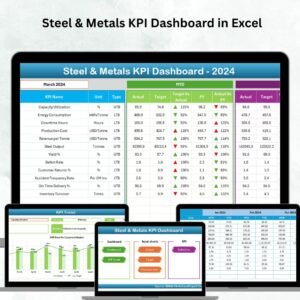
✅ Interactive Scorecard Dashboard – Instantly view all KPIs in one visual sheet with dropdown filters for Month, MTD (Month-to-Date), and YTD (Year-to-Date) performance.
✅ Actual vs Target Comparison – Evaluate how well your organization is performing against defined environmental goals.
✅ Color-Coded Indicators – Get quick insights with green for achieved targets and red for areas that need improvement 🔴🟢.
✅ Automated Data Updates – Simply enter new monthly values and the entire dashboard refreshes automatically.
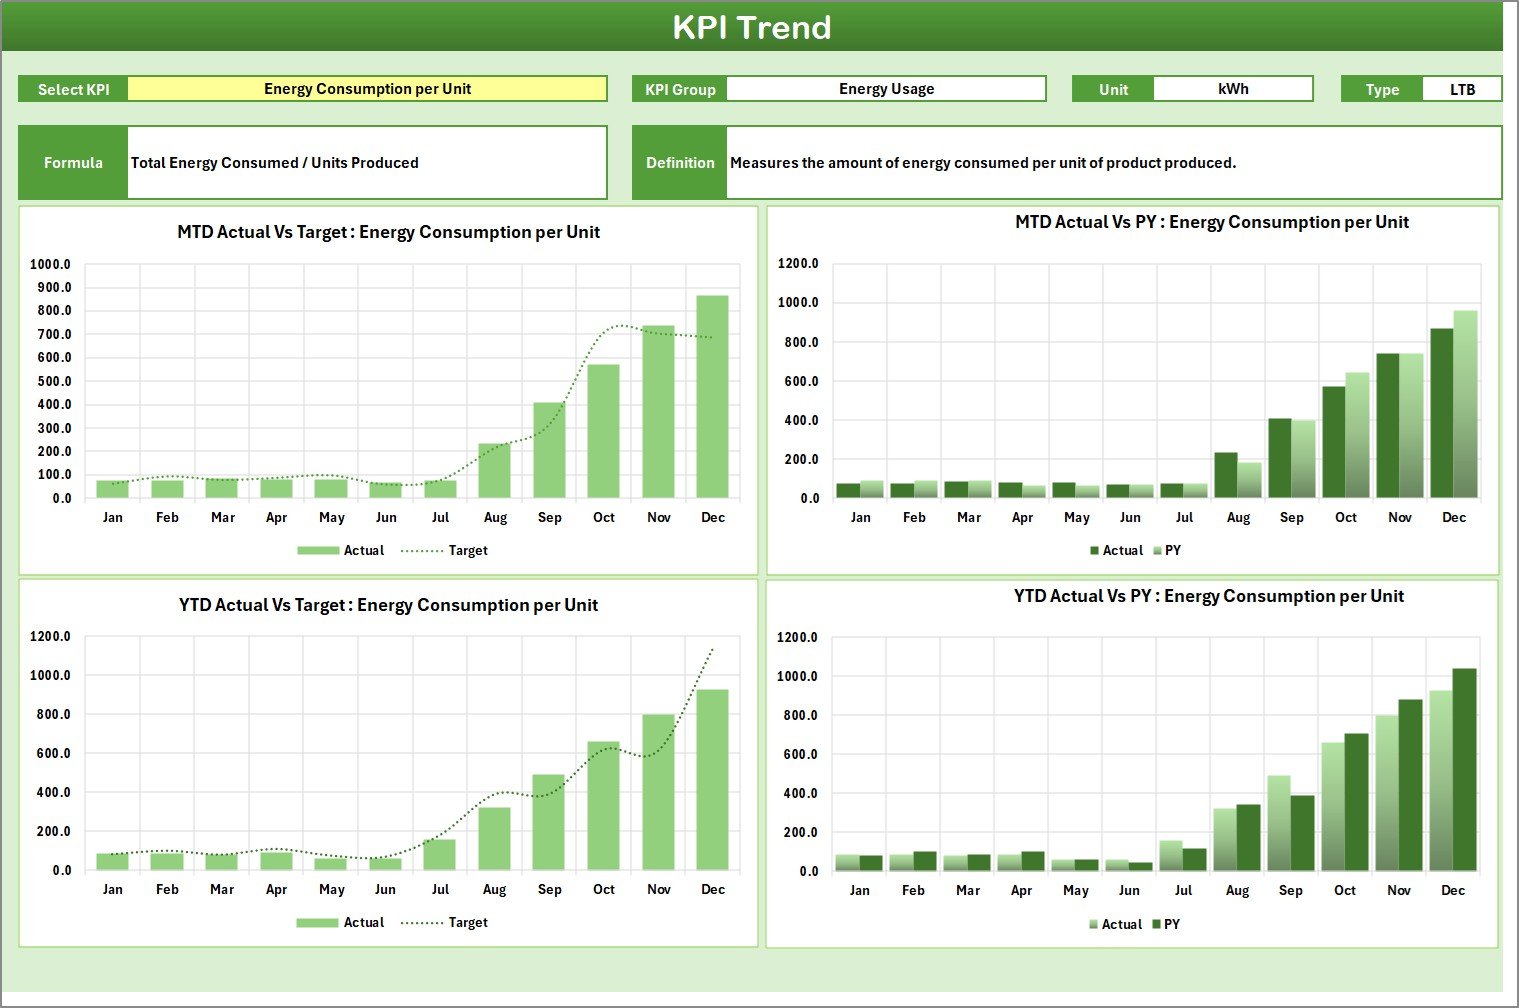
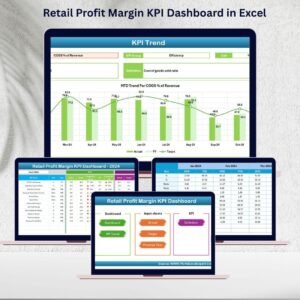
✅ Trend Analysis – View KPI performance over time with dynamic charts comparing Actual, Target, and Previous Year data 📈.
✅ Scalable and Customizable – Add, edit, or modify KPIs easily as your sustainability goals evolve.
✅ No Special Software Needed – 100% Excel-based; works seamlessly without requiring Power BI or coding knowledge.
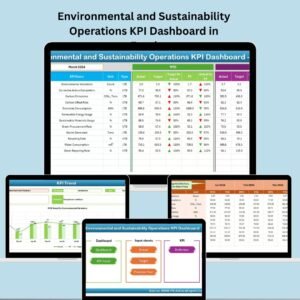
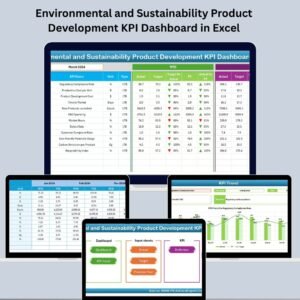
📊 What’s Inside the Environmental KPI Scorecard in Excel
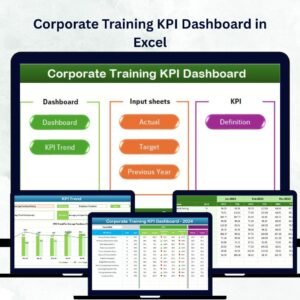
The template includes 4 professionally designed worksheets, each built for clarity and functionality:
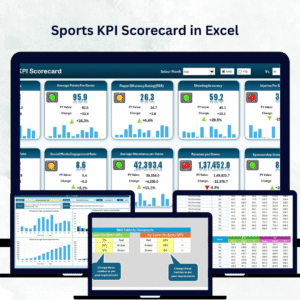
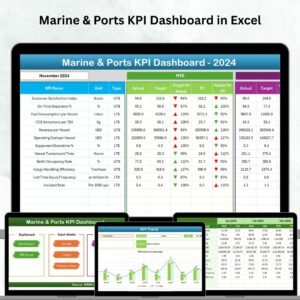
1️⃣ Scorecard Sheet – The main dashboard displaying 10 KPIs at a glance, with dropdown options for time periods and KPI categories.
2️⃣ KPI Trend Sheet – Select any KPI to explore detailed performance trends with charts, definitions, and type (UTB/LTB).
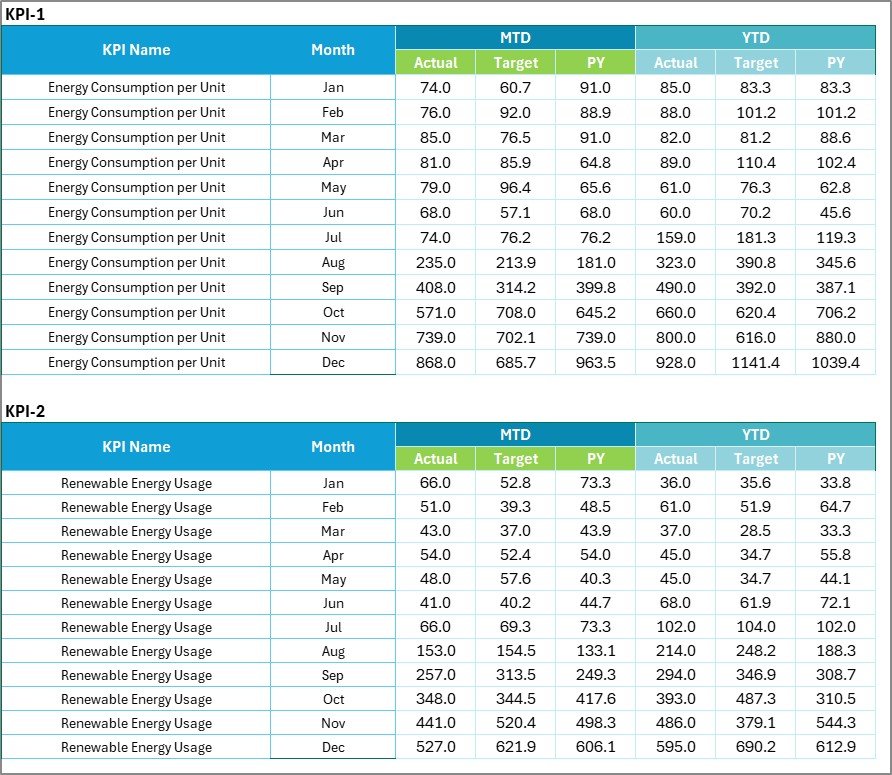
3️⃣ Input Data Sheet – Enter Actual, Target, and Previous Year data monthly. The visuals auto-refresh to keep your analysis current.
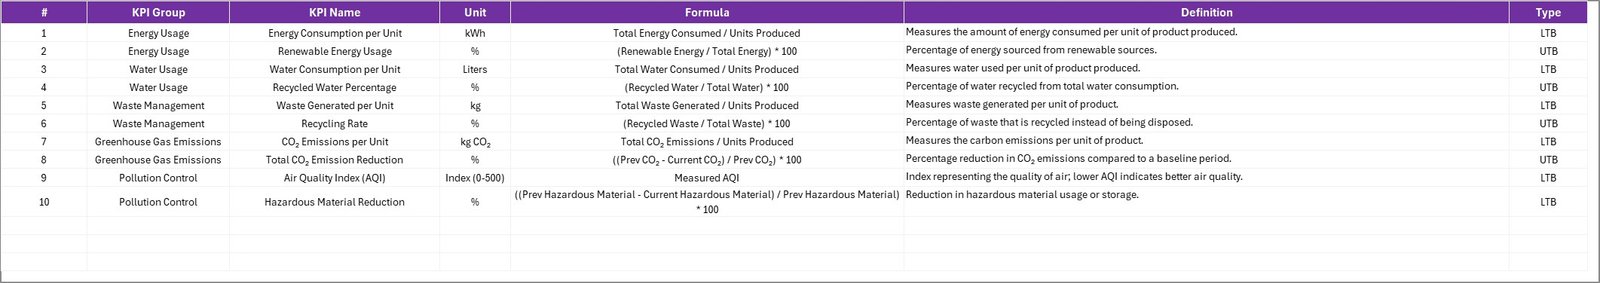
4️⃣ KPI Definition Sheet – Define each KPI with its group, unit, formula, and meaning — ensuring full transparency across your team.
Every component is intuitively structured so even non-technical users can operate it effortlessly.
🧩 How to Use the Environmental KPI Scorecard in Excel
Using this template is simple — just follow these steps:
1️⃣ Download and open the Excel file.
2️⃣ Define KPIs in the KPI Definition tab (with formulas, units, and descriptions).
3️⃣ Enter data for each month in the Input Data tab.
4️⃣ Choose a month from the dropdown in the Scorecard sheet.
5️⃣ Analyze trends using MTD and YTD comparisons.
6️⃣ Take action on underperforming KPIs to strengthen your sustainability strategy 🌍.
That’s it! You’ll have a professional environmental scorecard ready to present to management or auditors in minutes.
🌿 Who Can Benefit from This Environmental KPI Scorecard in Excel
This scorecard is designed for organizations of all sizes and industries aiming to measure and improve sustainability performance.
🌾 Manufacturing Firms: Track waste generation, water usage, and energy efficiency.
🏨 Hospitality Industry: Measure energy consumption per guest and carbon footprint per stay.
🏬 Retail Chains: Analyze packaging waste and renewable energy utilization.
🎓 Educational Institutions: Track campus recycling and resource usage.
🏢 Corporate Offices: Monitor paper usage, electricity consumption, and compliance metrics.
Whether you’re preparing ESG reports or just starting your green journey, this scorecard provides the insights you need to drive positive environmental change 🌎.
💡 Why You’ll Love This Template
✔️ Save hours of manual work with automated charts and dashboards.
✔️ Make data-driven sustainability decisions.
✔️ Track performance with visually stunning graphics.
✔️ Stay compliant with environmental regulations.
✔️ Strengthen your organization’s commitment to eco-friendly practices.


Reviews
There are no reviews yet.