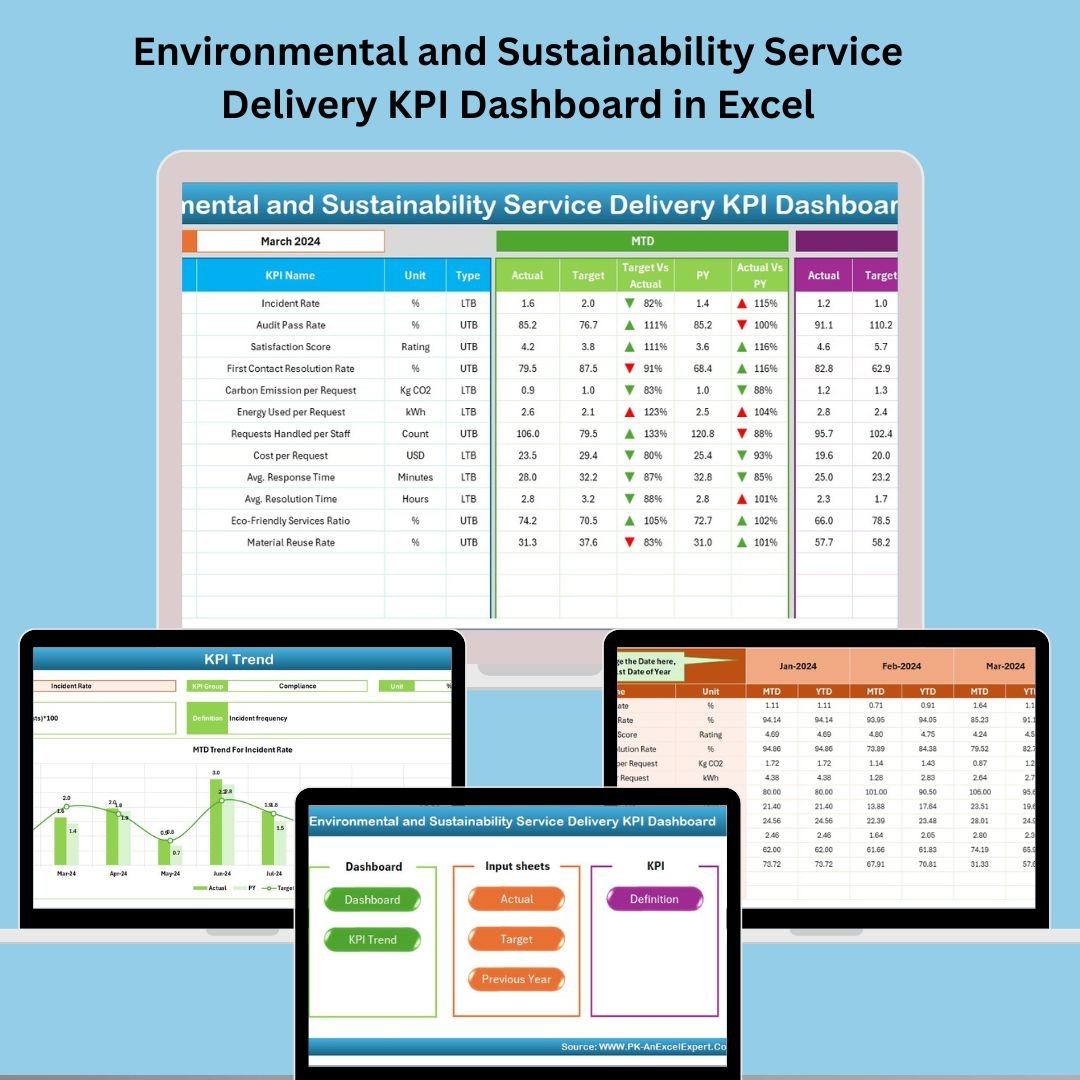
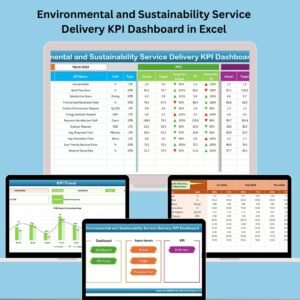
Are you looking for a smart, Excel-based solution to monitor your organization’s eco-efficiency and sustainability goals? Introducing the Environmental and Sustainability Service Delivery KPI Dashboard in Excel — a powerful, ready-to-use template that helps you track, analyze, and enhance your environmental service performance with precision and clarity.
Designed for teams committed to making measurable environmental progress, this dashboard puts data-driven decision-making right at your fingertips. Whether you’re managing carbon emissions, water usage, waste recycling, or other sustainability metrics, this dashboard has you covered with intuitive navigation and insightful analytics.
🌟 Key Features of Environmental and Sustainability Service Delivery KPI Dashboard
🔹 7 Fully Integrated Sheets
Each worksheet is crafted for specific functionality, keeping your data streamlined and insights actionable:
-
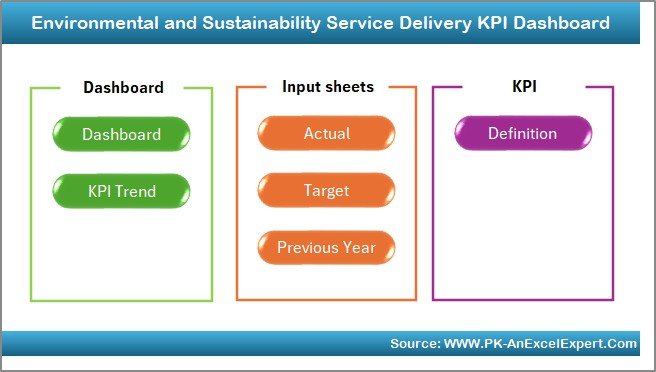
Home Sheet: Quick-access dashboard navigation with 6 clickable buttons
-
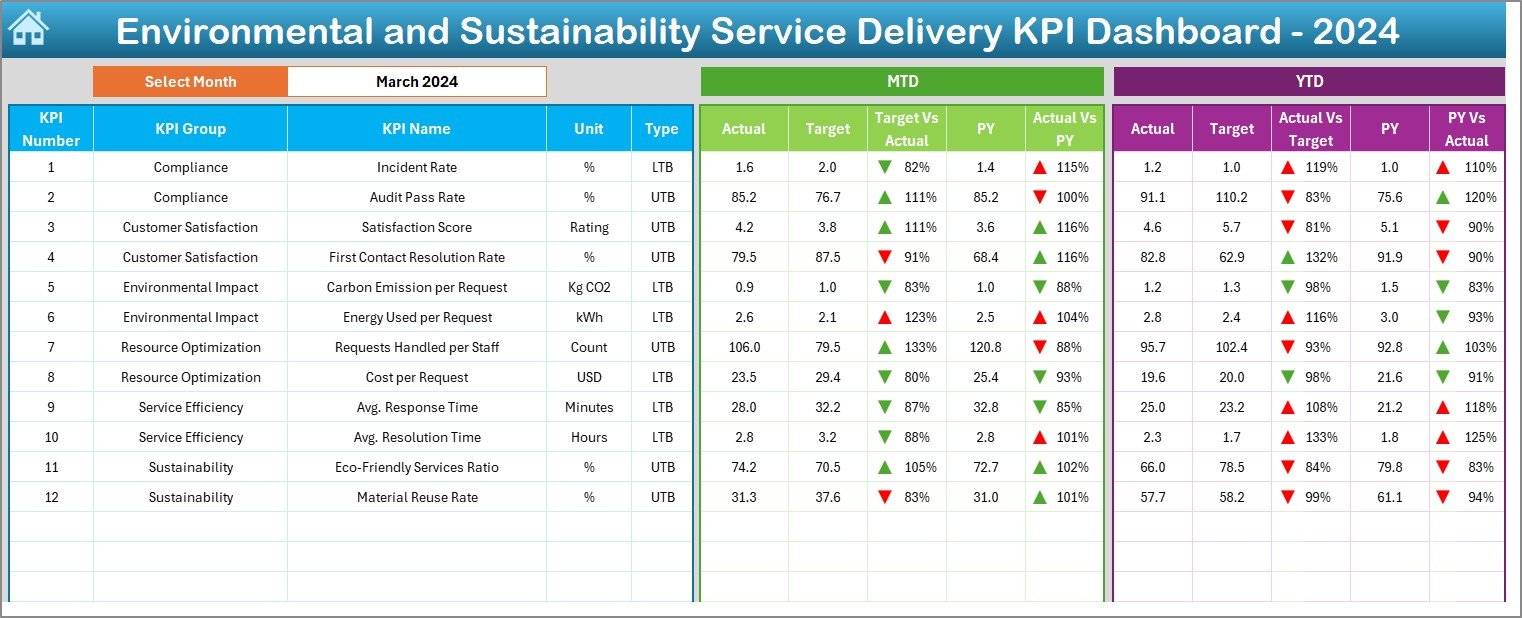
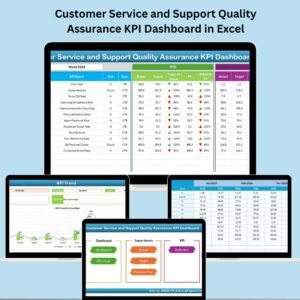
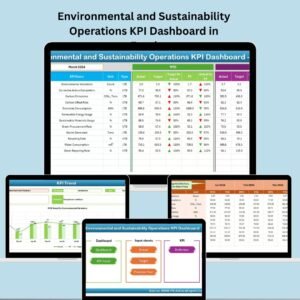
Dashboard Sheet: Select a month and get MTD and YTD KPIs with arrows and comparisons
-
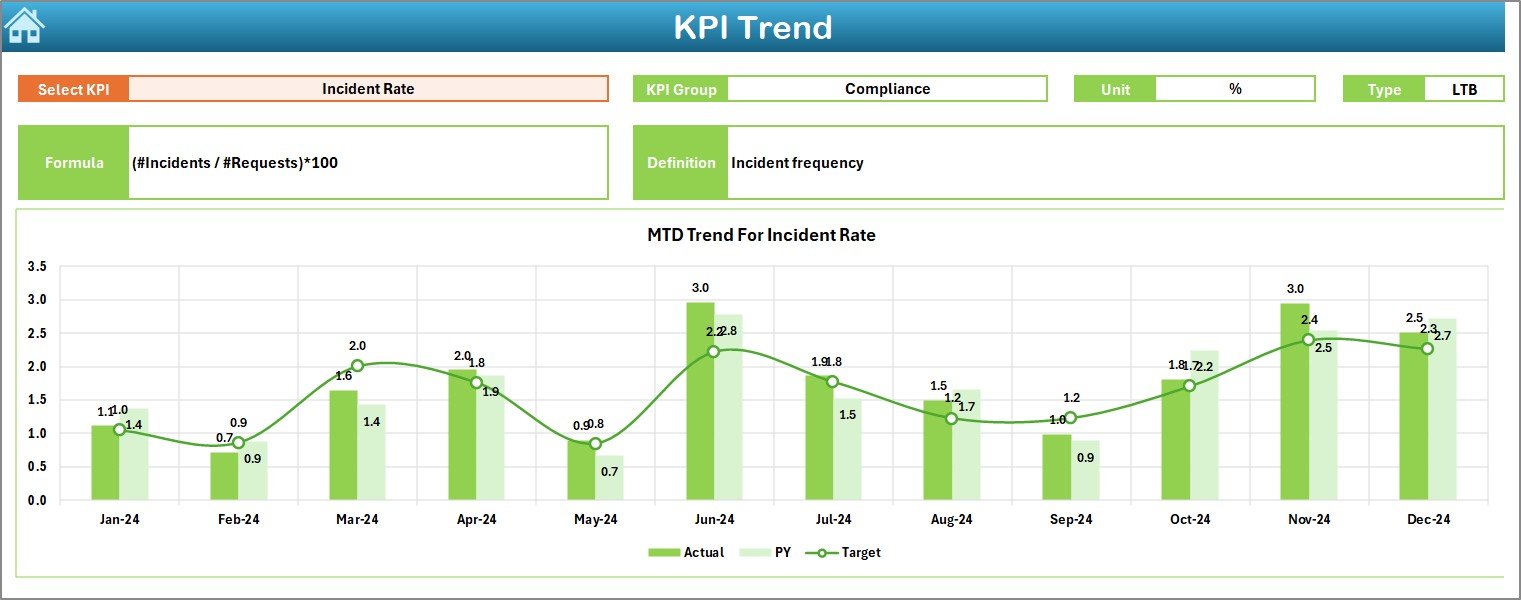
KPI Trend Sheet: Visualize MTD and YTD trends for any KPI
-
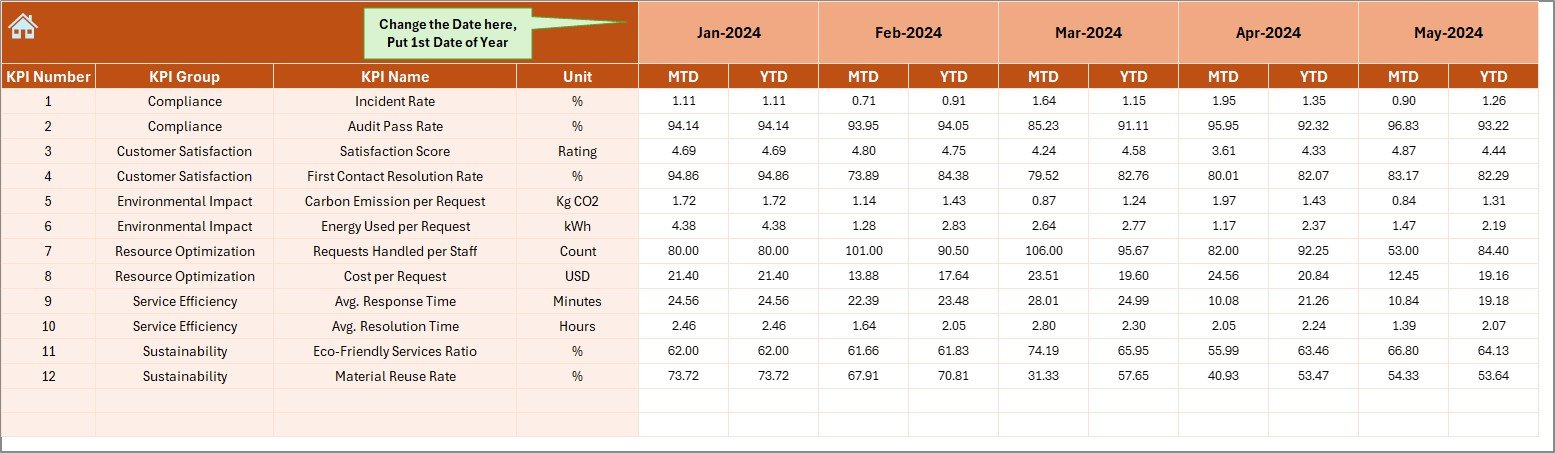
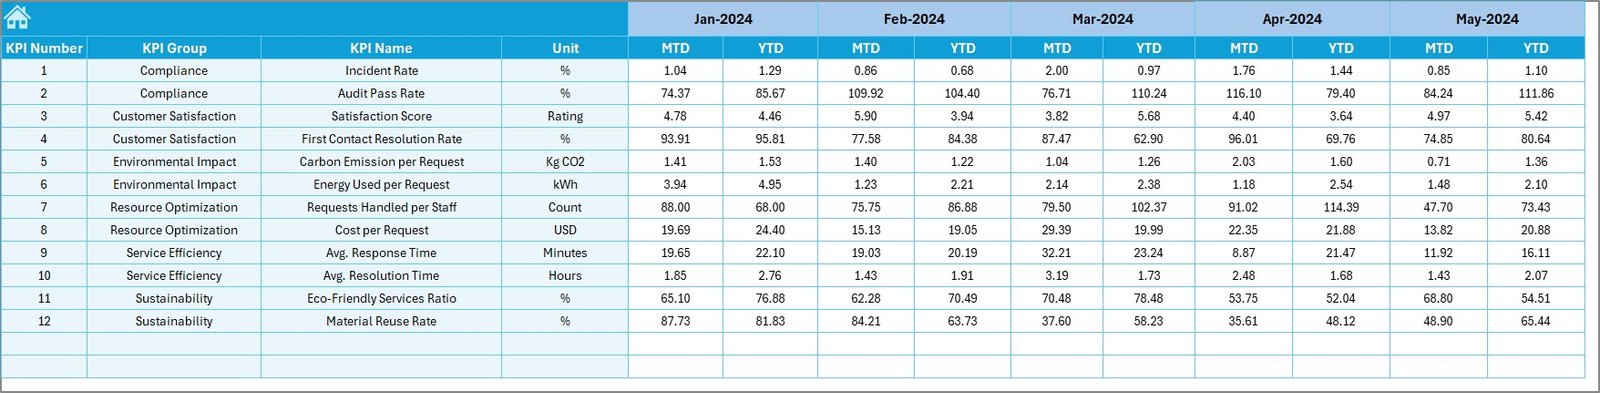
Actual Input Sheet: Input monthly KPI values quickly and cleanly
-
Target Sheet: Set monthly MTD/YTD targets for each KPI
-
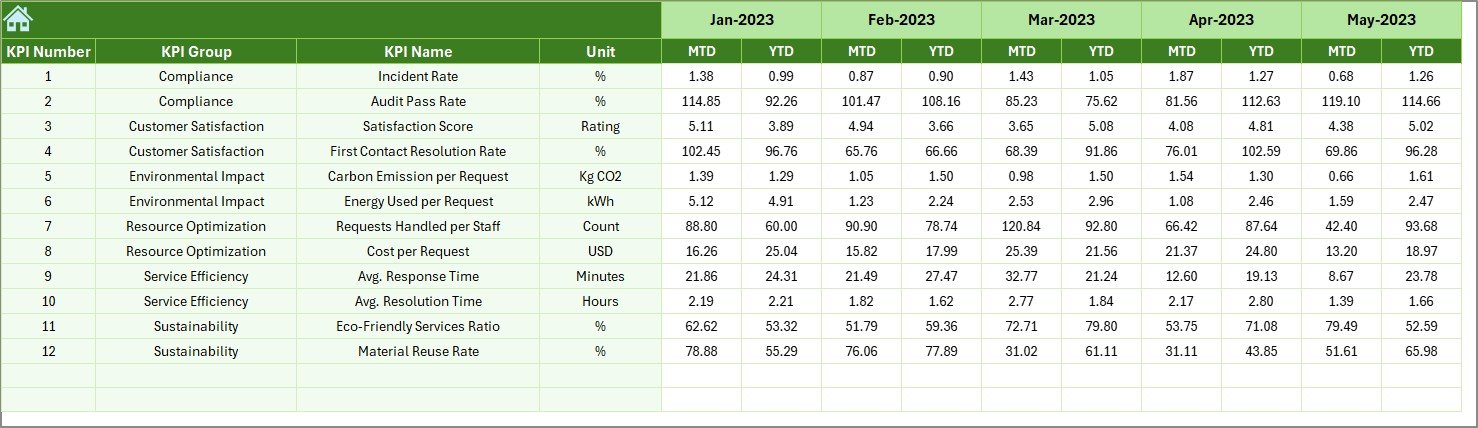
Previous Year Data Sheet: Compare performance with last year’s actuals
-
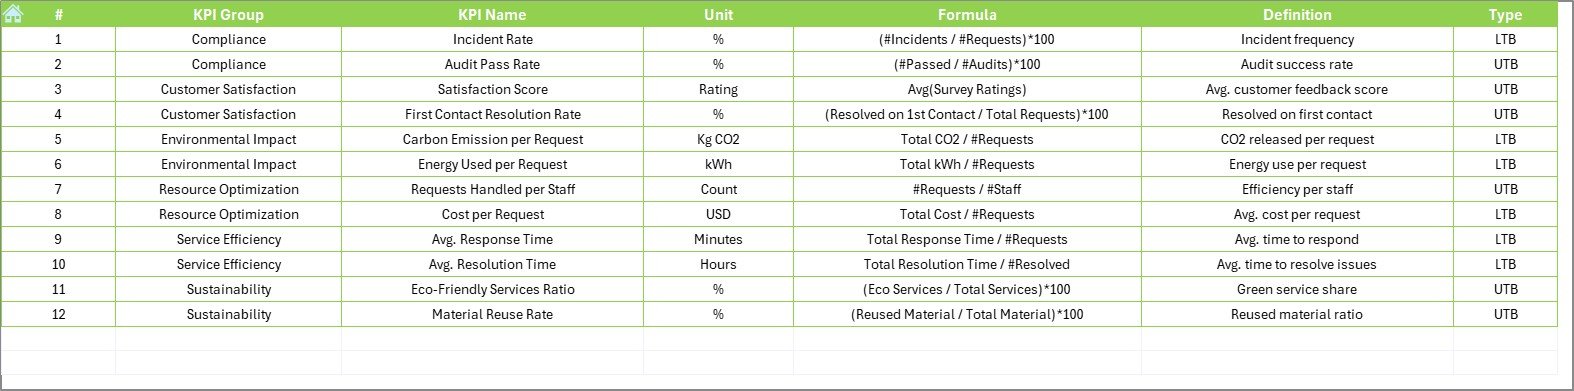
KPI Definition Sheet: Store KPI formula, group, unit, and description for reference
📦 What’s Inside the Product
-
💼 Pre-formatted Dashboard with dropdown selectors and auto-calculated fields
-
📈 Dynamic Trend Charts for visual performance review
-
🧾 KPI Data Table with month-wise actuals, targets, and PY numbers
-
🧠 KPI Definitions for full clarity and accountability
-
🧮 Built-in Conditional Formatting to highlight performance shifts
-
📁 Structured Layout for easy updates and maintenance
Every element is carefully designed to simplify sustainability reporting—no complex software or coding required!
🛠️ How to Use the Product
-
Start at the Home Sheet: Click on any section button to jump to the relevant worksheet
-
Enter KPI Definitions: Use the KPI Definition sheet to define your key metrics
-
Set Your Targets: Input monthly and YTD targets in the Target sheet
-
Log Actual Values: Enter real performance data in the Actual Numbers Input sheet
-
Review Trends: Use the KPI Trend tab for graphical performance comparisons
-
Get Insights: Instantly assess gaps vs. Target or Previous Year in the Dashboard tab
-
Share and Present: Export or share the visuals with teams or auditors
👥 Who Can Benefit from This Product
This dashboard is ideal for:
-
🌿 Environmental Managers: Looking to track KPIs in waste, water, energy, and emissions
-
🏛️ Public Sector Teams: Needing clean dashboards for ESG and compliance
-
🏢 Corporate Sustainability Units: Monitoring KPIs across departments
-
🧪 Facilities & Maintenance Staff: Managing preventive maintenance and eco-projects
-
📈 Analysts: Who want an Excel-native tool to analyze service delivery metrics
-
🚀 Startups & SMBs: With limited budgets but big sustainability ambitions
Whether you’re part of a green-tech firm, a government agency, or a corporate ESG team, this tool fits right into your performance strategy.
🔗 Click here to read the Detailed blog post
🎥 Visit our YouTube channel to learn step-by-step video tutorials


Reviews
There are no reviews yet.