The Energy Efficiency KPI Dashboard in Excel is a comprehensive tool designed to help businesses, energy managers, and sustainability professionals monitor and improve energy performance. This Excel-based dashboard allows you to track key energy-related metrics such as energy consumption, energy cost savings, and overall efficiency, providing valuable insights to drive cost reduction and sustainability goals.
By visualizing energy data and trends, this dashboard helps you identify inefficiencies, make informed decisions, and optimize energy usage across various departments or systems. Whether you’re aiming to reduce carbon emissions or improve energy efficiency in operations, this tool is essential for achieving measurable results and ensuring sustainability in your organization.
Key Features of the Energy Efficiency KPI Dashboard in Excel
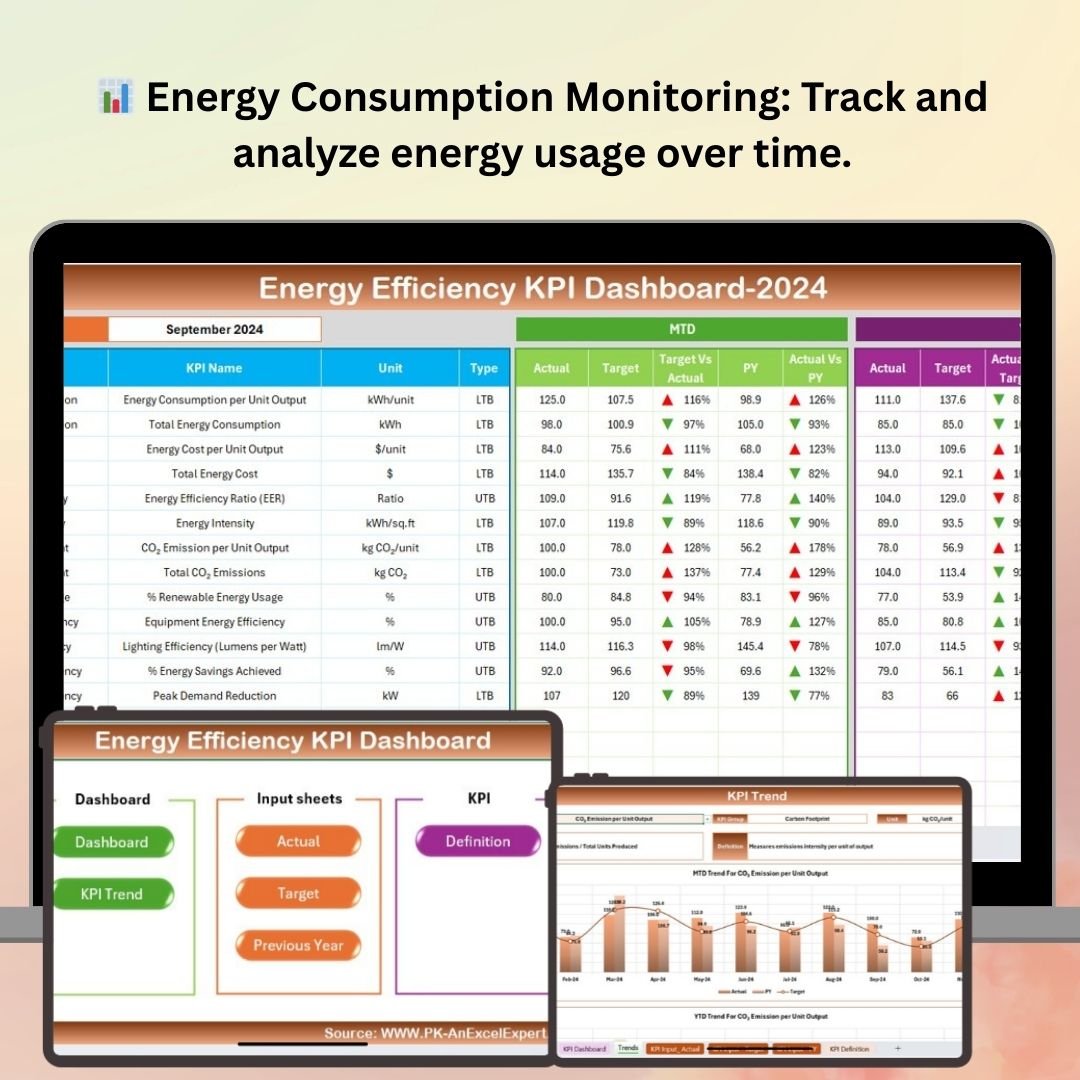
📊 Energy Consumption Monitoring
Track and analyze energy usage over time. Monitor energy consumption across various departments or operations to identify patterns, peak usage times, and areas of inefficiency.
💸 Cost Savings Tracking
Keep track of energy cost savings by comparing current consumption with historical data or target values. This feature allows you to calculate the financial benefits of energy efficiency initiatives.
📈 Energy Efficiency Metrics
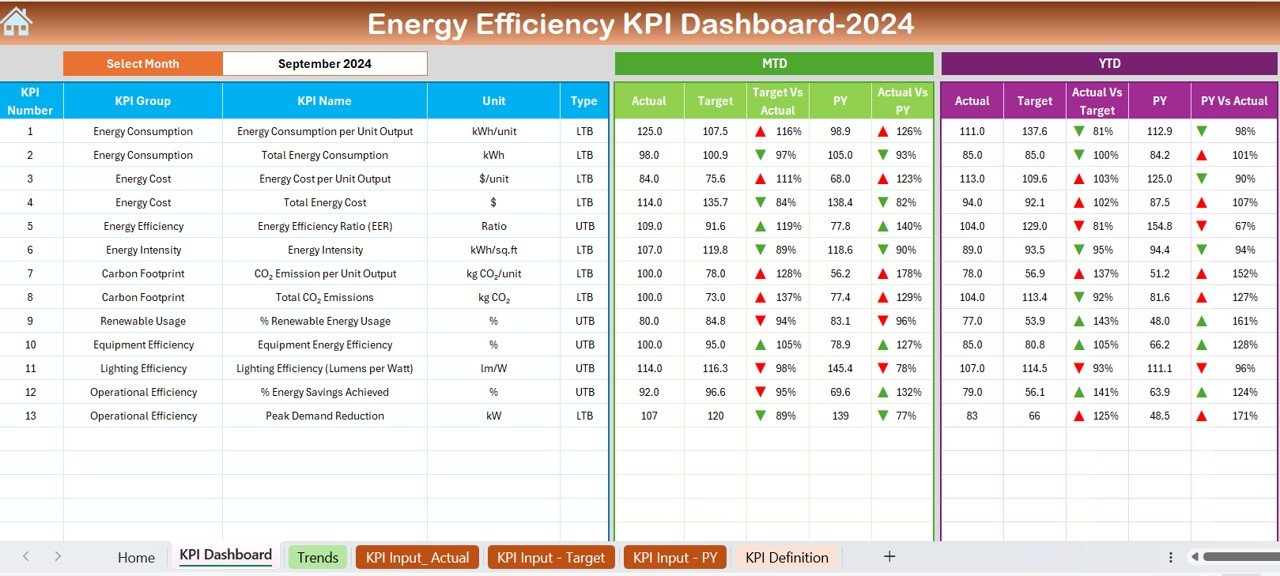
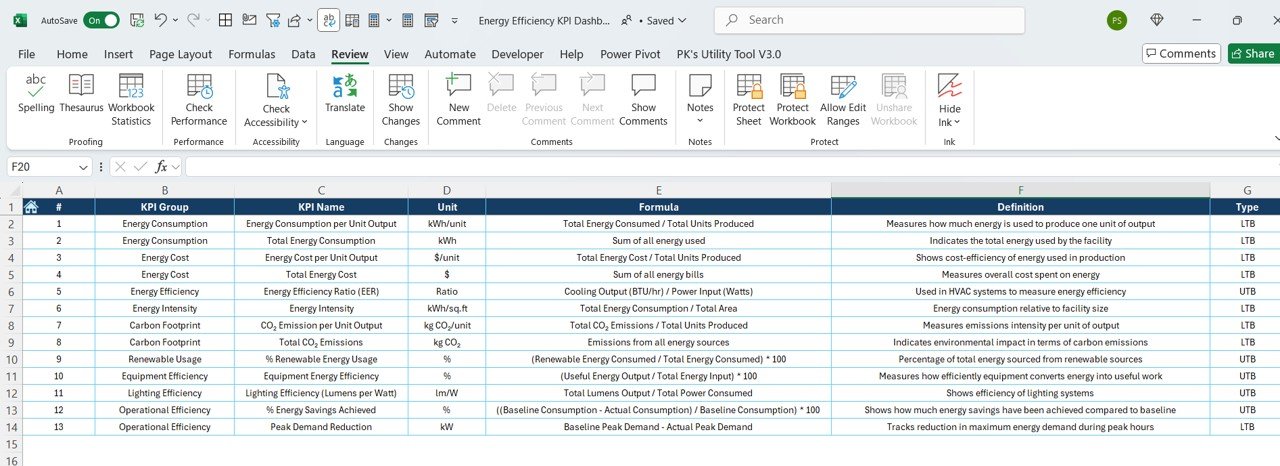
Monitor important efficiency indicators such as energy intensity, energy per unit produced, and energy cost per unit of output. Assess how efficiently your business or facility uses energy in relation to production or operational outputs.
🌱 Carbon Emissions Tracking
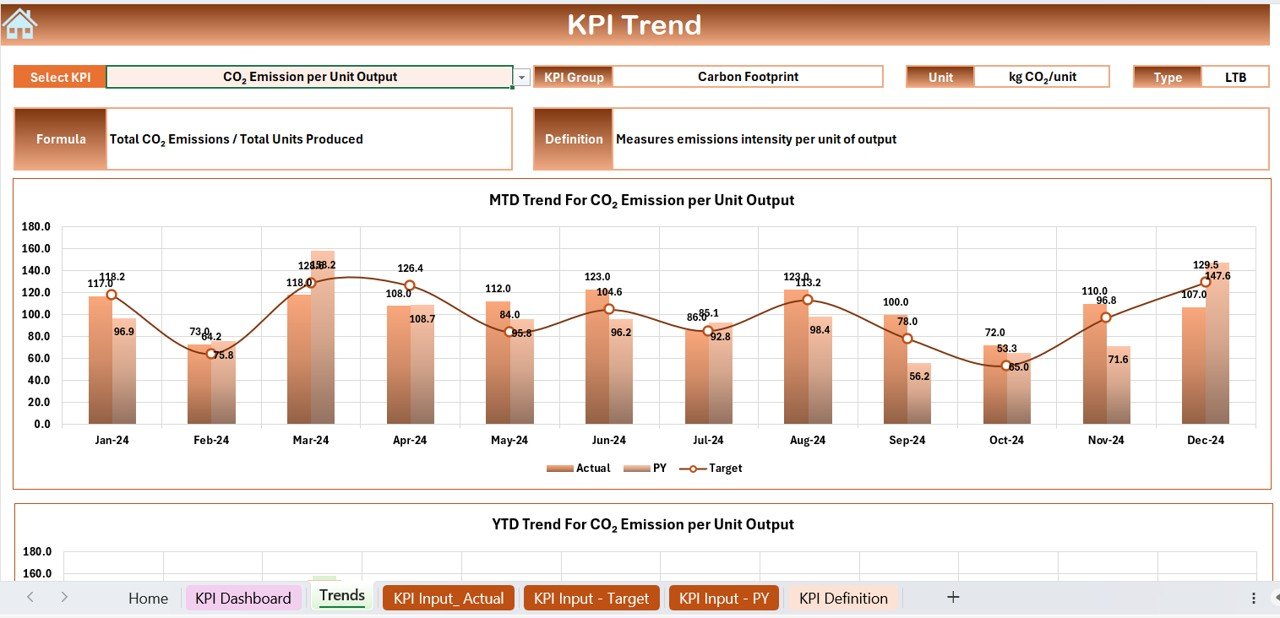
Measure the impact of energy usage on your carbon footprint. Track reductions in carbon emissions over time and compare results against sustainability goals.
🔄 Customizable & Scalable Dashboard
Tailor the dashboard to suit the specific energy-related KPIs of your business. Customize the dashboard to include metrics that are relevant to your energy management goals and scale it to track data across multiple departments or locations.
⚙️ Data Visualization & Insights
Visualize key energy metrics with dynamic charts and graphs. Use these visual tools to analyze trends, identify anomalies, and make data-driven decisions to improve energy efficiency.
Why You’ll Love the Energy Efficiency KPI Dashboard in Excel
✅ Comprehensive Energy Tracking
Track and analyze all aspects of energy consumption and efficiency in one centralized location, providing you with a clear view of your energy performance.
✅ Make Informed Decisions
Use the insights from the dashboard to make data-driven decisions aimed at reducing energy consumption, cutting costs, and improving operational efficiency.
✅ Achieve Sustainability Goals
Track your progress in reducing energy usage and carbon emissions. Use the dashboard to ensure that your energy initiatives align with sustainability and environmental goals.
✅ Save Money on Energy Costs
By monitoring energy consumption and identifying inefficiencies, you can implement changes that reduce energy costs, leading to significant savings over time.
✅ Fully Customizable for Your Business
The dashboard is highly customizable to fit your unique energy management needs. Whether you are tracking a single facility or multiple locations, you can adapt the template to suit your business.
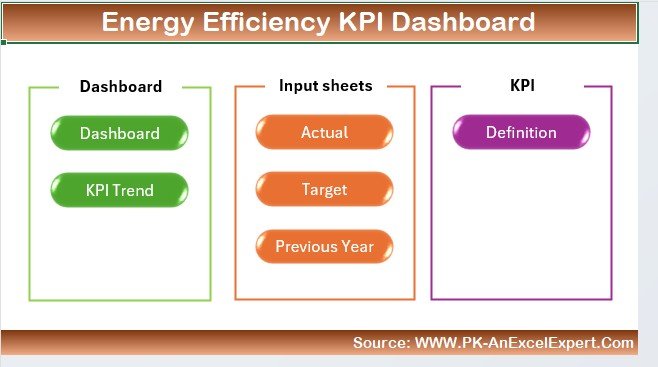
What’s Inside the Energy Efficiency KPI Dashboard in Excel?
-
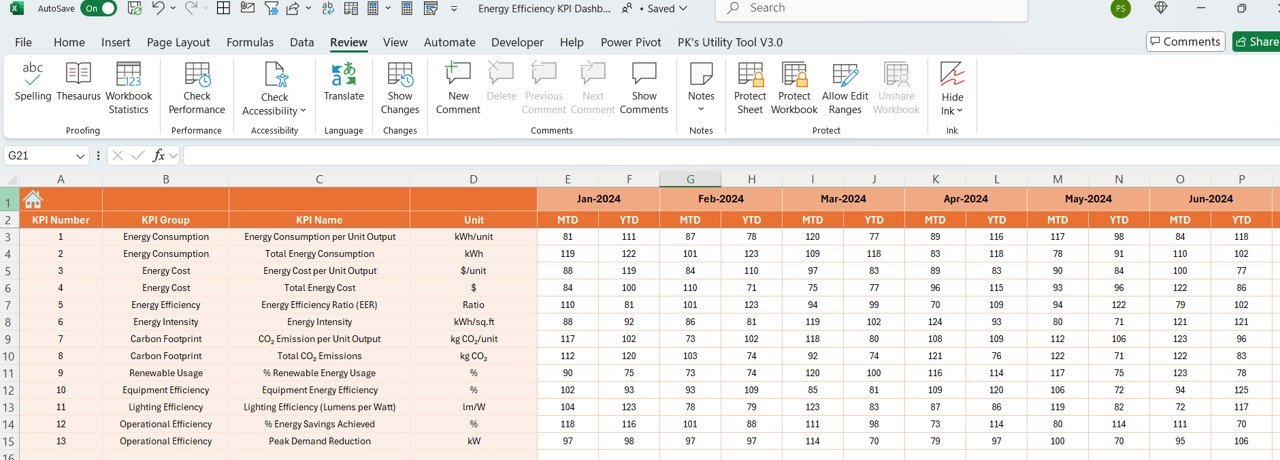
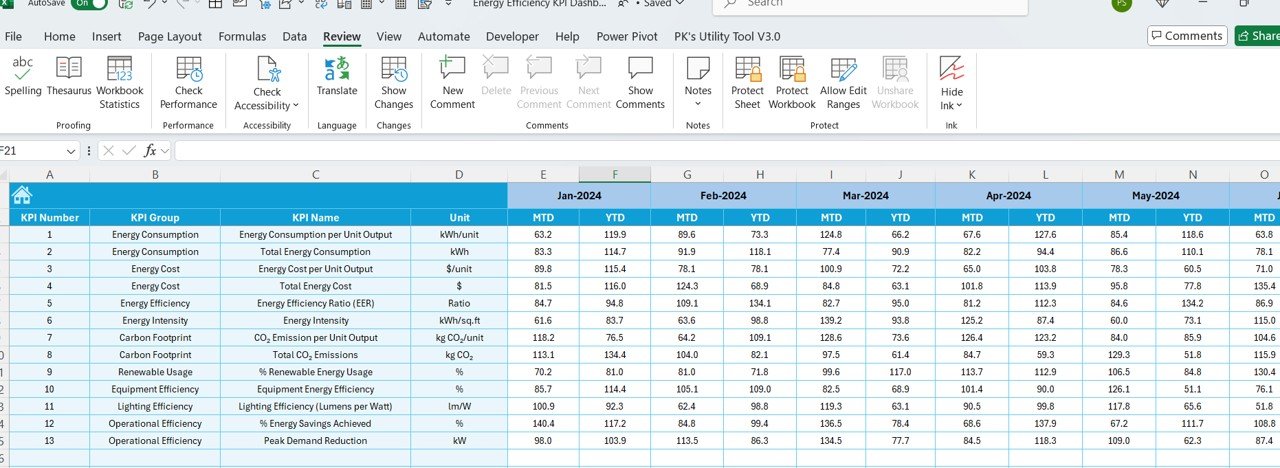
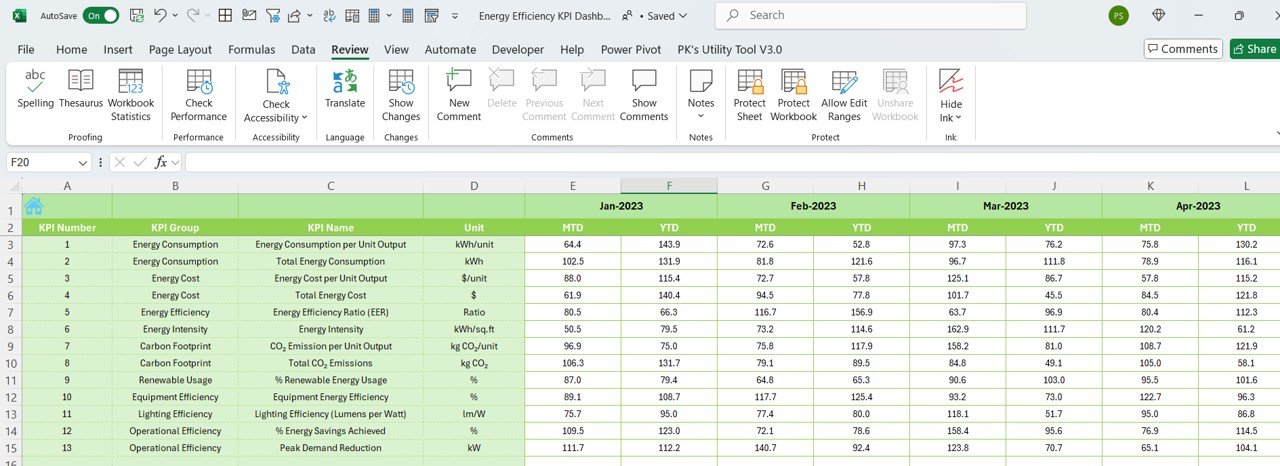
Energy Consumption Monitoring: Track energy use across different time periods.
-
Cost Savings Tracking: Monitor cost savings based on energy consumption reductions.
-
Energy Efficiency Metrics: Analyze energy efficiency indicators and identify improvement opportunities.
-
Carbon Emissions Tracking: Measure and track reductions in carbon footprint.
-
Customizable Dashboard: Tailor the dashboard to your specific energy-related KPIs.
-
Data Visualization: Use dynamic charts to visualize energy data and trends.
How to Use the Energy Efficiency KPI Dashboard in Excel
1️⃣ Download the Template: Get instant access to the Energy Efficiency KPI Dashboard in Excel.
2️⃣ Input Energy Data: Enter your energy usage and cost data into the dashboard.
3️⃣ Track KPIs & Performance: Monitor energy consumption, cost savings, and other efficiency metrics.
4️⃣ Analyze Trends & Data: Use time-based analysis to identify trends in energy performance.
5️⃣ Optimize Energy Usage: Use the insights to make decisions that reduce energy consumption and improve efficiency.
Who Can Benefit from the Energy Efficiency KPI Dashboard in Excel?
🔹 Sustainability Managers
🔹 Energy Managers & Analysts
🔹 Facility Managers
🔹 Environmental Compliance Teams
🔹 Business Owners & Executives
🔹 Large Enterprises & Corporations
🔹 Small & Medium Businesses (SMBs)
Track, analyze, and improve your energy usage with the Energy Efficiency KPI Dashboard in Excel. Reduce consumption, cut costs, and meet your sustainability goals with ease.
Click here to read the Detailed blog post
Visit our YouTube channel to learn step-by-step video tutorials
Youtube.com/@PKAnExcelExpert















Reviews
There are no reviews yet.