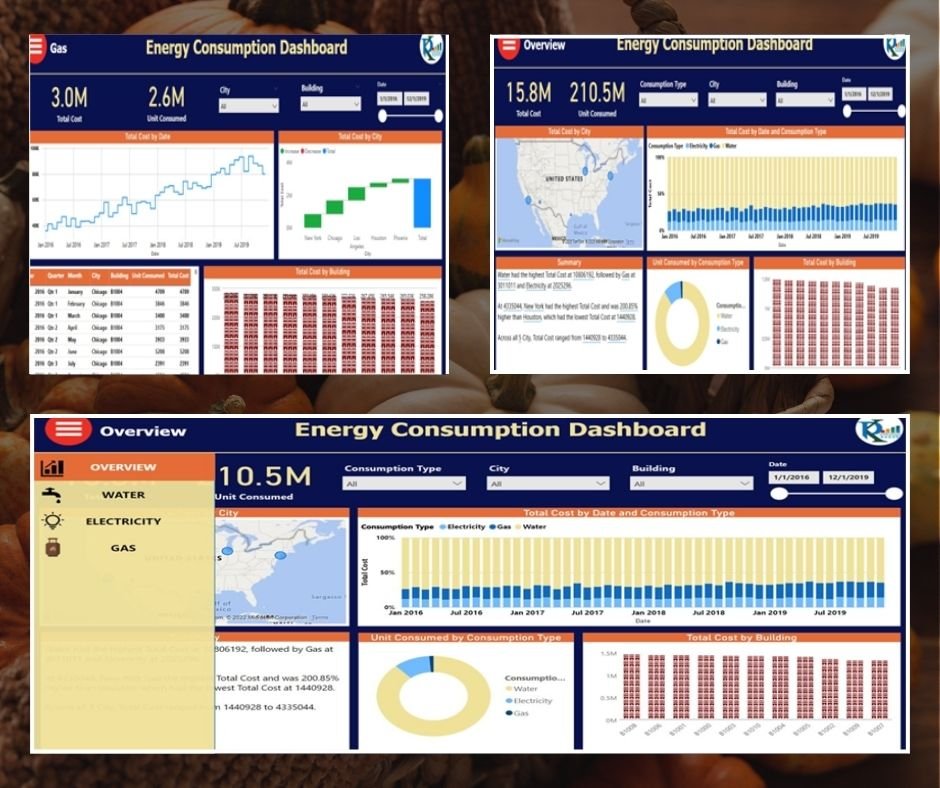
The Energy Consumptions Dashboard in Power BI is an advanced reporting tool designed to track, analyze, and optimize energy consumption across multiple locations and time periods. This dashboard offers a comprehensive visualization of total costs, units consumed, and consumption trends, enabling businesses to make data-driven decisions for energy efficiency.
Key Features: Energy Consumptions Dashboard in Power BI
-
Step-by-Step Data Transformation
- Uses Power Query to clean and transform raw data into structured, meaningful insights.
- Eliminates data inconsistencies and ensures accuracy in reporting.
-
Fact & Dimension Relationships
- Establishes clear relationships between fact and dimension tables for accurate data modeling.
- Enables easy filtering by City, Building, Consumption Type, and Date through slicers.
-
Advanced DAX Measures
- Incorporates DAX (Data Analysis Expressions) to calculate total energy consumption, cost per unit, and monthly/yearly variances.
- Supports custom measures for forecasting future energy trends.
-
Interactive Navigation & Bookmarks
- Features a navigation bar with bookmarks and page navigators, making it easy to switch between Overview, Electricity, Gas, and Water consumption reports.
- Users can drill down into specific energy sources for in-depth insights.
-
Dynamic Filters & Slicers
- Allows users to filter data by consumption type (Electricity, Gas, Water), city, building, and time range.
- Helps in identifying energy usage patterns across different locations.
-
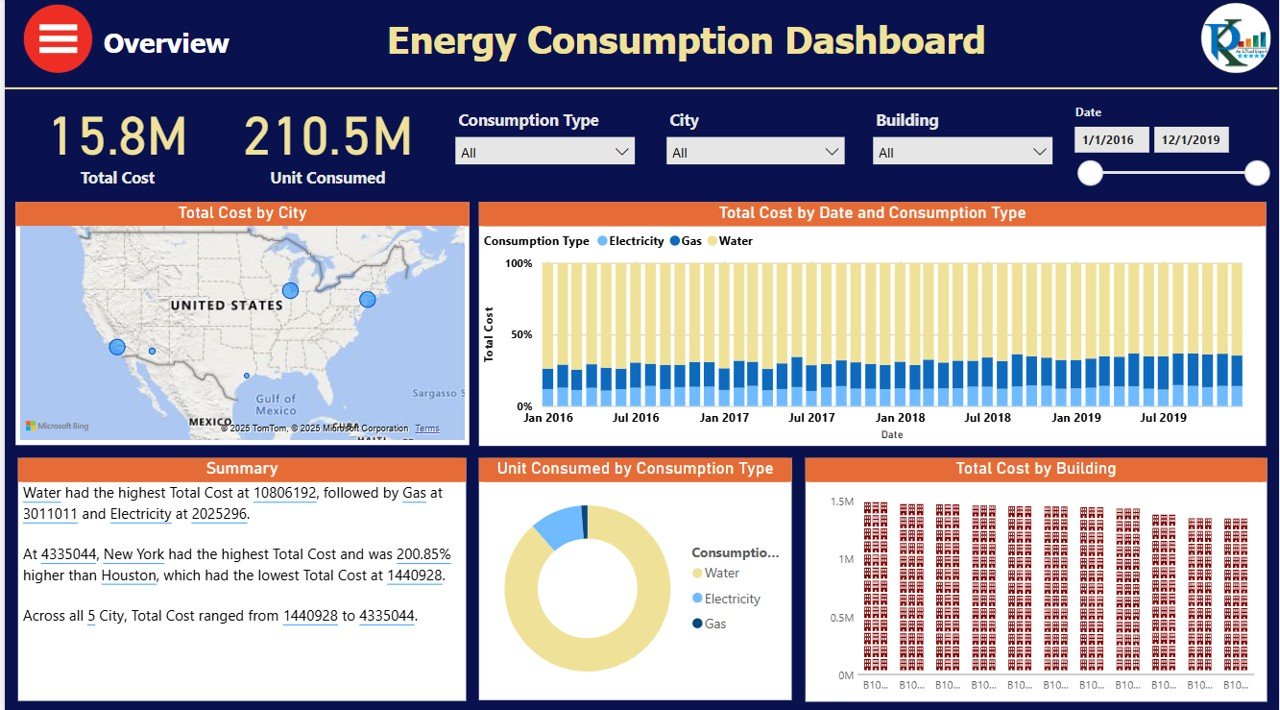
Comprehensive Visualizations
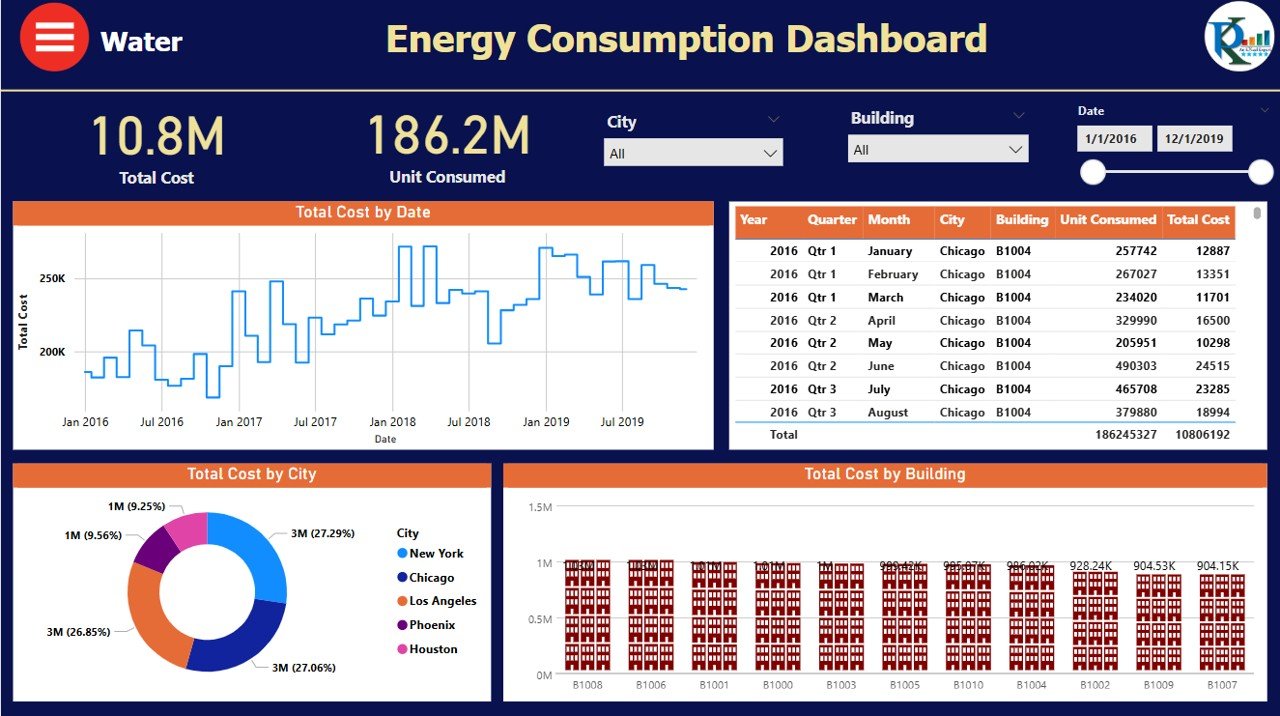
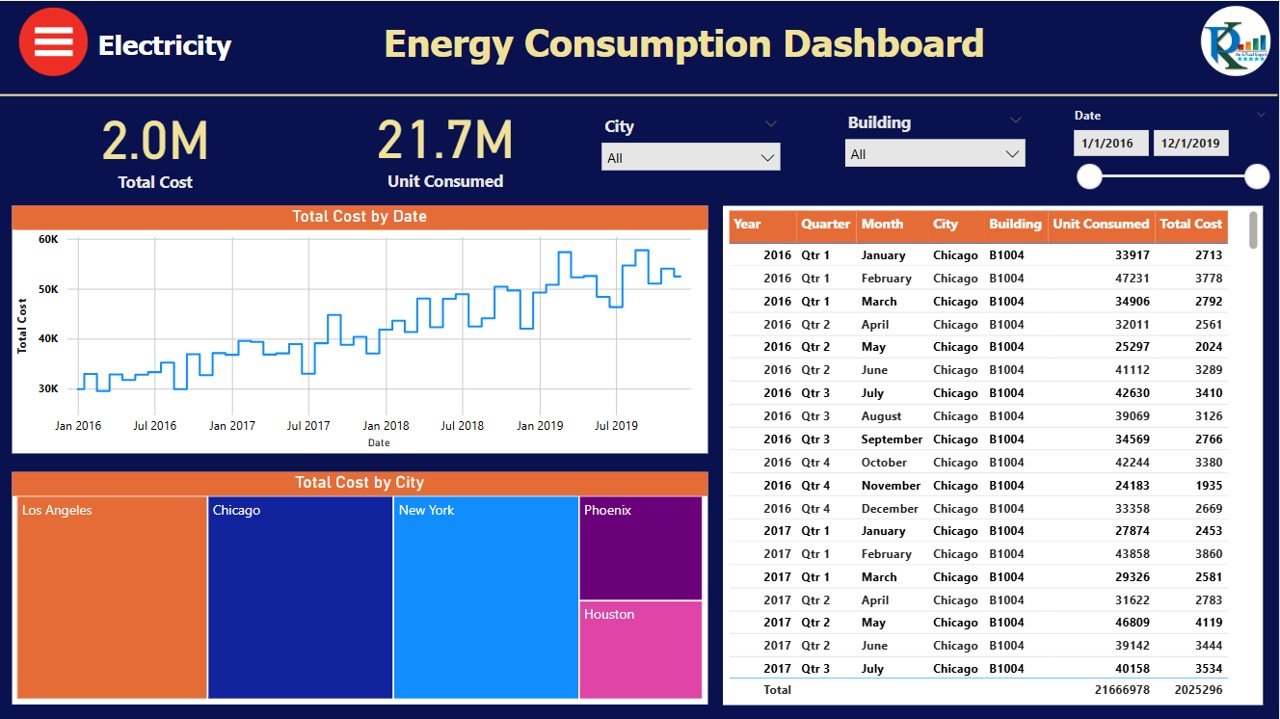
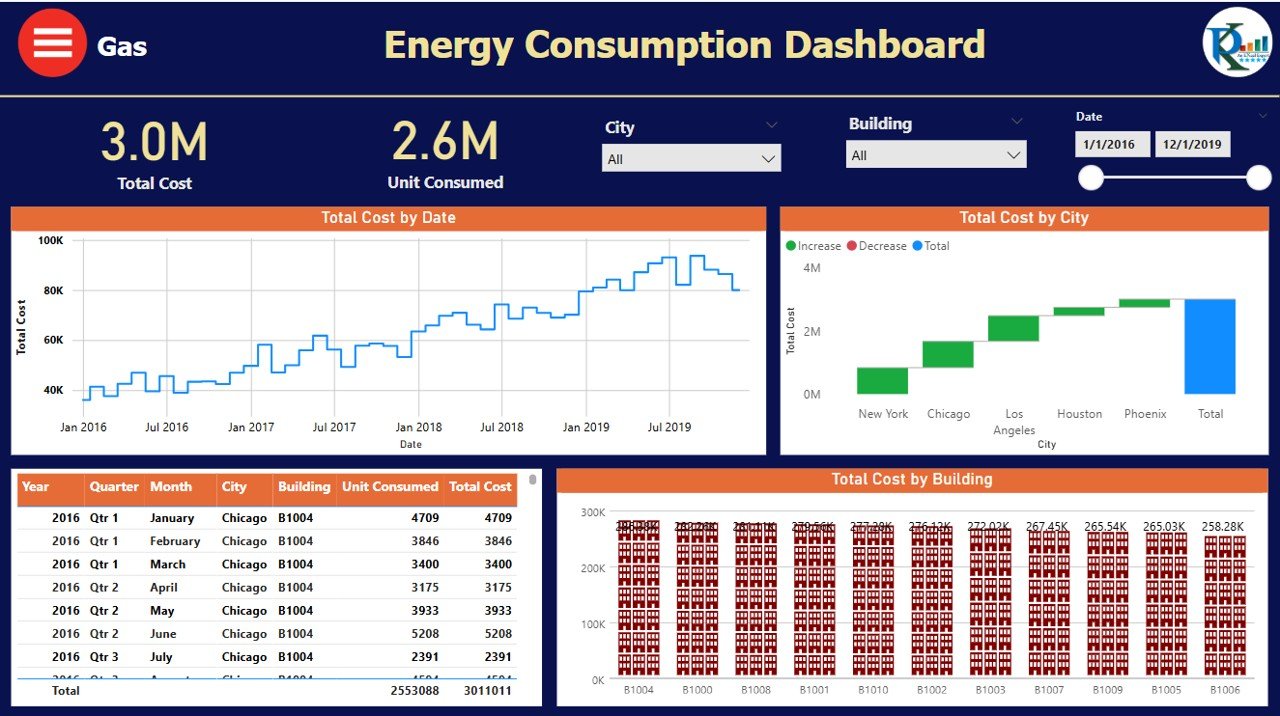
- Total Cost by City Map – Displays energy cost distribution across cities.
- Total Cost by Consumption Type – Compares cost distribution of electricity, gas, and water.
- Trend & Forecast Analysis – Tracks energy cost trends over time with predictive analytics.
- Total Cost by Building – Highlights energy costs at the building level, aiding cost-saving strategies.
-
Comparative Analysis of Energy Sources
- Breaks down energy consumption into separate dashboards for Water, Electricity, and Gas, each with detailed reports.
- Provides key insights into total cost, unit consumption, and cost per unit for each energy type.
-
Summary & Business Insights
- The summary panel provides high-level insights, including the most expensive energy source and highest-cost city.
- Helps businesses reduce energy wastage and implement cost-saving strategies.
Why Use This Dashboard?
- Monitor and control energy expenses across locations.
- Identify high-cost areas and reduce energy inefficiencies.
- Analyze trends to predict future consumption.
- Improve sustainability efforts by tracking and managing energy consumption effectively.
This Energy Consumption Dashboard in Power BI is a must-have for facility managers, sustainability teams, and business leaders looking to optimize energy efficiency and cost savings.
Click here to read the detailed blog post Energy Consumptions Dashboard in Power BI
Watch the step-by-step video tutorial: Energy Consumptions Dashboard in Power BI
Also check our Inventory Management Form in Excel


Reviews
There are no reviews yet.