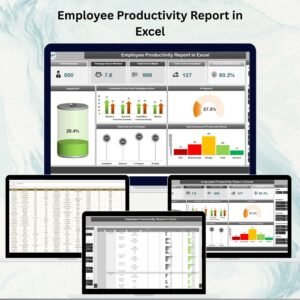
A productive workforce is the foundation of every successful organization — but without accurate reporting, it’s difficult to know where performance gaps exist and where improvements are needed. The Employee Productivity Report in Excel is a ready-to-use, fully customizable tool designed to help HR managers, team leads, and operations supervisors monitor and analyze employee performance in real time.
This report consolidates key productivity metrics — such as hours worked, tasks completed, efficiency percentage, and errors made — in one centralized dashboard. With automated cards, interactive charts, and powerful pivot tables, managers can easily identify top performers, detect bottlenecks, and make data-driven decisions to improve overall productivity.
Whether you need high-level insights or granular employee-level performance details, this Excel report helps you stay in control and continuously optimize your workforce.
🔑 Key Features of the Employee Productivity Report
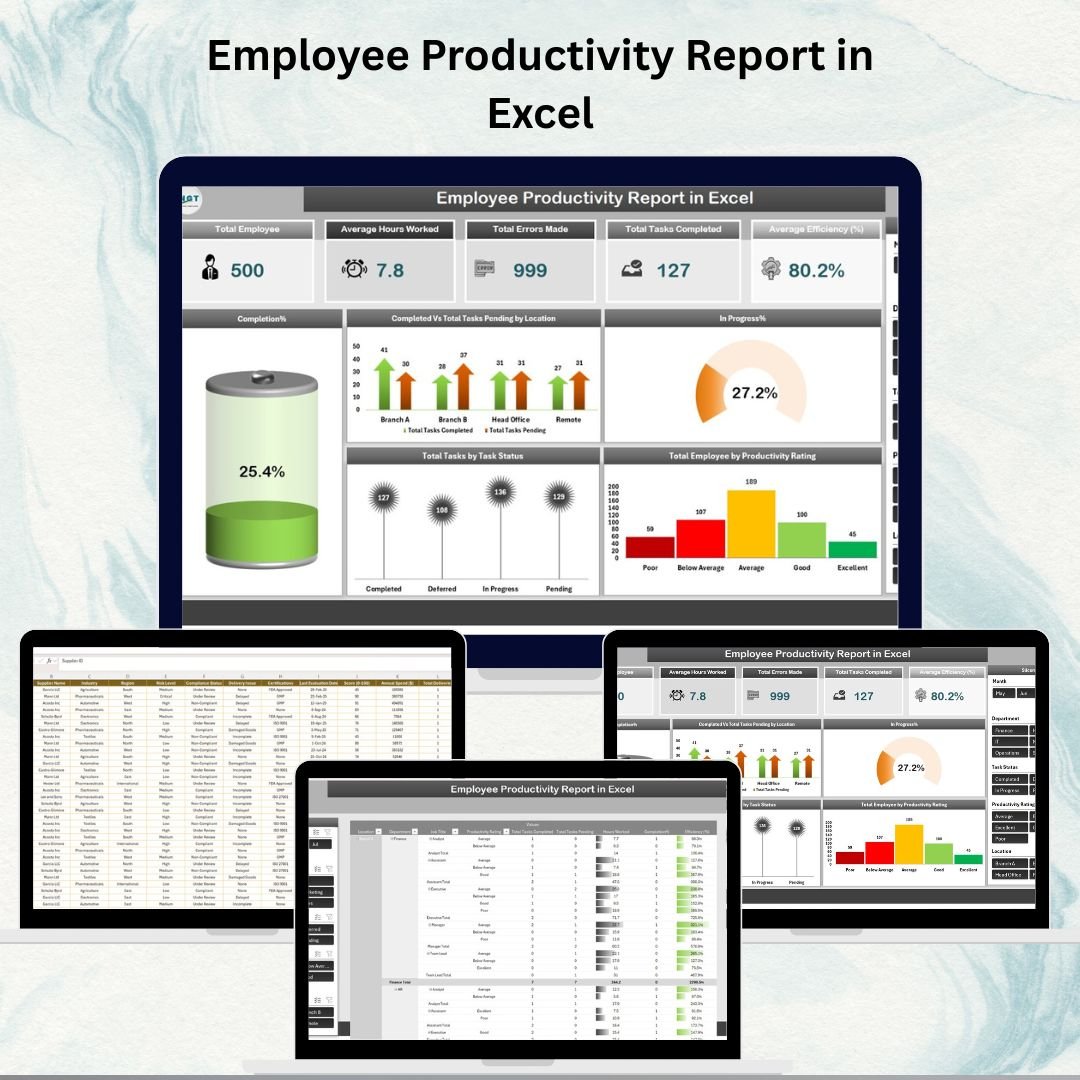
📌 Summary Sheet Tab – High-Level Performance Snapshot
-
Cards Include:
-
Total Employees
-
Average Hours Worked
-
Total Errors Made
-
Total Tasks Completed
-
Average Efficiency (%)
-
-
Charts Include:
-
Task Completion (%)
-
Completed vs Pending Tasks by Location
-
In Progress (%)
-
Total Employees by Productivity Rating
-
Total Tasks by Task Status
-
Quickly visualize the overall performance and spot areas of concern at a glance.
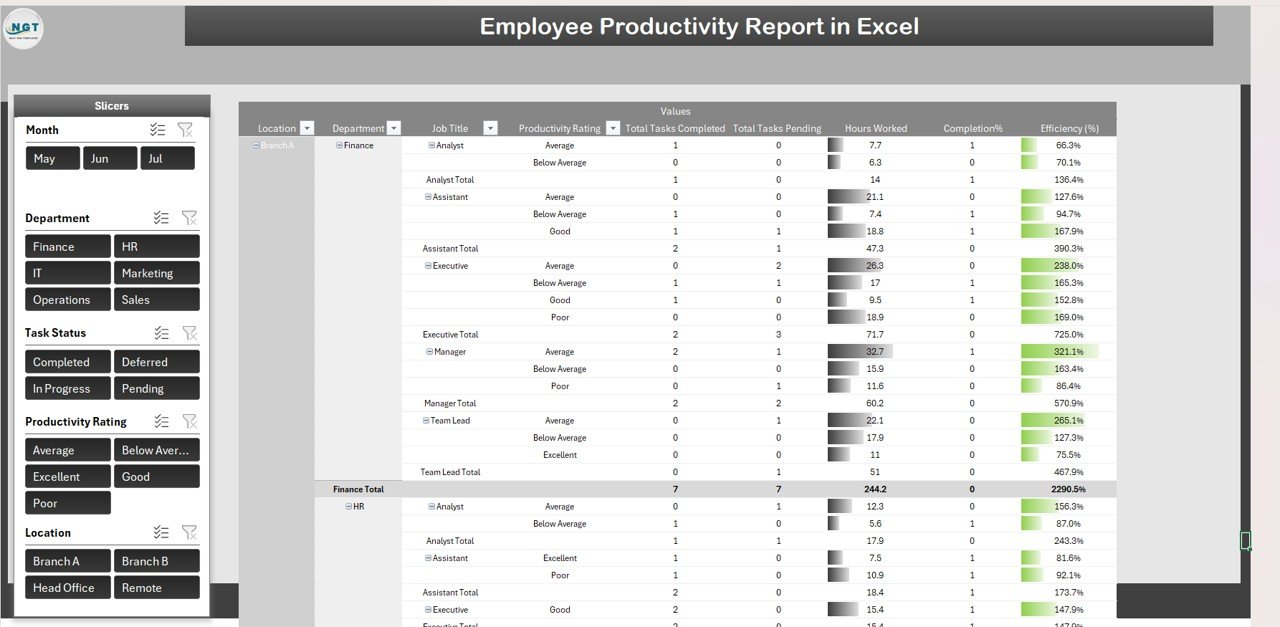
📌 Report Sheet Tab – Detailed Pivot Table Analysis
-
Filter by department, location, or individual employee
-
Compare efficiency across teams
-
Drill down into errors, pending tasks, and performance trends
-
Identify high/low-performing employees instantly
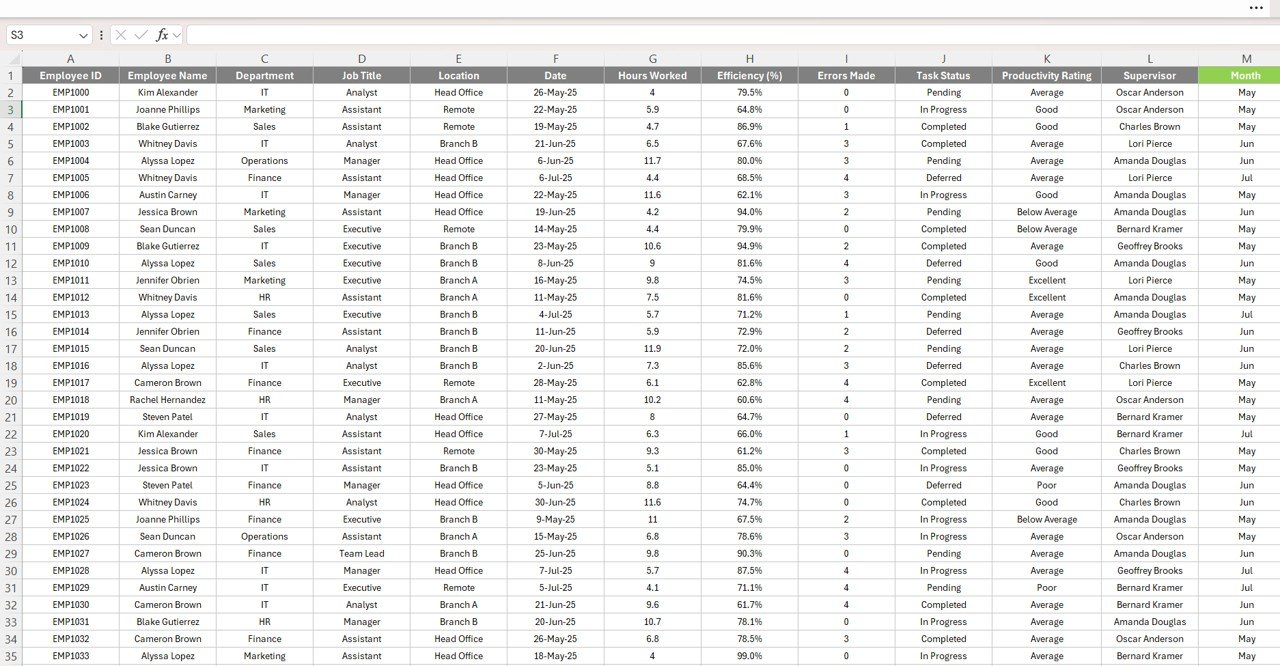
📌 Data Sheet Tab – Centralized Employee Database
-
Fields include:
-
Employee Name & ID
-
Department & Location
-
Hours Worked
-
Tasks Completed
-
Tasks Pending
-
Errors Made
-
Efficiency (%)
-
-
All charts, cards, and pivot tables update automatically once this sheet is updated
📦 What’s Inside the Employee Productivity Report?
✅ Summary Sheet – KPI cards & performance charts
✅ Report Sheet – Pivot-based productivity analysis
✅ Data Sheet – Centralized employee performance log
✅ Pre-built Formulas & Visuals – No setup required
✅ Customizable Fields – Add new KPIs or visuals as needed
✅ Sample Data Included – See how everything works instantly
🧠 How to Use the Report
-
Open the file and go to the Data Sheet
-
Enter/update employee performance data
-
View overall metrics and trends via the Summary Sheet
-
Use the Report Sheet to drill down by team, location, or individual
-
Track progress and take action to improve overall productivity
👥 Who Can Benefit from This Report?
-
👩💼 HR Managers – Track performance and identify training needs
-
👨💼 Team Leaders – Monitor day-to-day task progress and efficiency
-
🏢 Operations Managers – Analyze workplace productivity across locations
-
📊 Business Analysts – Generate reports for performance review meetings
🔗 Click here to read the Detailed blog post
Watch the step-by-step video Demo:


Reviews
There are no reviews yet.