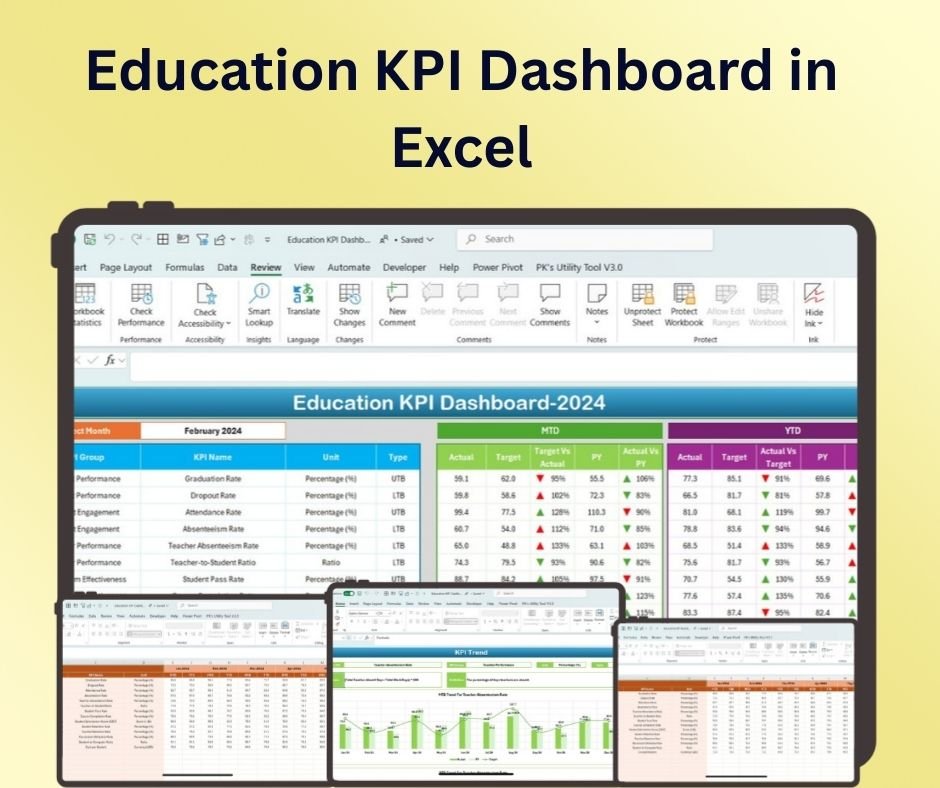
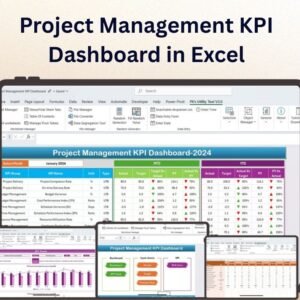
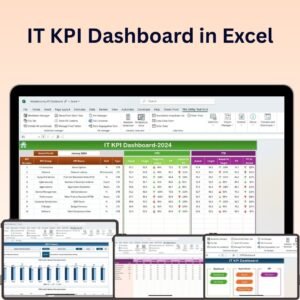
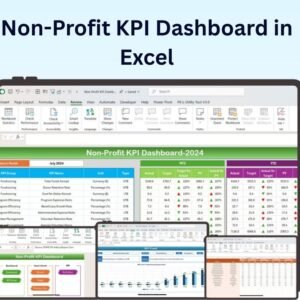
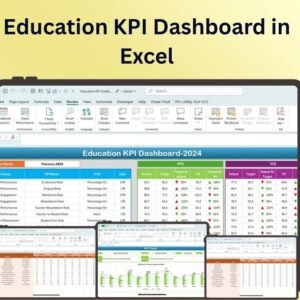
The Education KPI Dashboard in Excel is an essential tool for educational institutions, administrators, and educators who want to monitor and track the key performance indicators (KPIs) that drive student success, institutional effectiveness, and overall academic performance. This Excel-based dashboard offers a clear and comprehensive view of vital metrics such as student attendance, grades, graduation rates, faculty performance, and more.
Designed to be user-friendly, this dashboard allows you to analyze trends, track progress over time, and make data-driven decisions that can help improve academic outcomes, student engagement, and institutional performance. Whether you’re managing a school, college, or university, the Education KPI Dashboard provides real-time insights into key areas of your institution, helping you stay on top of performance, identify issues early, and optimize resources.

Key Features of the Education KPI Dashboard in Excel:
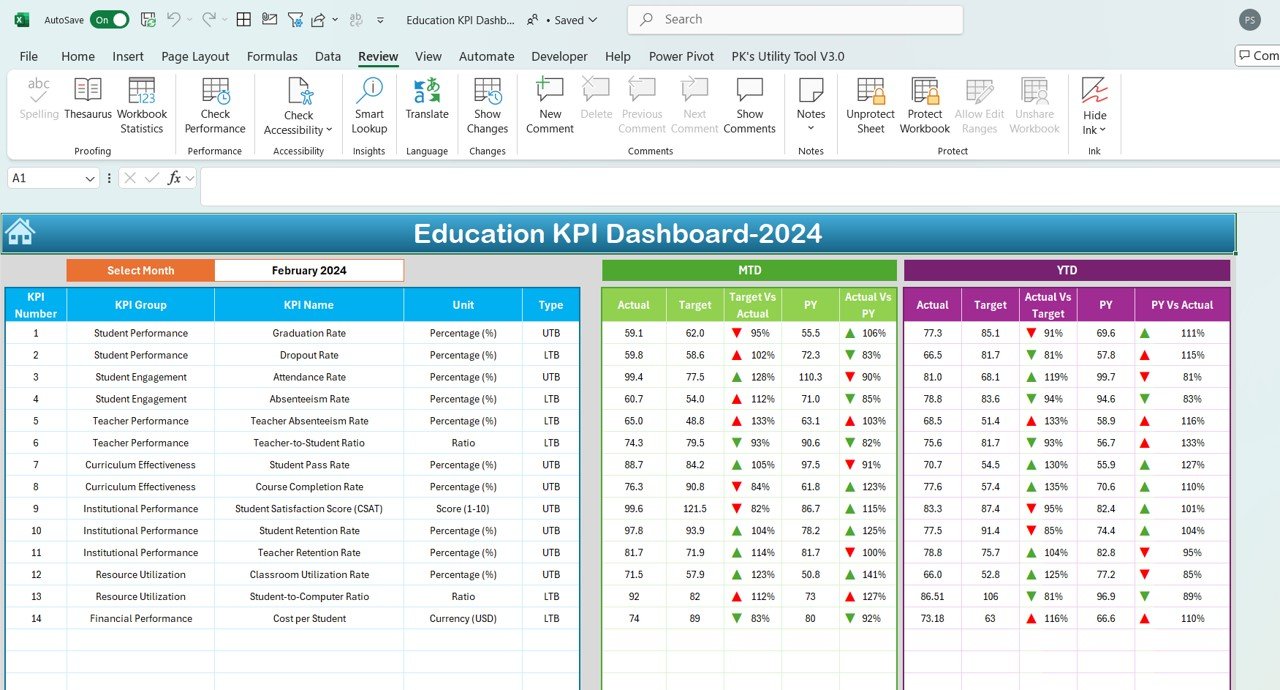
📊 Comprehensive KPI Tracking
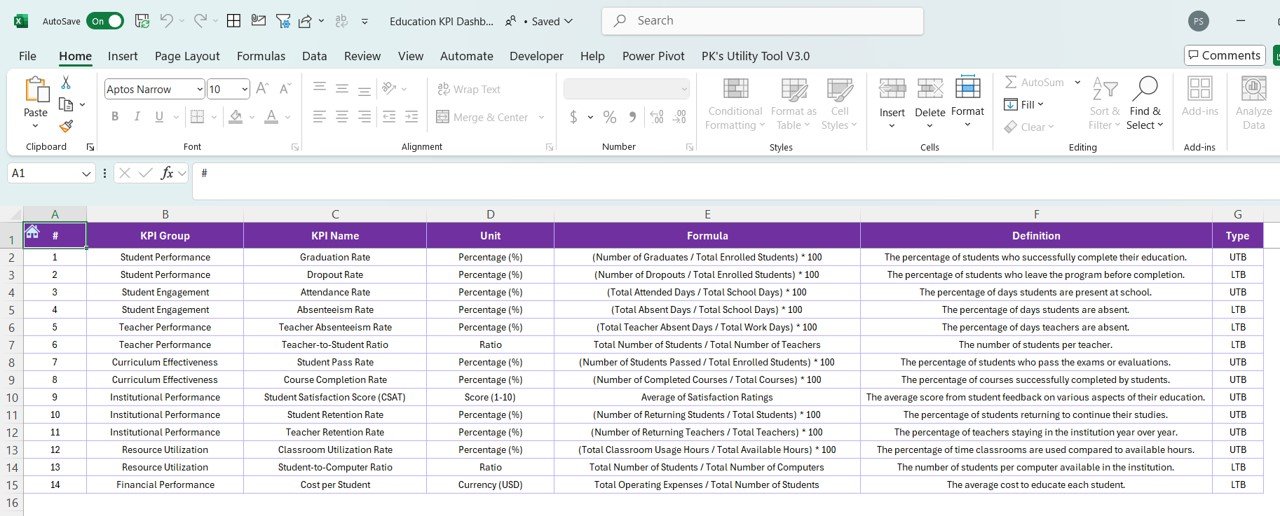
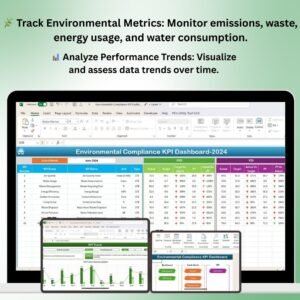
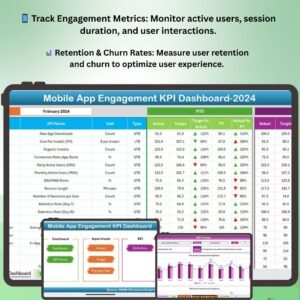
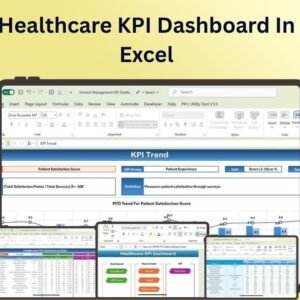
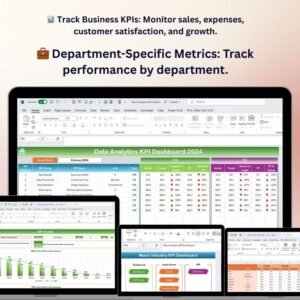
Monitor essential education KPIs, including student attendance, academic performance (grades), graduation rates, student satisfaction, and faculty performance.
📉 Real-Time Data Updates
The dashboard updates automatically as you input new data, providing you with up-to-the-minute insights into your educational institution’s performance.
📈 Customizable Metrics
Tailor the dashboard to reflect the specific KPIs and metrics that matter most to your institution, such as class participation, dropout rates, or faculty productivity.
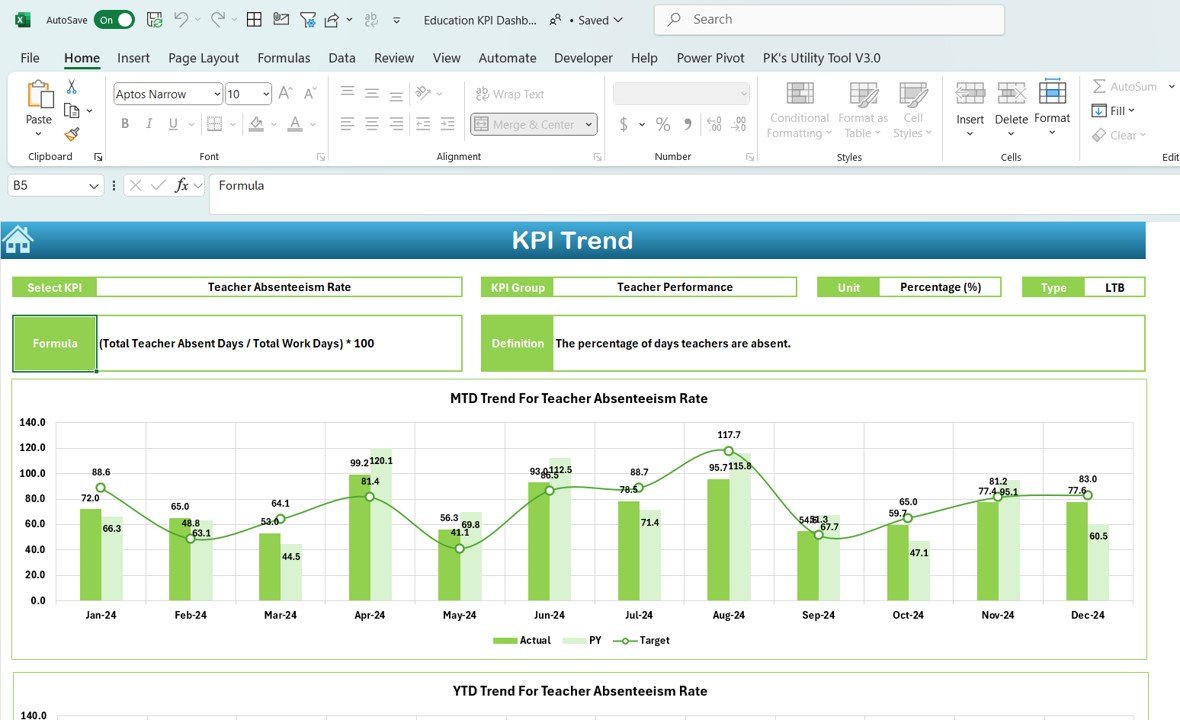
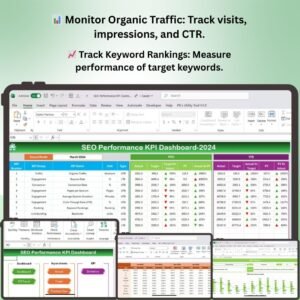
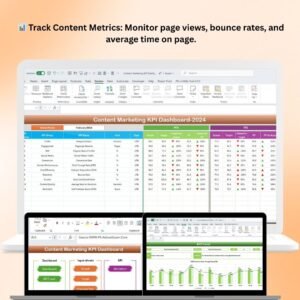
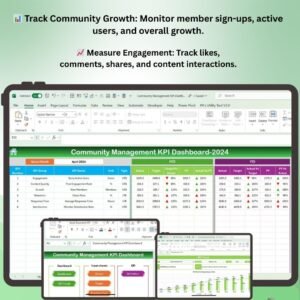
🎨 Visual Data Representation
Use intuitive charts, graphs, and visual indicators to track KPIs, making it easier to identify trends, gaps, and areas for improvement.
📅 Student and Faculty Monitoring
Monitor both student and faculty performance with KPIs related to academic results, attendance, course completion, and overall satisfaction.
Why You’ll Love the Education KPI Dashboard in Excel:
✅ Comprehensive Performance Monitoring – Track a wide variety of performance metrics in one centralized dashboard, giving you a holistic view of your institution’s performance. ✅ Real-Time Insights – Stay updated with real-time data updates that keep you informed about ongoing academic and administrative performance. ✅ Customizable to Fit Your Needs – Adjust the dashboard to meet your specific institution’s KPIs, goals, and priorities. ✅ Clear Visual Insights – Use easy-to-understand graphs and charts to visualize data, helping you make informed decisions. ✅ User-Friendly – Designed to be intuitive and accessible, even for users with minimal Excel experience.
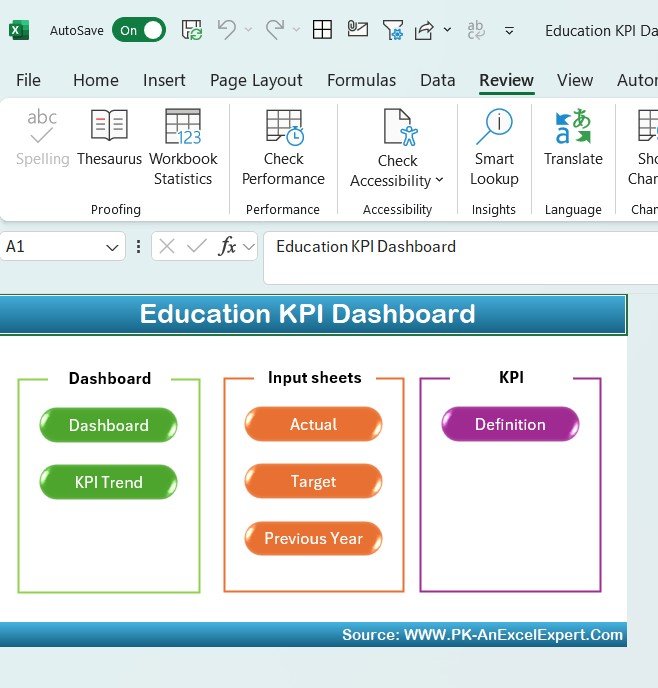
What’s Inside the Education KPI Dashboard in Excel:
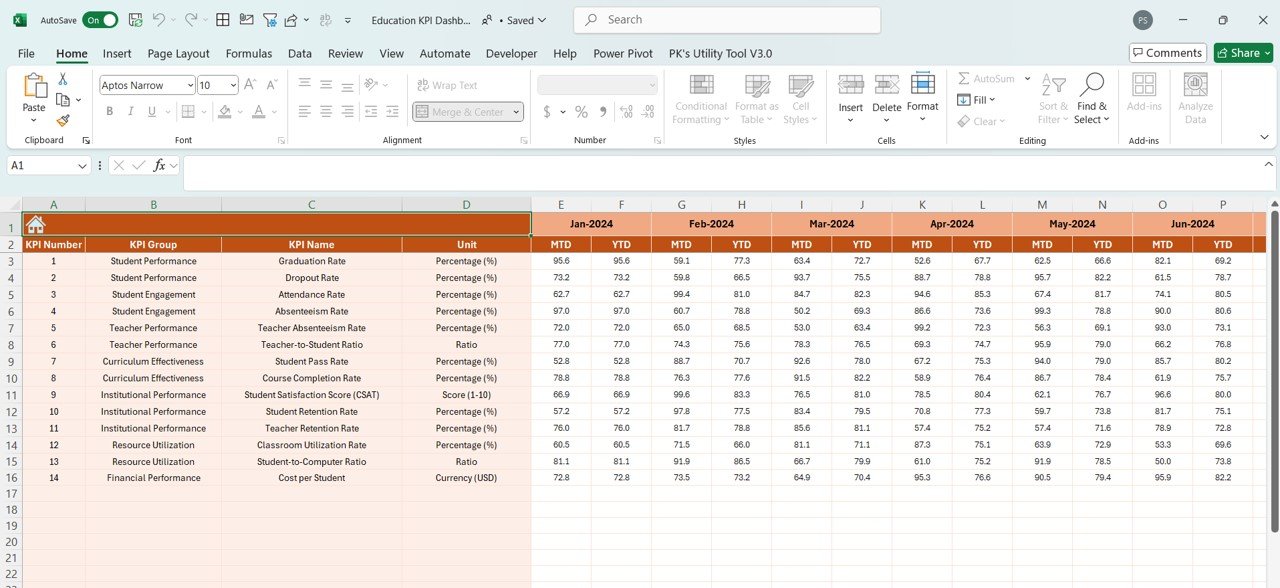
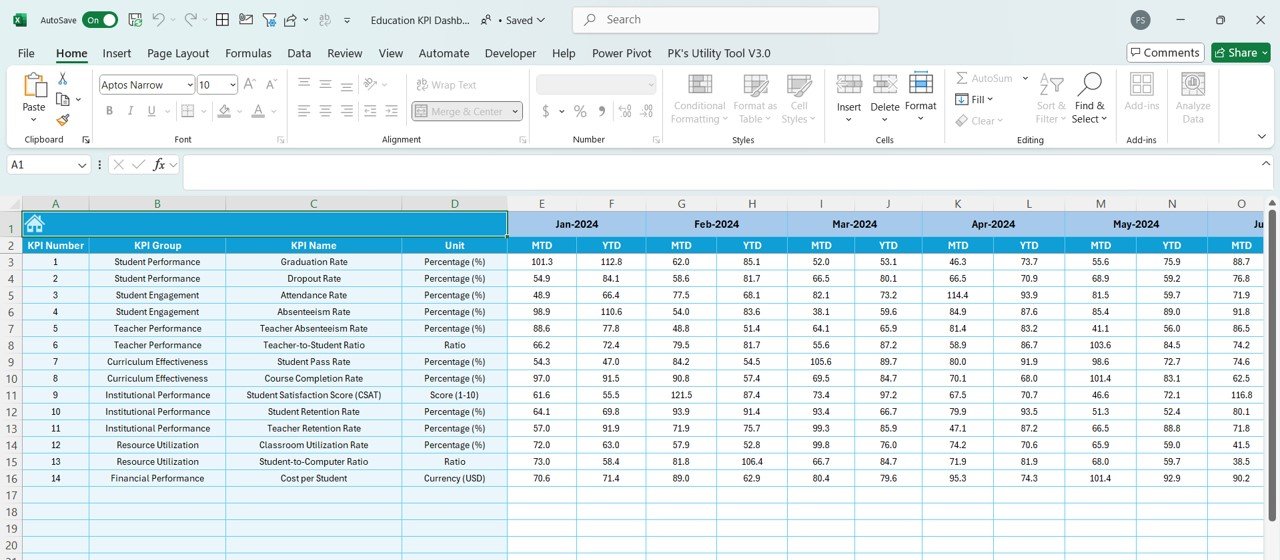
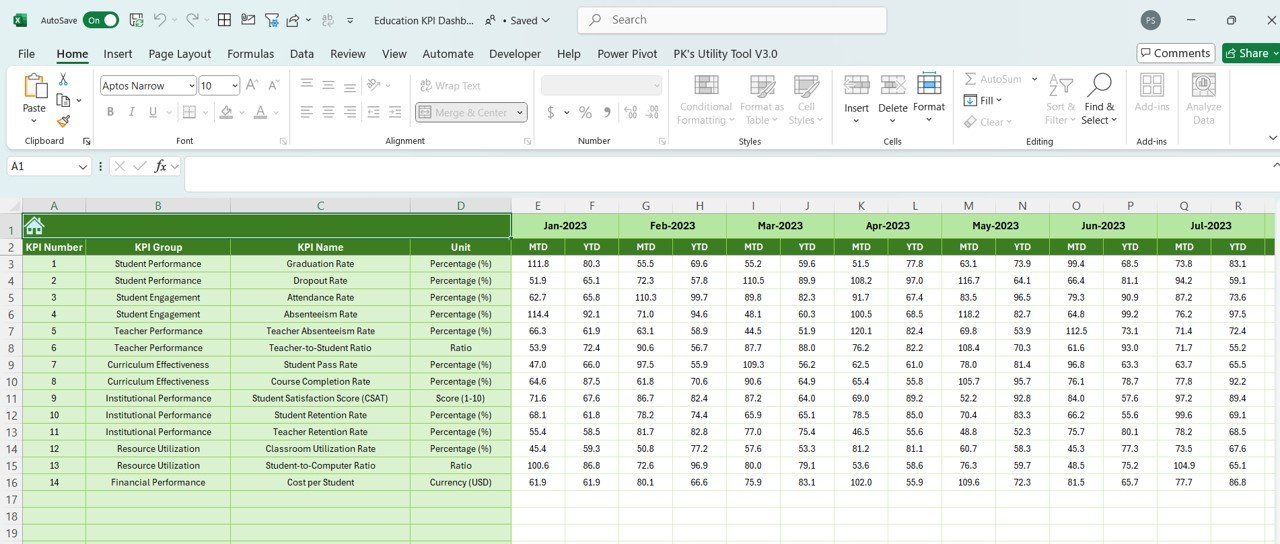
- Education KPIs – Track essential metrics such as student performance (grades), attendance, graduation rates, and faculty productivity.
- Real-Time Data Updates – The dashboard automatically updates with the latest data you input, ensuring that your insights are always up-to-date.
- Customizable Design – Adjust the dashboard to reflect your specific education institution’s KPIs and reporting needs.
- Visual Performance Indicators – Use dynamic charts, graphs, and progress bars to track key performance metrics.
- Student & Faculty Monitoring – Track the academic progress of students and faculty to identify trends and opportunities for improvement.
How to Use the Education KPI Dashboard in Excel:
1️⃣ Download the Template – Get immediate access to the Excel file upon purchase. 2️⃣ Input Your Data – Enter data on student attendance, grades, graduation rates, and faculty performance into the dashboard. 3️⃣ Customize the Layout – Adjust the KPIs and layout to reflect your institution’s specific goals and performance indicators. 4️⃣ Monitor Performance – Track the progress of your institution with real-time data updates. 5️⃣ Make Data-Driven Decisions – Use the insights from the dashboard to improve academic outcomes, resource allocation, and institutional performance.
Who Can Benefit from the Education KPI Dashboard in Excel:
- School Administrators
- College and University Administrators
- Educators
- Faculty Members
- Education Managers
- Data Analysts in Educational Institutions
- Anyone involved in the management and oversight of educational programs and institutions
The Education KPI Dashboard in Excel is an indispensable tool for educational institutions looking to track and improve performance. With its easy-to-use design, real-time updates, and customizable features, this dashboard empowers administrators, educators, and faculty to make data-driven decisions and improve student outcomes.
Click here to read the Detailed blog post
https://www.pk-anexcelexpert.com/education-kpi-dashboard-in-excel/


Reviews
There are no reviews yet.