In today’s data-driven education world, tracking performance isn’t just important—it’s essential. Whether you’re a school principal, coaching institute owner, or educational policymaker, you need a structured way to measure, monitor, and improve learning processes.
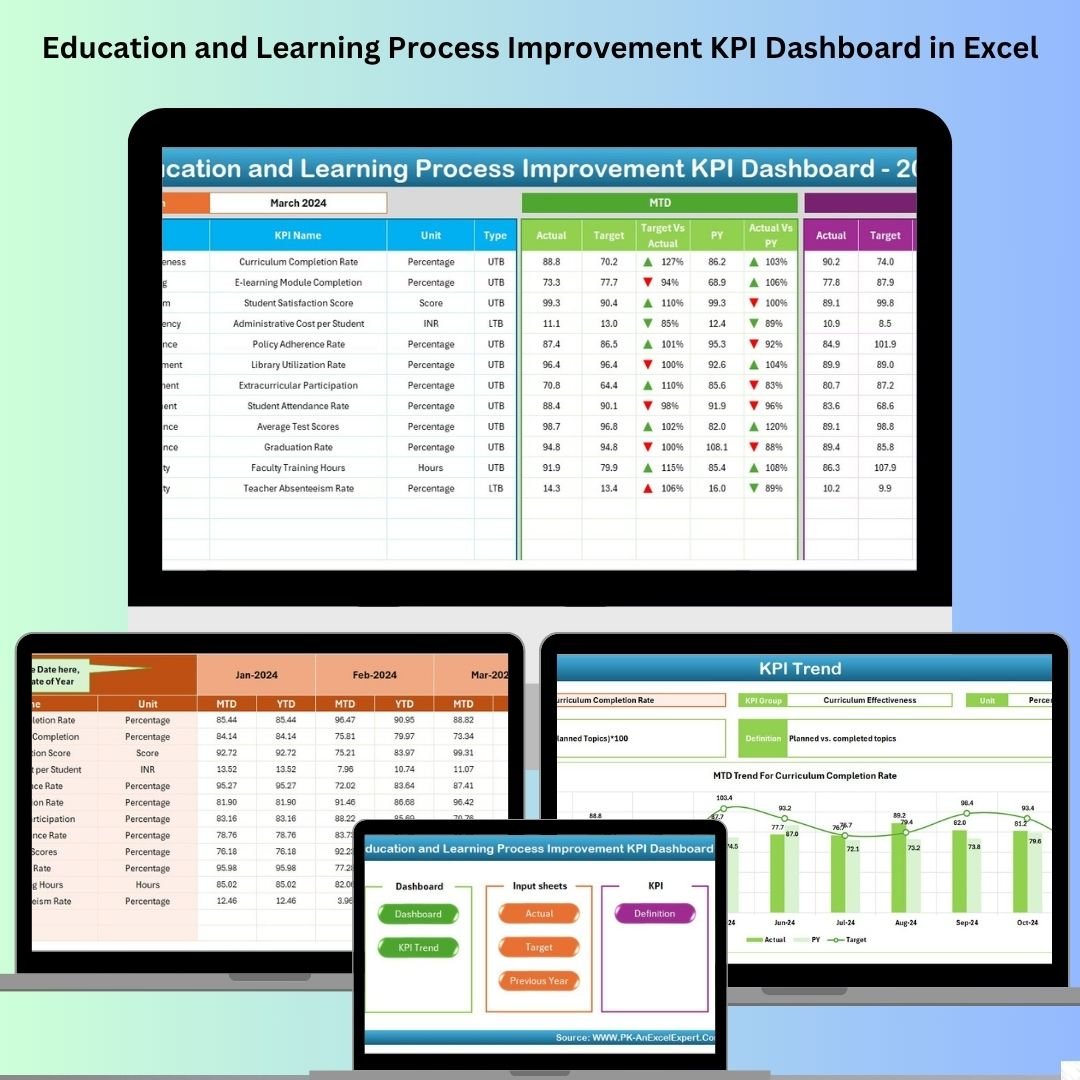
That’s where the Education and Learning Process Improvement KPI Dashboard in Excel comes in—a smart, ready-to-use dashboard built entirely in Excel with interactive charts, drop-downs, and automation. No need for coding, software installations, or technical support. Just plug in your data and watch your insights unfold!
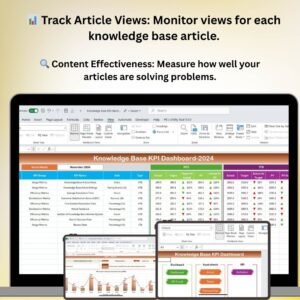
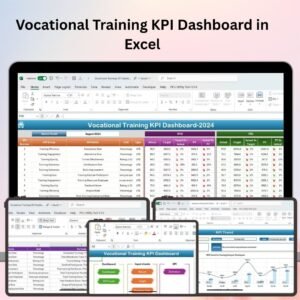
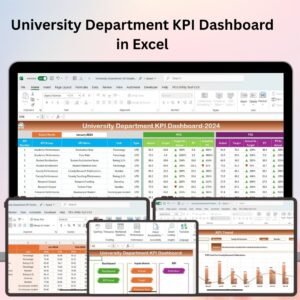
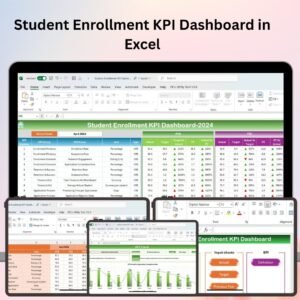
From student attendance to faculty performance and curriculum coverage to budget utilization—this dashboard gives you a clear, real-time view of your institution’s performance.
✨ Key Features of Education and Learning KPI Dashboard
📊 Dynamic Dashboard with Slicers
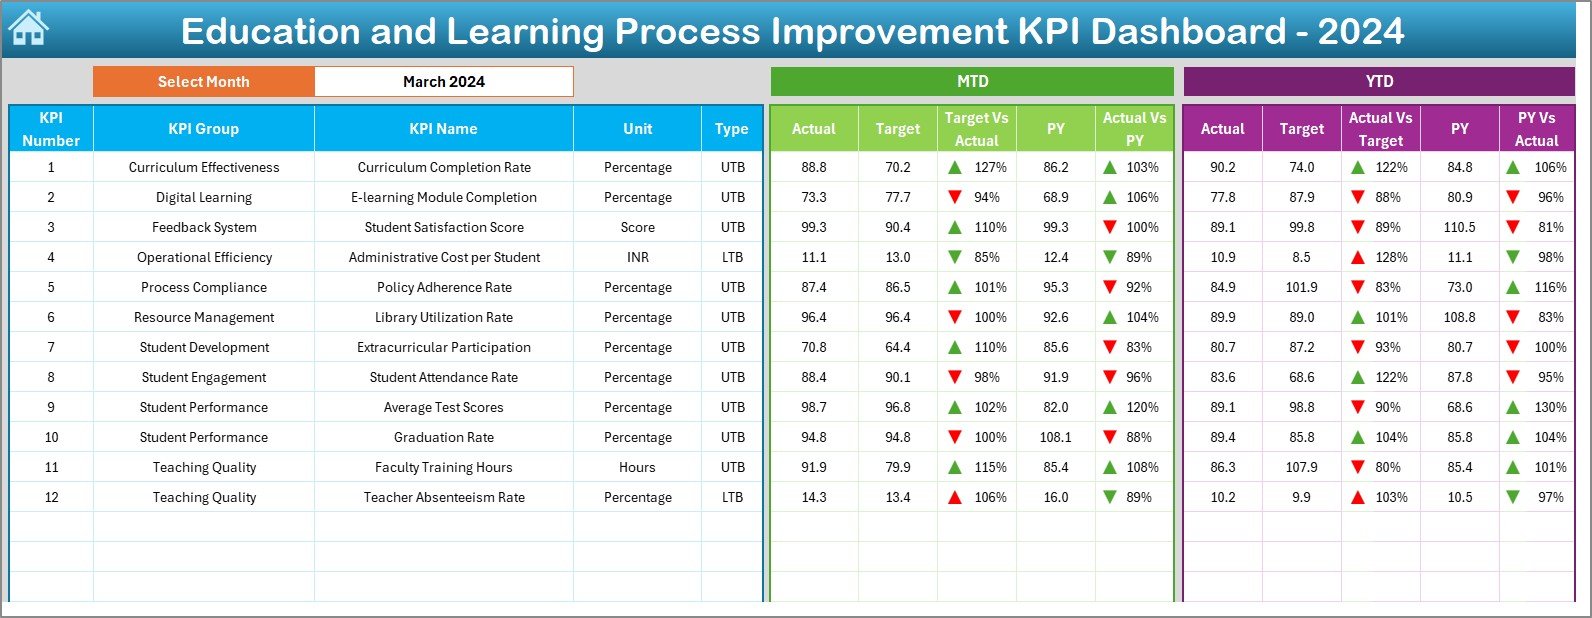
Easily filter KPIs by month and get automatic updates with rich visuals. Includes conditional formatting with up/down arrows to instantly show performance gaps.
🧩 Structured Worksheets
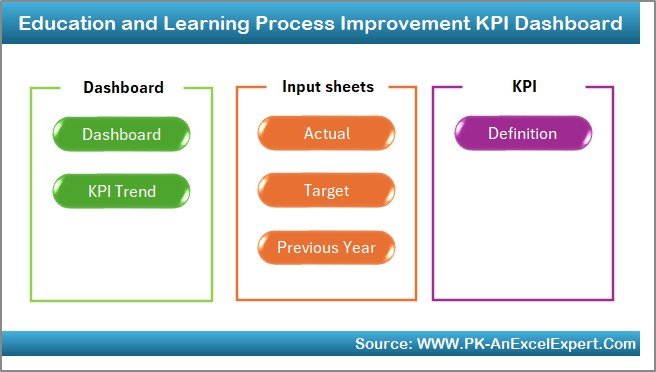
The tool comes with 7 pre-designed tabs, including:
-
Home Sheet for navigation
-
Dashboard Sheet for summary metrics
-
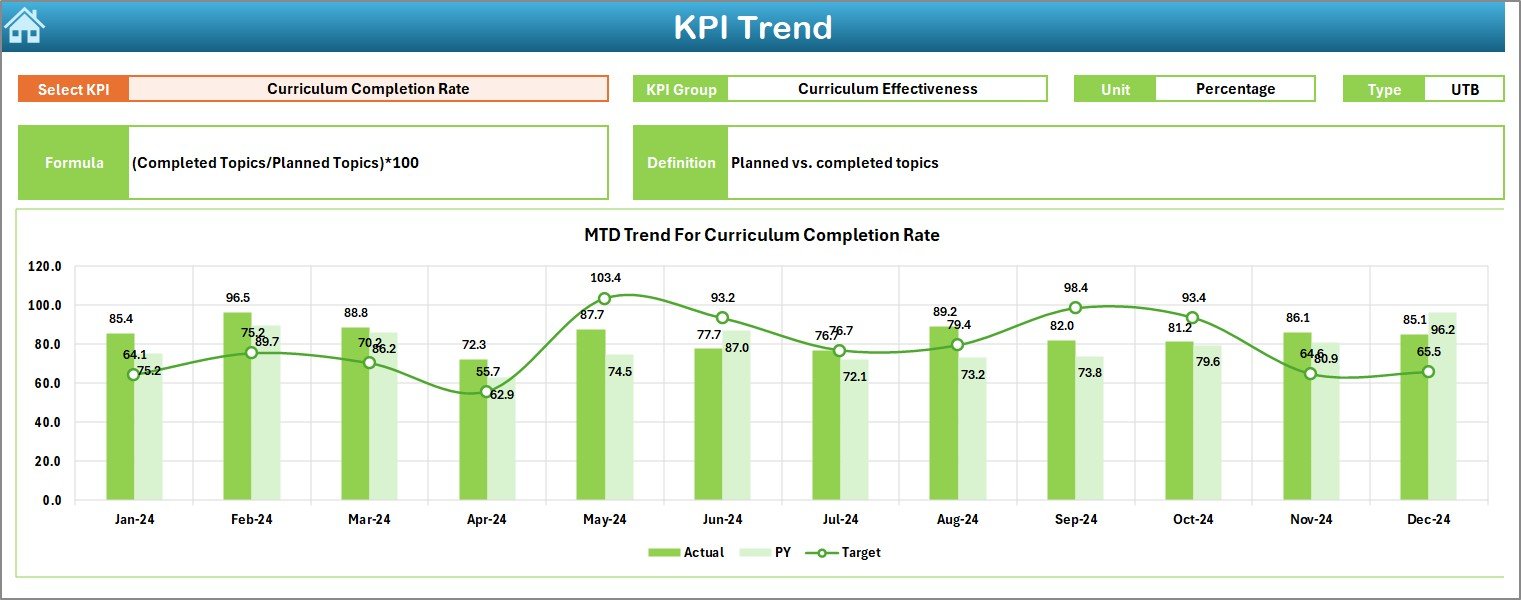
KPI Trend Sheet for line chart analysis
-
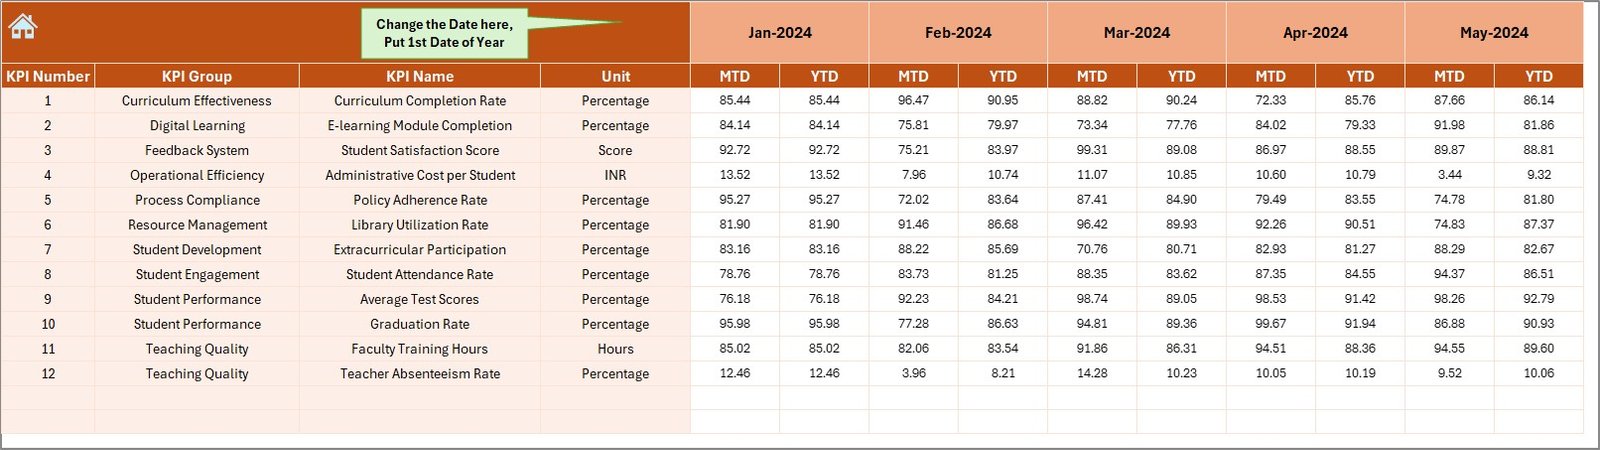
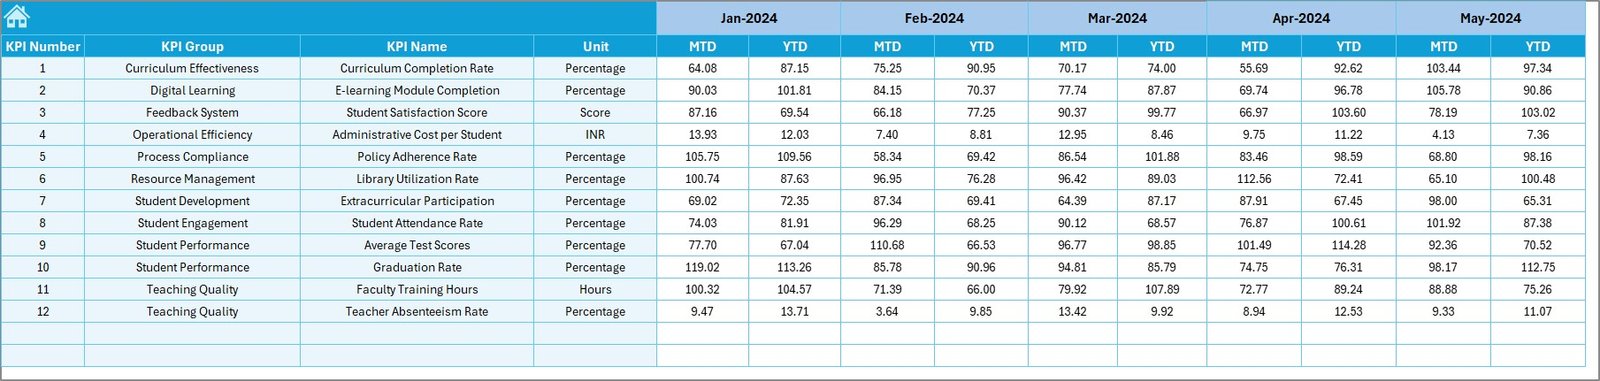
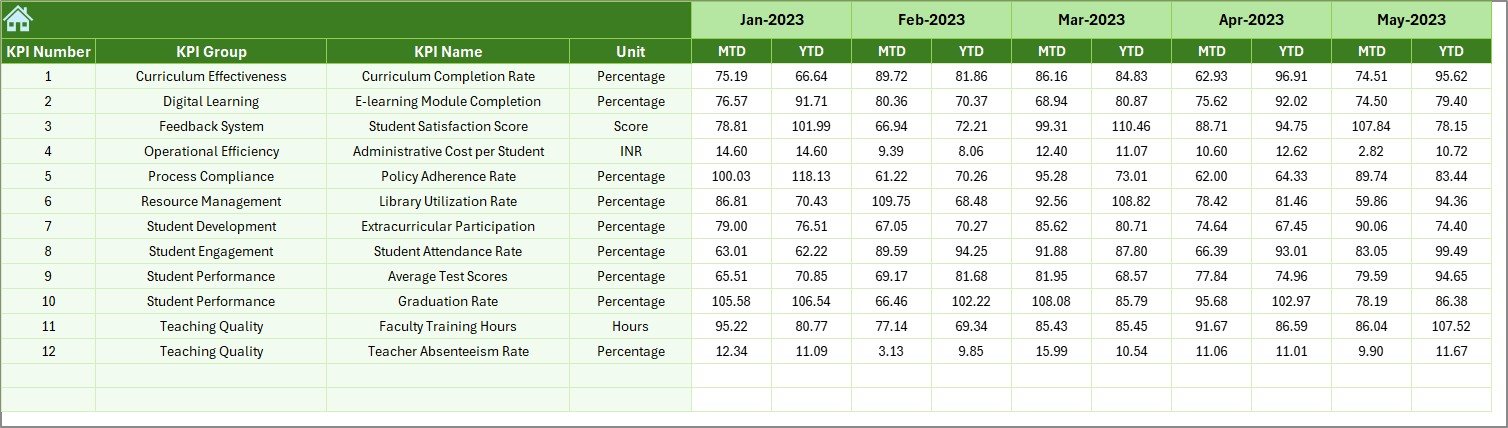
Data Input sheets for Actual, Target & Previous Year values
-
KPI Definition Sheet for full transparency
📈 MTD & YTD Performance Tracking
View Month-to-Date and Year-to-Date Actuals, Targets, and Previous Year comparisons all in one place.
📥 Easy Data Entry
Simply input your numbers into structured cells—no formulas or coding needed.
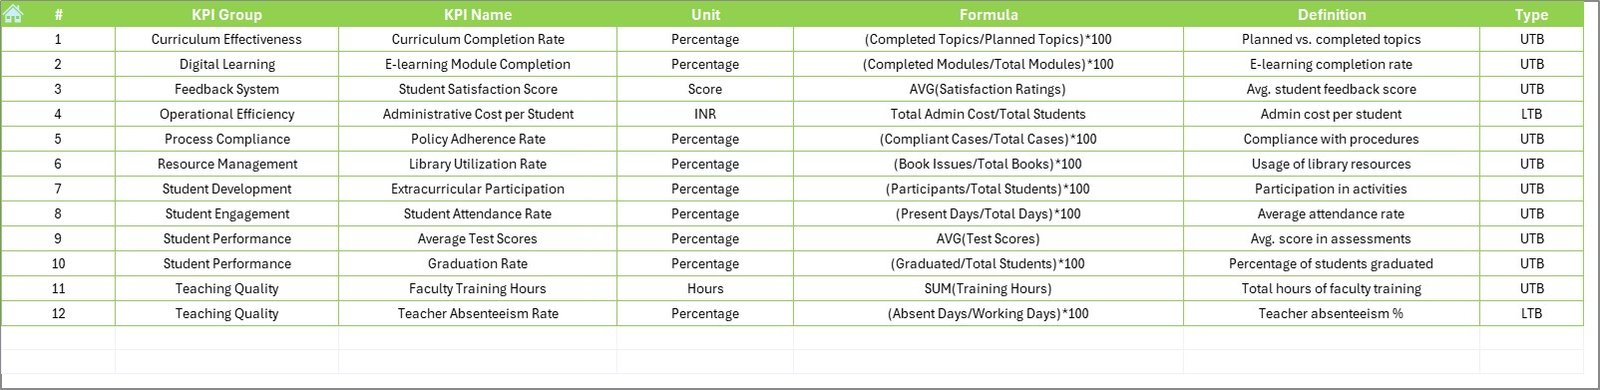
📘 Clear KPI Definitions
Each KPI includes:
-
Name
-
Group
-
Unit
-
Type (Upper or Lower the Better)
-
Formula
-
Description
🔁 Year-over-Year Comparison
Spot trends and improvements over time by comparing current data with previous year values.
🎯 Fully Customizable
Modify KPIs, chart types, themes, and slicer filters to suit your institution’s branding and objectives.
📦 What’s Inside the Product?
Once you download the template, you’ll receive:
✅ Excel Dashboard File with:
-
7 interactive sheet tabs
-
1-click navigation via Home Page
-
Pre-linked formulas and charts
-
Conditional formatting logic
-
KPI list and definition table
✅ Real-time updates with drop-down filters
✅ Built-in analytics to review both academic and operational KPIs
✅ Ready-made framework to track student, faculty, curriculum, and finance KPIs
🛠️ How to Use the Education KPI Dashboard
-
Download the Excel file
-
Open the Home Sheet and navigate using buttons
-
Select the starting month in the data entry sheet
-
Enter Actuals in the Actual Numbers sheet
-
Input Targets in the Target sheet
-
Fill Previous Year Data in the dedicated tab
-
Customize KPI Names, Units, and Types
-
Sit back and review the Dashboard + KPI Trend visuals 📊
All the charts and comparisons will update automatically! No manual refresh needed.
👥 Who Can Benefit from This Product?
🎓 School Principals & Admins – Track curriculum coverage, student performance, and teacher workload
🏫 Coaching Center Owners – Monitor test results, completion rates, and student engagement
🏛️ Policy Makers – Ensure measurable results from educational programs
📚 Nonprofits & NGOs – Track educational impact metrics across projects
📈 Training Institutes – Measure trainer effectiveness and participant outcomes
🔥 Advantages of the KPI Dashboard
✅ Real-Time Visibility – See what’s working & where to improve
✅ Customizable KPIs – Align with your unique institutional goals
✅ Easy for Non-Technical Users – Designed for educators, not programmers
✅ Helps with Decision Making – Provides meaningful data at your fingertips
✅ Saves Time – Update once a month & get full report instantly
📖 Click here to read the Detailed blog post
▶️ Visit our YouTube channel to learn step-by-step video tutorials
👉 youtube.com/@PKAnExcelExpert


Reviews
There are no reviews yet.