 No Software Required – Just open in Excel and get started!
Are you an educator, administrator, or trainer struggling to track performance metrics manually? 
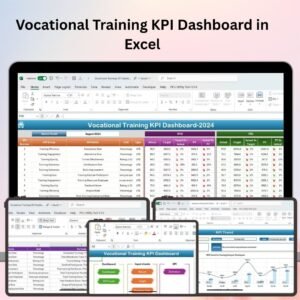
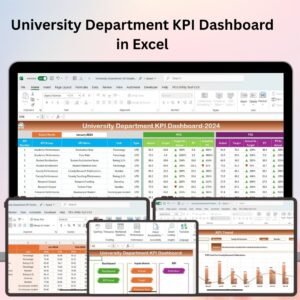
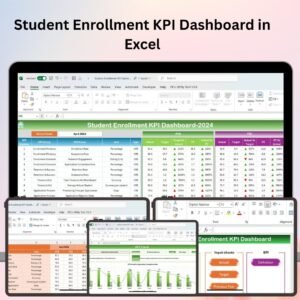
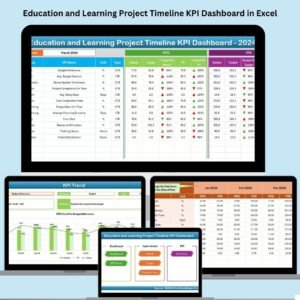
Then say hello to the Education and Learning Performance KPI Dashboard in Excel — your all-in-one, ready-to-use Excel tool that transforms educational data into actionable insights. 
Whether you’re running a school, managing a training center, or overseeing an e-learning platform, this dashboard is your ultimate performance tracker, designed to streamline operations, boost accountability, and drive student success.
 Key Features of Education and Learning KPI Dashboard
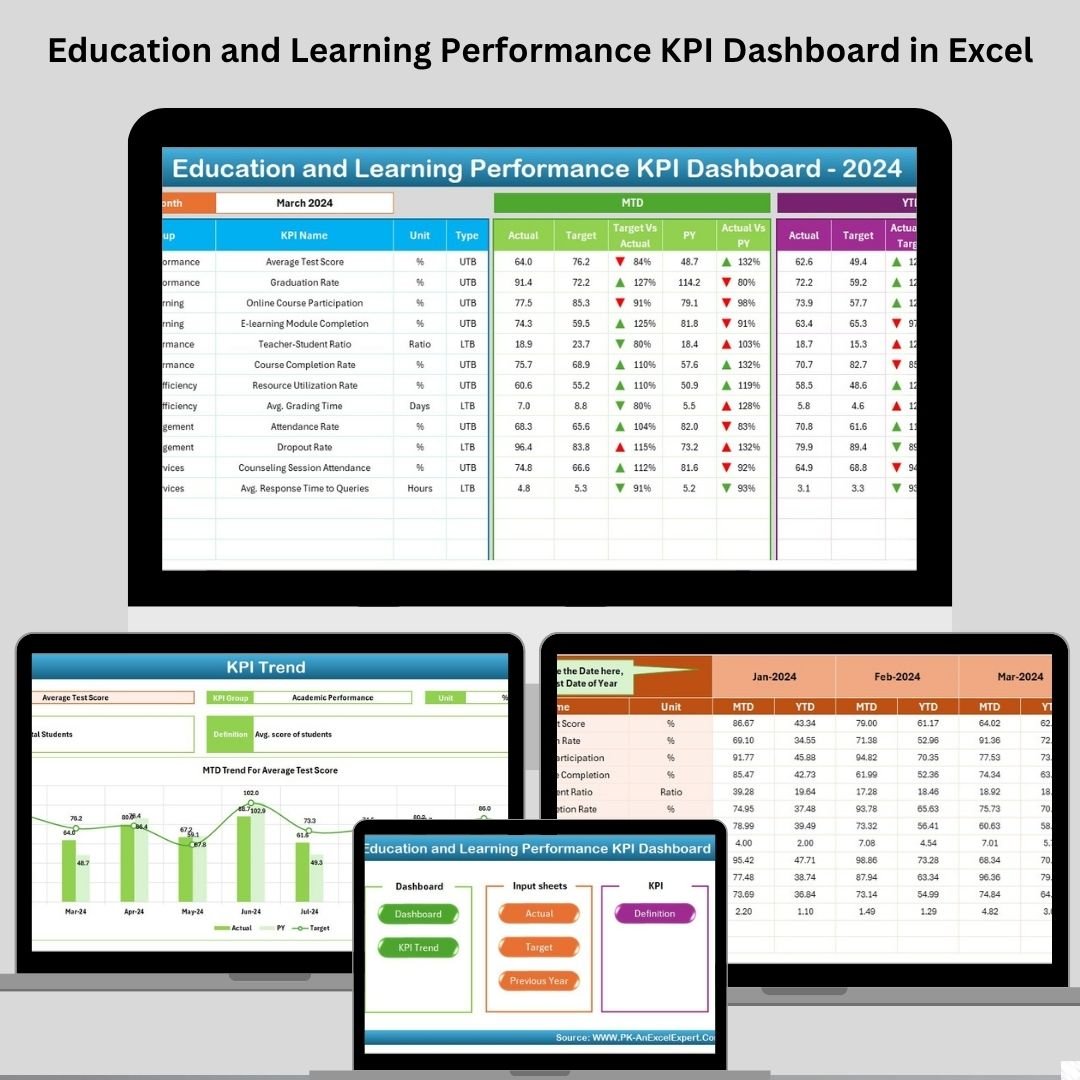
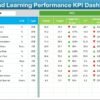
 Interactive Dashboard for Instant Insights
The Dashboard sheet is the heart of this template. Just pick a month, and everything updates automatically:
-
 Month-to-Date (MTD) and Year-to-Date (YTD) metrics
 -
 Targets vs. Actuals with previous year comparisons
 -
 Visual indicators (green/red arrows) to spot trends fast
 -
 Color-coded formatting for clarity during presentations
Ideal for review meetings, board reports, or weekly check-ins!
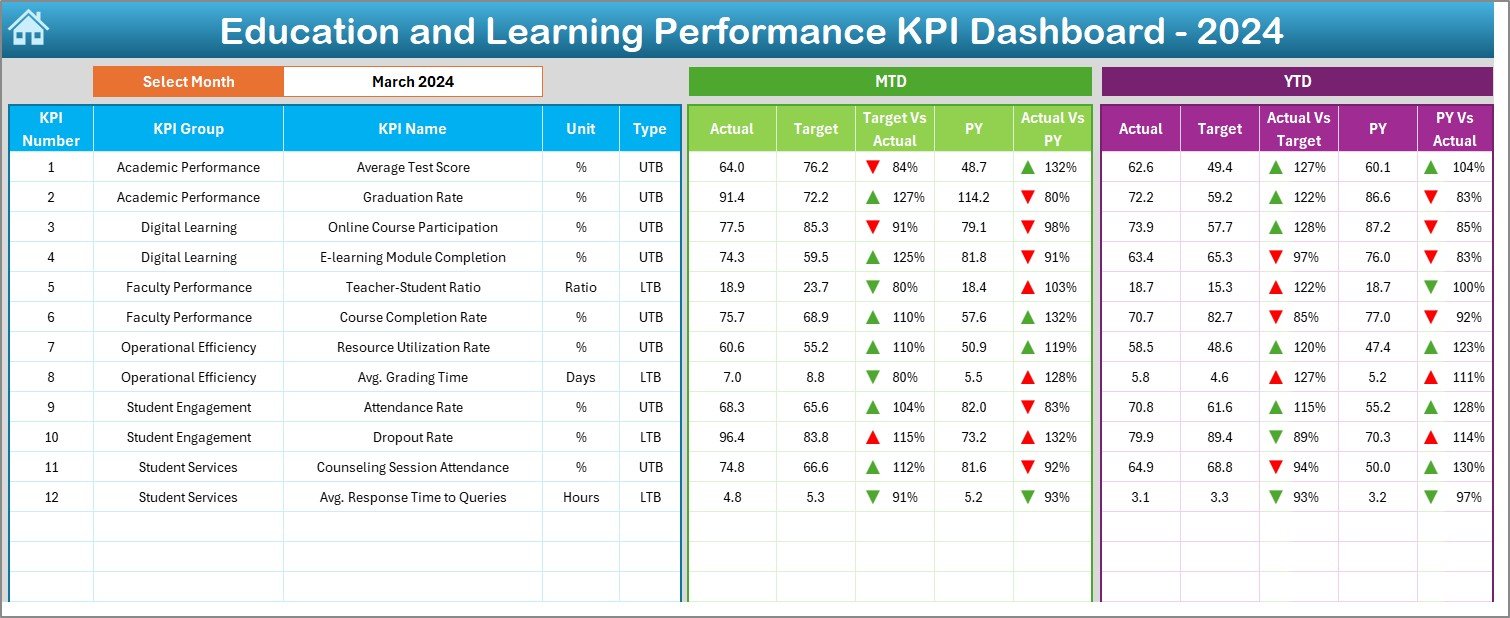
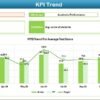
 KPI Trend Sheet to Monitor Long-Term Progress
Deep-dive into any KPI with the click of a dropdown:
-
 See KPI definition, group, formula, and measurement unit
 -
Track MTD and YTD trends against targets and previous year
-
 Spot patterns early and make data-driven interventions
No more guesswork — just clean, contextual insights.
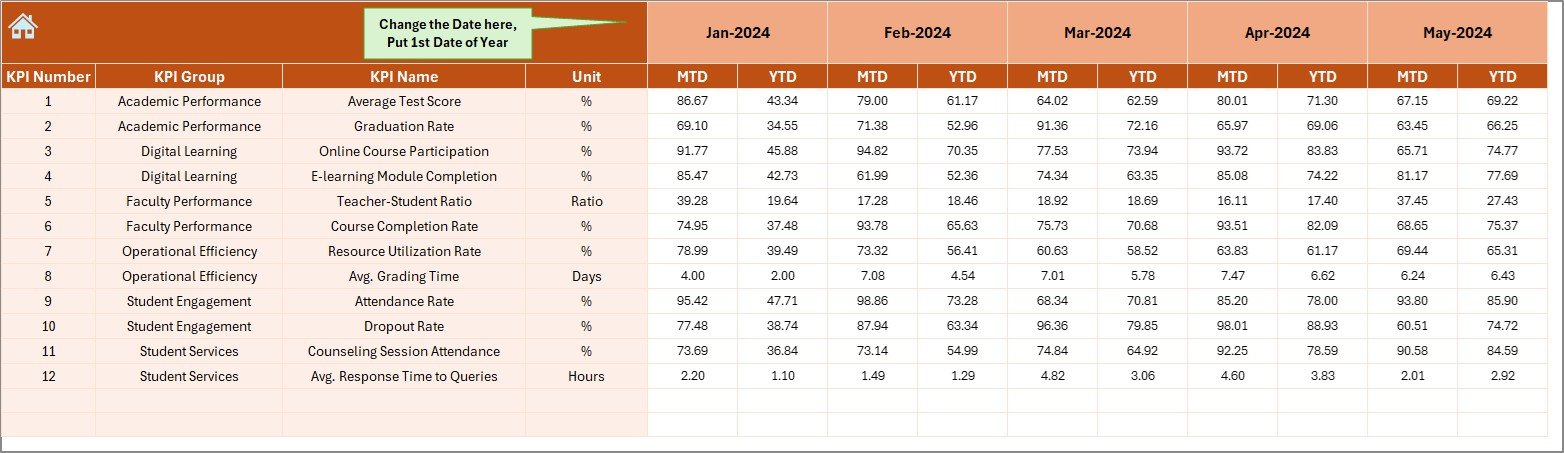
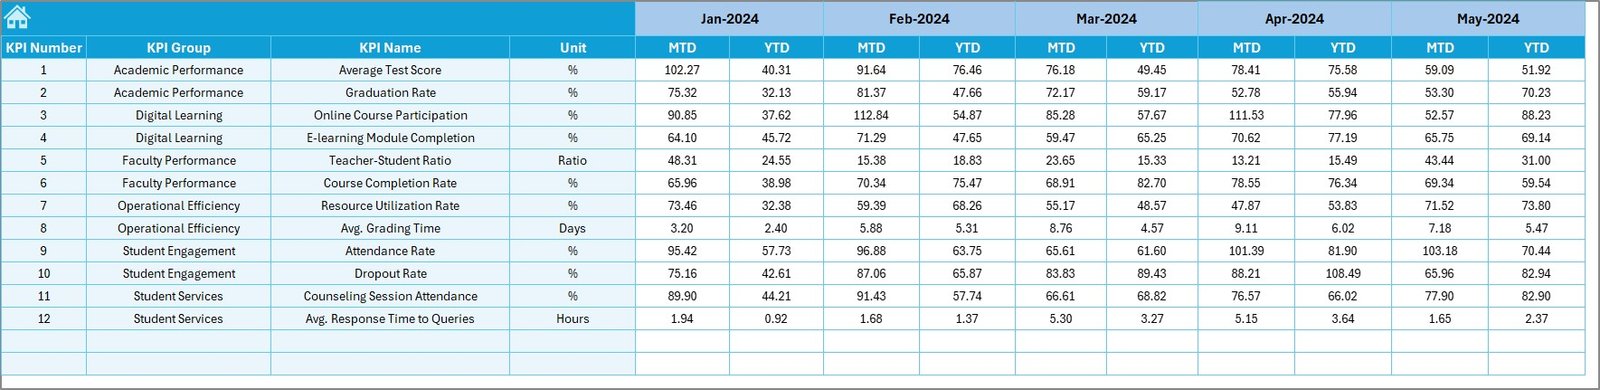
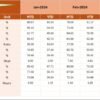
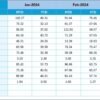
 Actual Numbers Input Sheet for Monthly Updates
Update once and let the dashboard do the work:
-
 Enter your actuals for the selected month
 -
 MTD and YTD figures adjust automatically
 -
 Easy-to-navigate structure, even for Excel beginners
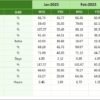
Target Sheet to Define Your Goals
Set the path for success by entering your benchmarks:
-
 MTD and YTD targets for every KPI
 -
Monthly planning with long-term alignment
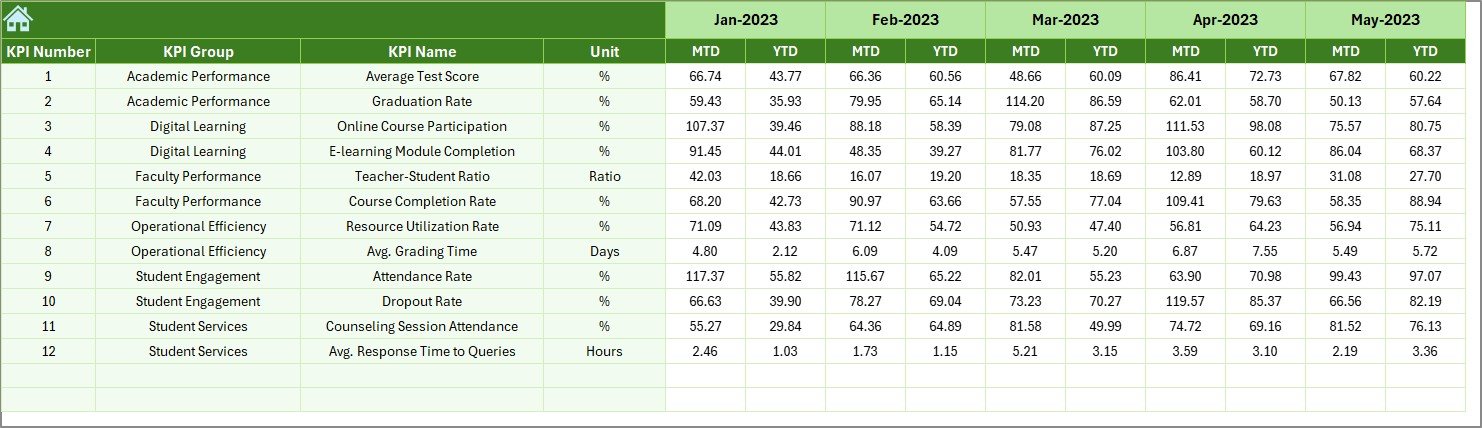
 Previous Year Number Sheet for Growth Analysis
Easily compare this year’s results with last year’s:
-
View year-over-year progress
-
Assess which KPIs improved, and which need attention
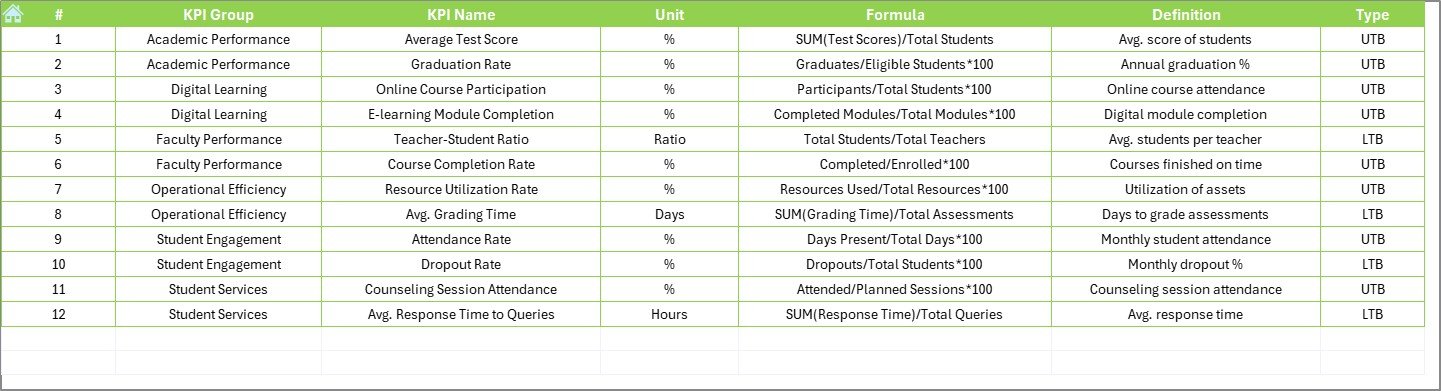
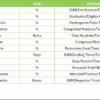
KPI Definition Sheet for Full Clarity
Keep your team aligned with clear definitions:
-
 Define KPI names, categories, units, formulas, and relevance
 -
Prevent miscommunication with shared understanding
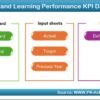
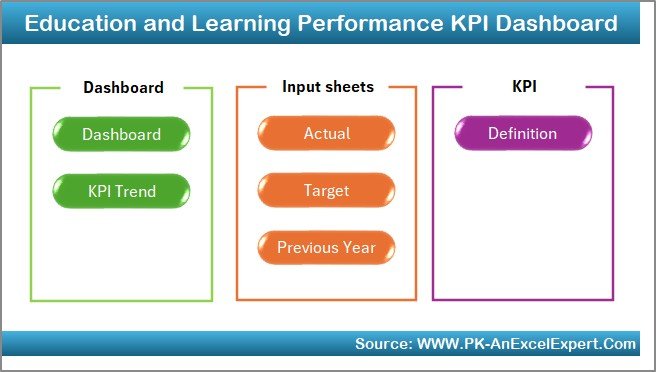
 What’s Inside the Dashboard?
-
7 fully automated worksheet tabs
-
Visual dashboard with slicers and conditional formatting
-
Data input and target sheets for monthly updates
-
Trend charts for KPI monitoring
-
Full KPI dictionary and editable fields
-
Previous year comparisons for long-term evaluation
-
 Customizable for any institution’s goals
 Who Can Benefit from This Product?
This Excel dashboard is perfect for:
-
 Schools and colleges tracking academic KPIs
 -
 Online learning platforms monitoring course engagement
 -
 Corporate training teams measuring learning effectiveness
 -
 Coaching institutes evaluating student performance
 -
Educational consultants needing data visualization tools
If education is your mission, this dashboard is your compass.
How to Use the Education KPI Dashboard
-
 Download and open the Excel file
 -
 Customize KPIs in the KPI Definition tab
 -
Input monthly Actuals and Targets
-
 Add last year’s numbers for comparison
 -
Review performance using the Dashboard and Trend tabs
-
 Share insights with team members or decision-makers
No technical skills needed — just data, dedication, and this template!
 Click here to read the Detailed blog post
 Visit our YouTube channel to learn step-by-step video tutorials


Reviews
There are no reviews yet.