


Running an e-commerce business means balancing multiple moving parts — from orders and deliveries to customer feedback and profitability. The E-Commerce Sales Performance Dashboard in Google Sheets is a ready-to-use, automated analytics tool that gives you a complete 360° view of your store’s performance — all within an intuitive and shareable Google Sheets workspace. 🛒📊
Designed for e-commerce managers, business owners, and analysts, this dashboard helps you track sales, monitor fulfillment efficiency, and analyze profitability trends in real time. With automated charts, interactive metrics, and flexible structure, it’s the perfect all-in-one solution to understand your business performance at a glance.

🔑 Key Features of the E-Commerce Sales Performance Dashboard in Google Sheets
📋 Dashboard Sheet Tab (Main Overview)
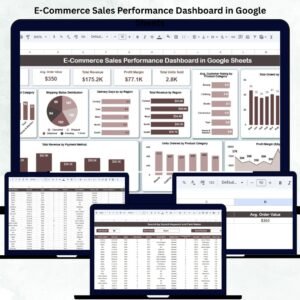
Your main control center — featuring live KPIs and charts that update automatically as data changes.
Key Performance Cards Include:
-
Total Orders: Count of all orders placed during the selected period.
-
Total Revenue: Tracks total sales earned.
-
Average Order Value (AOV): Revenue per order, calculated automatically.
-
Total Units Sold: Total number of items purchased.
-
Profit Margin: Highlights business profitability in %.
These cards give instant visibility into your e-commerce performance.
📈 Charts for Deep Analysis
Gain actionable insights from multiple pivot-based charts:
-
Total Orders by Product Category: Identify top-selling categories and plan inventory better.
-
Total Orders by Status: View orders by Pending, Shipped, Delivered, or Returned.
-
Delivery Days by Region: Compare logistics efficiency by geography.
-
Revenue by Region: Understand market potential and sales distribution.
-
Customer Ratings by Category: Track satisfaction levels and improvement areas.
-
Orders by Month: Identify trends, peaks, and seasonal patterns.
-
Profit Margin by Month: Visualize profitability over time.
-
Revenue by Payment Method: See how customers prefer to pay — Credit Card, UPI, PayPal, etc.
Every chart updates dynamically, making your analysis fast, reliable, and real-time.
🔍 Search Sheet Tab
Easily locate specific records without scrolling through thousands of rows.
You can search by:
-
Order ID
-
Product Name or Category
-
Customer Name
-
Region
-
Payment Method
-
Shipping Status
Perfect for audits, customer service, or quick lookups.
🧾 Data Sheet Tab
This is your data powerhouse — where all transactional records are stored.
It includes columns like:
Order ID | Customer Name | Product | Category | Quantity | Price | Revenue | Cost | Profit | Payment Method | Region | Shipping Status | Order Date
Simply paste your order data here, and the entire dashboard updates automatically.
⚙️ Support Sheet Tab
Contains dropdown sources (Product Categories, Regions, Payment Methods) for clean and standardized data entry — ensuring consistency and preventing input errors.
📦 What’s Inside the E-Commerce Sales Performance Dashboard
✅ Fully Automated Dashboard – KPIs, charts, and reports auto-update
✅ Real-Time Analytics – Track performance as data changes
✅ Smart Search Tab – Instantly find specific orders or customers
✅ Profitability Insights – Measure revenue, cost, and margins
✅ Regional & Product Breakdown – View trends by geography or category
✅ Visualized Reports – Pivot-based charts for deep insights
✅ Cloud Collaboration – Work seamlessly with your team
✅ No Coding Required – Built 100% in Google Sheets
🧑💼 Who Can Benefit from This Dashboard
🛍️ E-Commerce Entrepreneurs – Manage store performance and profits.
📦 Operations Managers – Track delivery efficiency and product turnover.
📈 Marketing Teams – Evaluate campaign effectiveness by region or category.
💼 Finance Analysts – Analyze profit margins and AOV trends.
Ideal for Shopify, WooCommerce, Amazon, or any online selling platform — this dashboard gives you full control over your sales insights.
🧪 How to Use the E-Commerce Sales Performance Dashboard
1️⃣ Enter Data: Copy your order and delivery data into the Data Sheet.
2️⃣ View Dashboard: All charts and KPIs update automatically.
3️⃣ Search Orders: Use the Search Tab to locate transactions quickly.
4️⃣ Analyze Trends: Review performance by region, product, or month.
5️⃣ Share Results: Export or collaborate live in Google Sheets.
💡 Pro Tip: Integrate with Google Forms or Apps Script to auto-import order data and generate weekly summaries!
🌟 Why Choose This Dashboard
-
Simple, visual, and easy to use
-
No software installation needed
-
Real-time team collaboration
-
Customizable and scalable
-
Provides actionable business insights
-
Boosts productivity and profitability
🔗 Click here to read the Detailed blog post
Watch the step-by-step video Demo:


Reviews
There are no reviews yet.