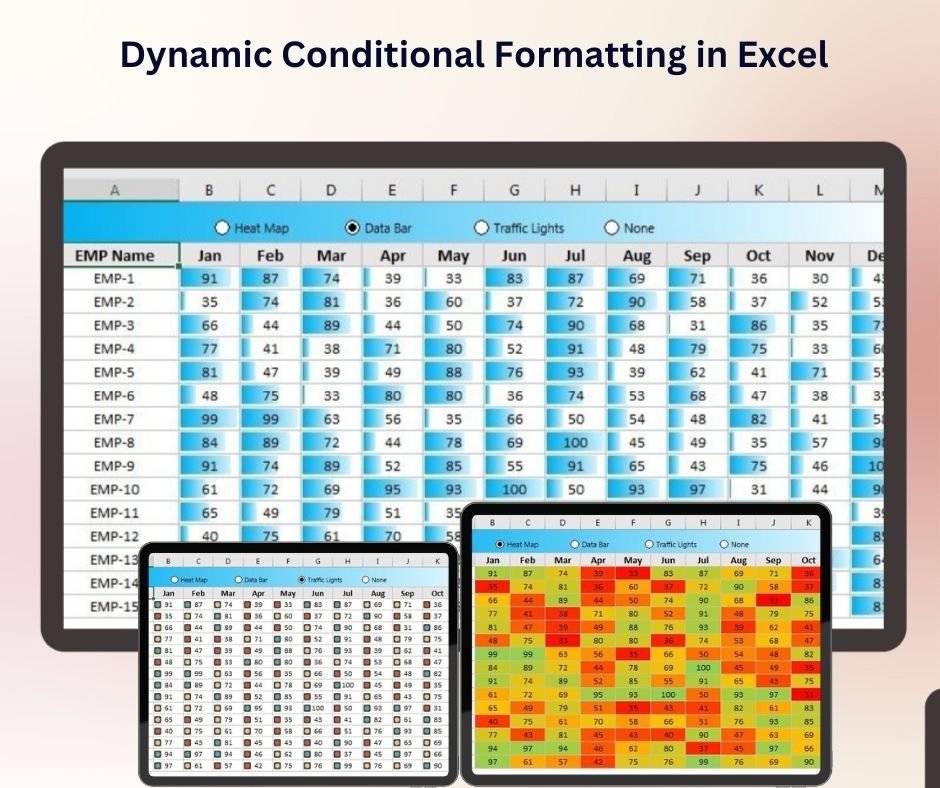
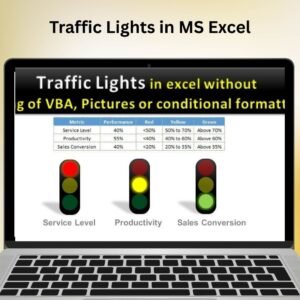
The Dynamic Conditional Formatting in Excel tool is a powerful feature that allows you to visually highlight important data trends and anomalies in your Excel spreadsheets. With this tool, you can apply different formatting styles to your data automatically, based on predefined rules, making it easier to track key metrics, monitor performance, and identify outliers in your data.
This Dynamic Conditional Formatting template enhances your Excel experience by providing an intuitive, easy-to-apply solution for making your data more visually engaging. Whether you’re tracking sales performance, project progress, or financial analysis, this tool allows you to highlight significant data points such as higher values, trends, or areas requiring attention, enabling you to make quick, data-driven decisions.
Key Features of Dynamic Conditional Formatting in Excel
📌 Highlight Key Data Automatically
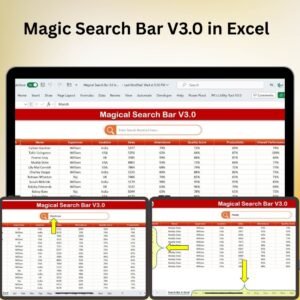
Automatically format your data based on specific rules that highlight key values, such as the highest or lowest values, positive or negative trends, and specific thresholds. This visual cue helps you to quickly spot important data points without having to sift through rows and columns.
🛠 Customizable Formatting Rules
Create custom rules for conditional formatting based on your data. Whether you need to highlight specific numbers, text, or dates, the tool offers full flexibility to set up rules that meet your requirements, such as highlighting overdue tasks, high sales figures, or low stock levels.
💡 Real-Time Data Updates
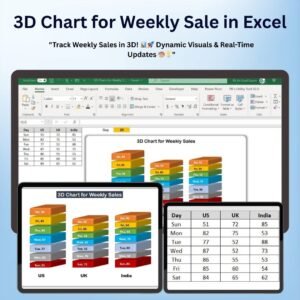
As your data changes, the conditional formatting automatically updates in real-time, providing immediate visual feedback. This ensures that your Excel sheet reflects the most up-to-date information without manual intervention.
🔢 Easy-to-Use Interface
The Dynamic Conditional Formatting feature is designed with simplicity in mind. With a user-friendly interface, applying complex formatting rules is made simple, even for Excel beginners. You’ll be able to set up and apply dynamic formatting with just a few clicks.
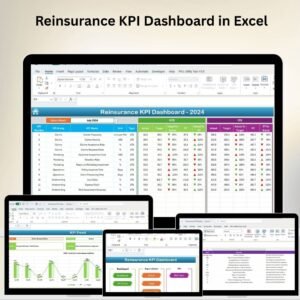
🚀 Interactive Dashboard Ready
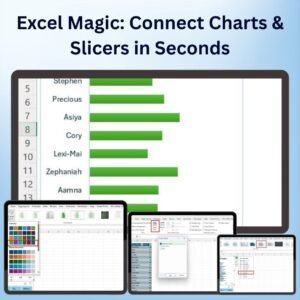
This tool can be easily incorporated into your dashboards, reports, and performance tracking systems. The dynamic formatting adds visual appeal and helps viewers interpret your data quickly, enhancing the overall effectiveness of your presentation.
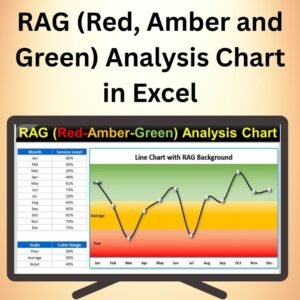
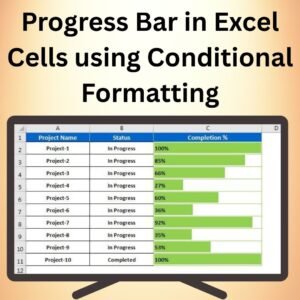
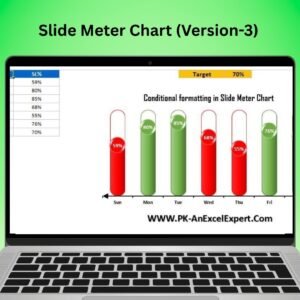
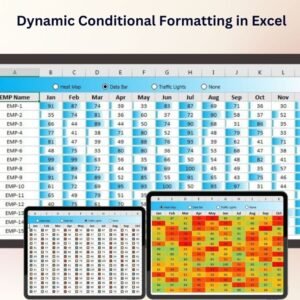
📊 Range of Visual Options
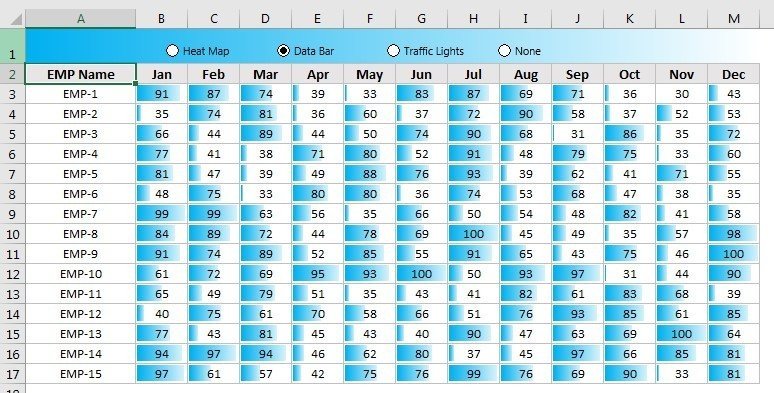
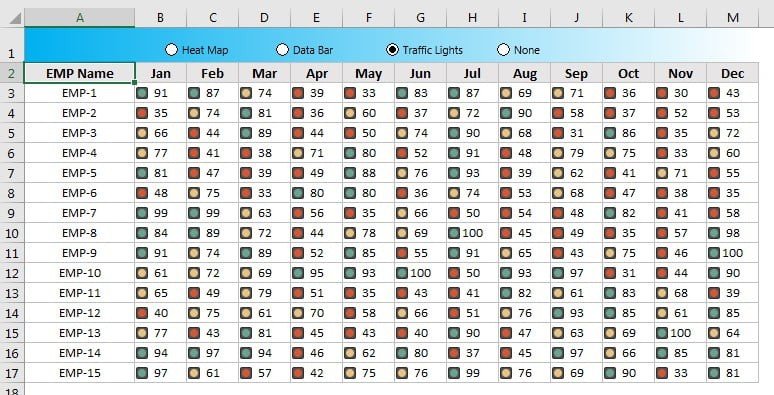
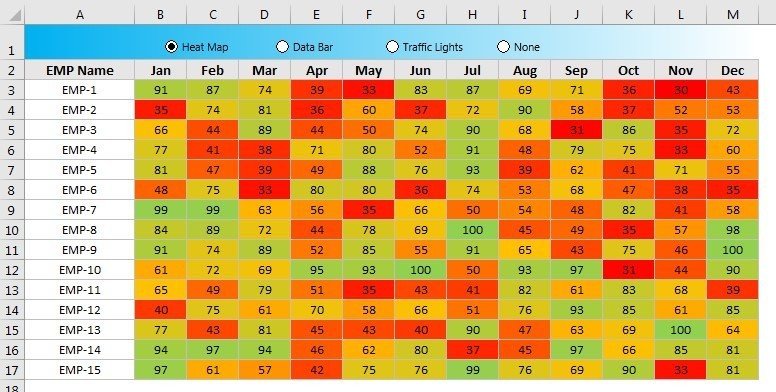
Choose from various formatting styles, such as color scales, icon sets, data bars, and custom fonts, to make your data easy to interpret and visually appealing. You can adjust the style and colors to suit your reporting needs and make your data stand out.
⚙ Advanced Rule Management
With this tool, you can manage and edit multiple conditional formatting rules with ease. This gives you full control over how your data is displayed and allows you to quickly modify or remove rules as needed.
🚀 Why You’ll Love Dynamic Conditional Formatting in Excel
✅ Automated Data Highlighting – Automatically highlight key data points based on your rules. ✅ Customizable Formatting – Tailor the formatting rules to fit your data and goals. ✅ Real-Time Data Updates – See instant visual feedback as data changes. ✅ User-Friendly Setup – Easily apply and modify rules with a simple interface. ✅ Perfect for Dashboards – Add visually appealing conditional formatting to your reports and dashboards. ✅ Wide Range of Visual Options – Use color scales, icon sets, and data bars to enhance data interpretation.
📂 What’s Inside Dynamic Conditional Formatting in Excel?
- Customizable Rules: Create your own rules for data highlighting.
- Real-Time Updates: Automatically adjust formatting as data changes.
- Multiple Visual Styles: Use color scales, icons, data bars, and more.
- Step-by-Step Setup Instructions: Clear instructions for setting up and applying dynamic formatting.
🔍 How to Use Dynamic Conditional Formatting in Excel
1️⃣ Download the Template – Instant access to the Excel file upon purchase. 2️⃣ Apply Your Data – Enter your data into the sheet. 3️⃣ Set Custom Rules – Define your conditional formatting rules based on your needs (e.g., color scales, data bars). 4️⃣ Monitor Performance – Watch as the formatting automatically updates as your data changes. 5️⃣ Analyze and Interpret – Use the highlighted data to identify key trends and insights.
🎯 Who Can Benefit from Dynamic Conditional Formatting in Excel? 🔹 Business Analysts
🔹 Project Managers
🔹 Financial Analysts
🔹 HR Managers
🔹 Sales Teams
🔹 Anyone looking to make their data more visually insightful and easier to interpret
The Dynamic Conditional Formatting in Excel tool helps you turn your raw data into a visually engaging and insightful report, making it easier to track performance, spot trends, and take action quickly.
Click here to read the Detailed blog post
https://www.pk-anexcelexpert.com/dynamic-conditional-formatting-in-excel/


Reviews
There are no reviews yet.