
The Diversity and Inclusion KPI Dashboard in Excel is a vital tool for organizations seeking to track, analyze, and improve their diversity and inclusion (D&I) efforts. This customizable Excel dashboard helps HR teams, D&I managers, and corporate leaders measure key diversity metrics, set goals, and monitor progress in real-time.
With visual tracking, real-time data insights, and easy-to-understand reports, this dashboard simplifies the management of D&I initiatives. Whether you’re tracking gender diversity, racial diversity, or measuring inclusion efforts, this tool provides a centralized system to ensure that your diversity goals are being met, and your organization is making progress toward an inclusive and equitable workplace.
Key Features of the Diversity and Inclusion KPI Dashboard in Excel
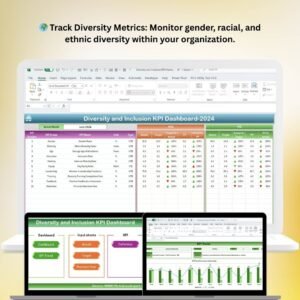
🌍 Track Diversity Metrics
Monitor a range of diversity-related KPIs, such as gender, race, and ethnicity, across your organization. This dashboard helps you measure representation at different levels, including management and leadership roles.
💼 Inclusion Efforts Monitoring
Track and measure the effectiveness of your inclusion programs and initiatives. Use metrics like employee satisfaction, inclusivity in hiring, and retention rates to assess the impact of your diversity and inclusion efforts.
📈 Progress Tracking & Goal Setting
Set specific D&I goals and track your organization’s progress toward achieving them. Use real-time data to monitor the success of your initiatives and make adjustments as needed.
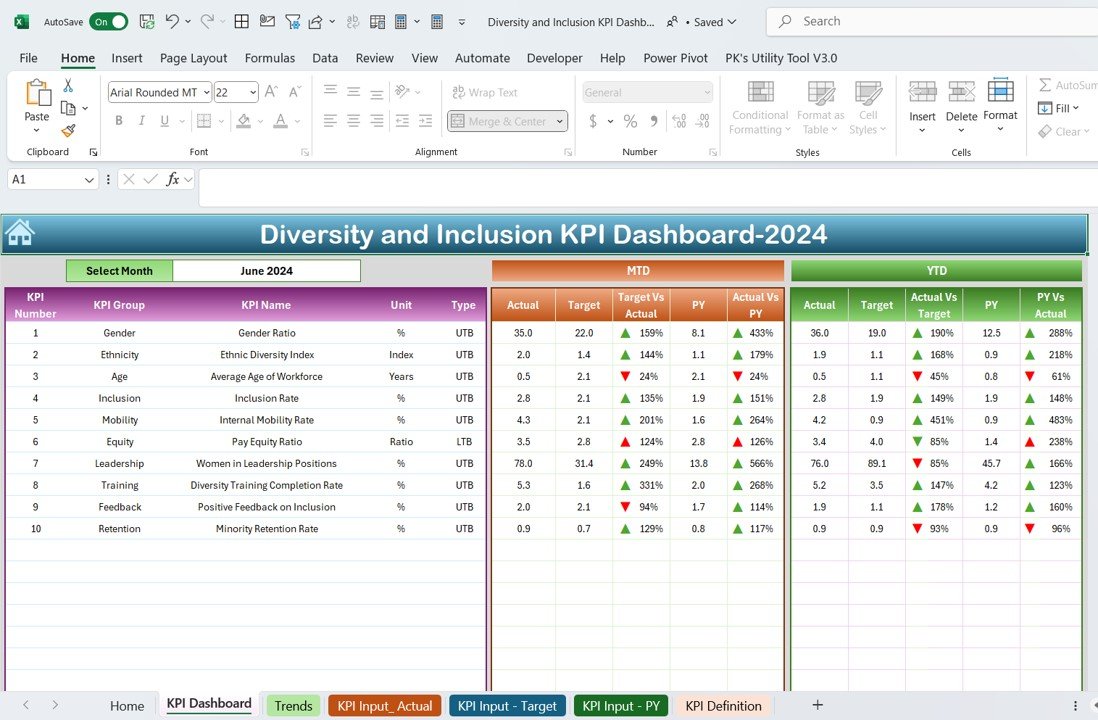
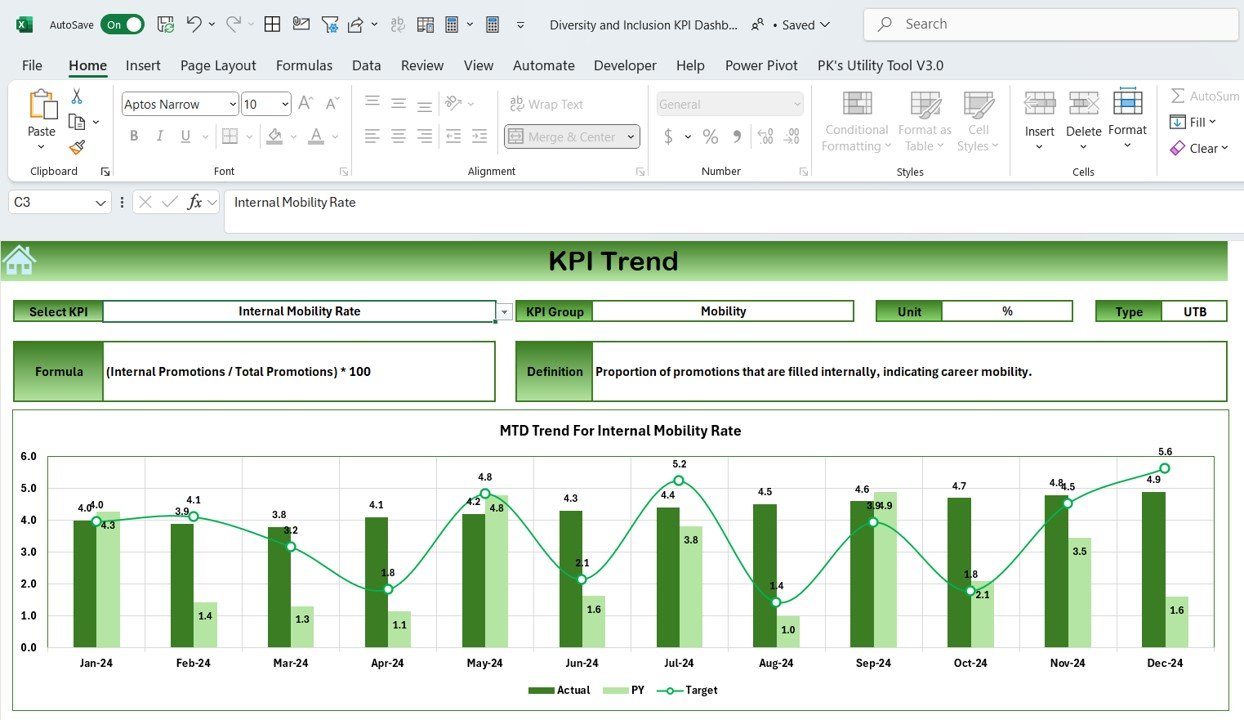
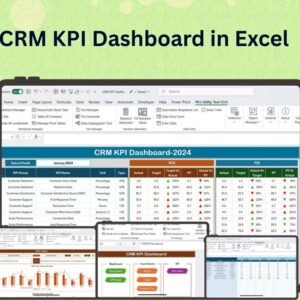
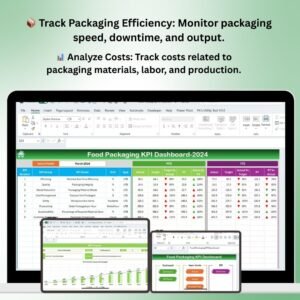
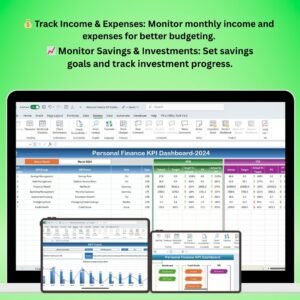
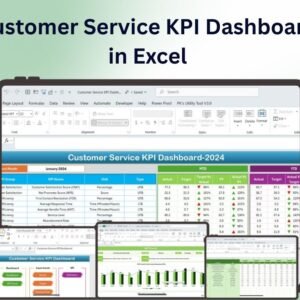
📊 Data Visualizations & Reports
The dashboard features easy-to-read charts and graphs, allowing you to visualize diversity trends and track progress at a glance. Generate reports to share with key stakeholders or for inclusion in board meetings.
📅 Customizable KPIs & Metrics
Adjust the dashboard to meet your organization’s unique D&I needs. Customize key performance indicators, reports, and metrics based on your diversity objectives and initiatives.
📝 Track Hiring & Retention Efforts
Monitor how diverse your hiring pool is and track the retention rates of employees from underrepresented groups. This feature helps identify areas that need more focus and improvement.
Why You’ll Love the Diversity and Inclusion KPI Dashboard in Excel

✅ Improve Organizational D&I
By tracking key metrics, this dashboard helps your organization actively monitor diversity and inclusion efforts, ensuring that initiatives are effective and that D&I goals are on track.
✅ Make Data-Driven Decisions
Gain insights into the diversity of your organization and use real-time data to make informed decisions. This will enable you to implement better recruitment, retention, and inclusion strategies.
✅ Enhance Employee Experience
By focusing on diversity and inclusion, you improve the overall workplace culture and create a more welcoming environment for all employees, which can lead to better employee satisfaction and engagement.
✅ Monitor Progress & Achieve Goals
Set diversity and inclusion goals and track your organization’s progress toward achieving them. Stay motivated by seeing the tangible results of your efforts.
✅ Customizable & Scalable
This dashboard is customizable to suit your organization’s unique needs. Whether you’re a small company or a large enterprise, it scales with your D&I efforts, allowing you to track diverse groups across various departments.
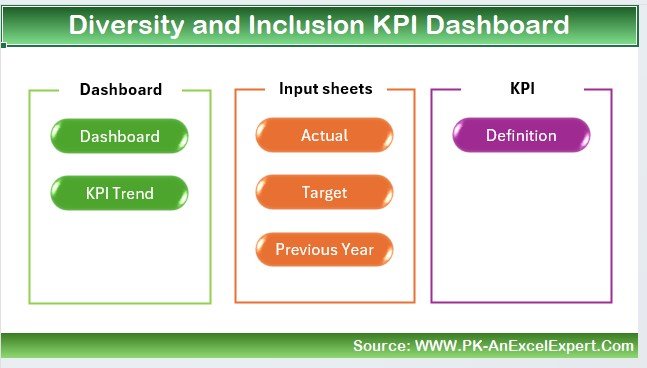
What’s Inside the Diversity and Inclusion KPI Dashboard Template in Excel?
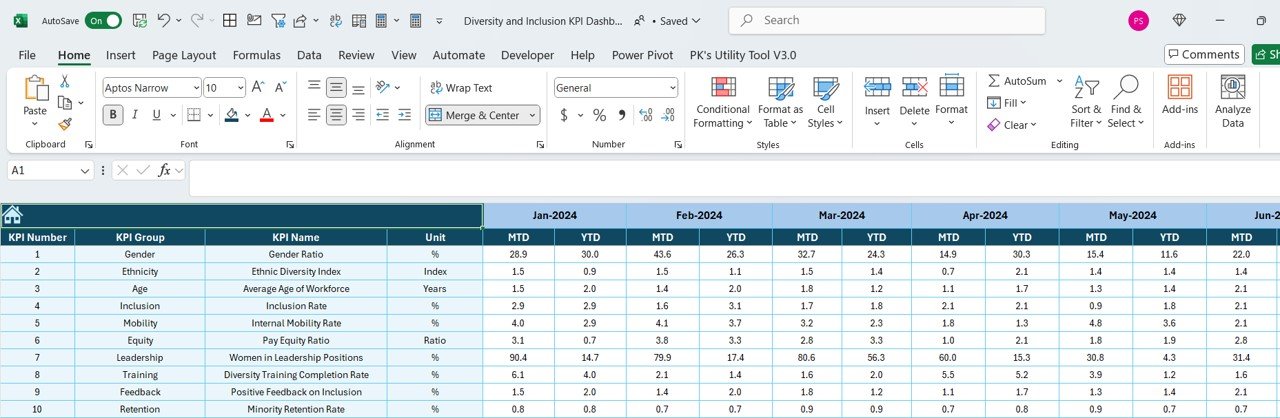
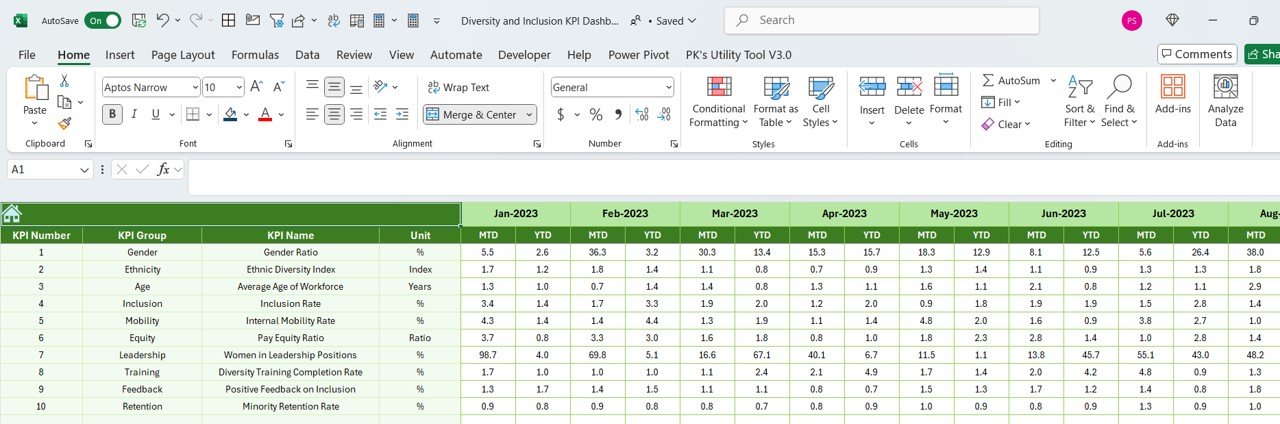
- Diversity Metrics Tracking: Track gender, racial, and ethnic diversity within your organization.
- Inclusion Program Metrics: Measure the impact of your inclusion programs on employee satisfaction and engagement.
- Progress Tracking & Goal Setting: Set and track your D&I goals with real-time data updates.
- Data Visualizations & Reporting: Use easy-to-read charts to track trends and generate reports.
- Hiring & Retention Insights: Track diverse hiring practices and monitor retention rates.
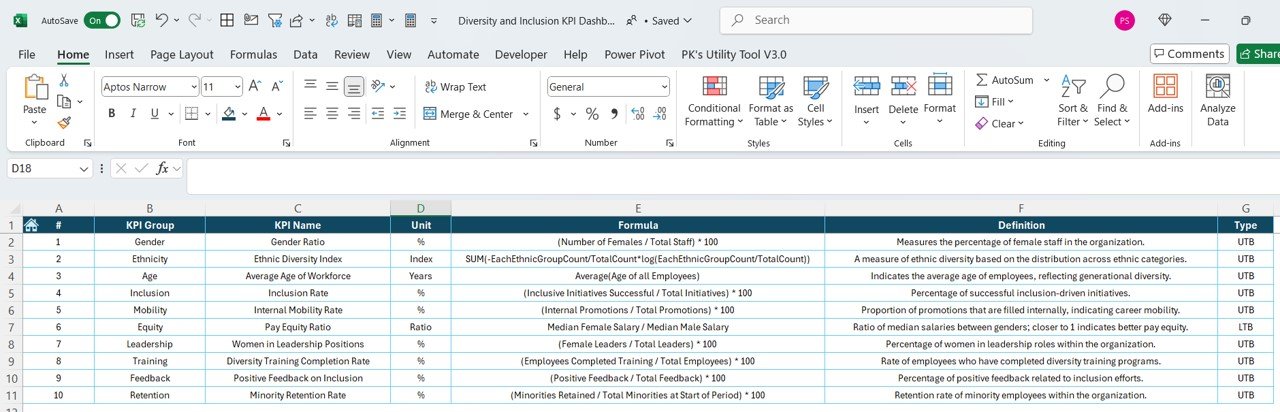
- Customizable KPIs: Adjust the dashboard to reflect the specific D&I metrics that matter most to your organization.
How to Use the Diversity and Inclusion KPI Dashboard in Excel
1️⃣ Download the Template: Gain immediate access to the Diversity and Inclusion KPI Dashboard in Excel.
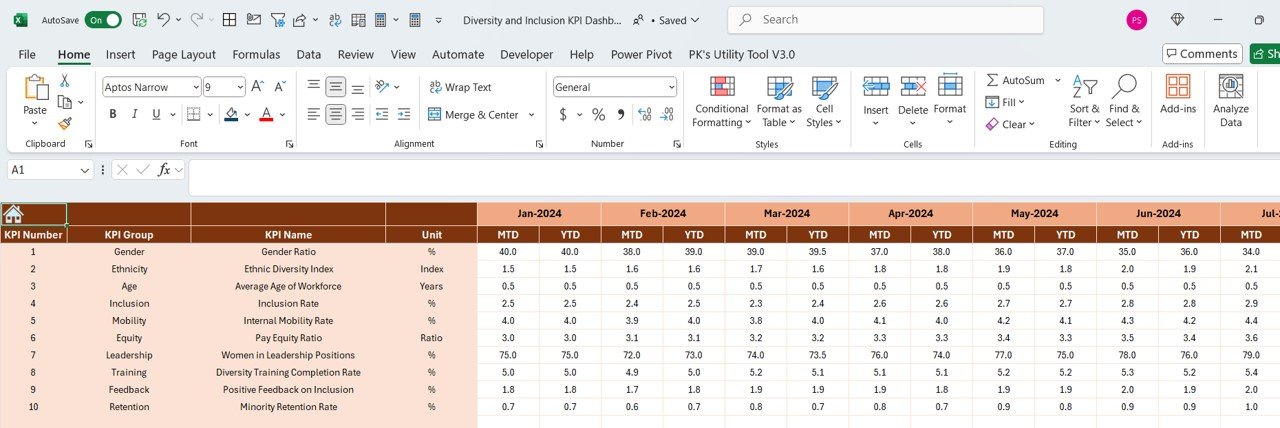
2️⃣ Input Your D&I Data: Enter your organization’s diversity metrics and employee data.
3️⃣ Track & Measure KPIs: Monitor key performance indicators such as gender, race, and employee satisfaction.
4️⃣ Set D&I Goals & Monitor Progress: Define your diversity and inclusion goals and track progress in real time.
5️⃣ Generate Reports & Share Insights: Use charts and graphs to visualize trends and create reports to share with stakeholders.
Who Can Benefit from the Diversity and Inclusion KPI Dashboard in Excel?
🔹 HR & D&I Managers
🔹 Corporate Leaders & Executives
🔹 Diversity Advocates & Consultants
🔹 Recruitment & Hiring Teams
🔹 Employee Engagement & Satisfaction Teams
🔹 Non-Profit Organizations Focused on D&I
Ensure that your organization stays committed to diversity and inclusion with the Diversity and Inclusion KPI Dashboard in Excel. Track key metrics, set actionable goals, and make data-driven decisions to create a more inclusive and diverse workplace.
Click here to read the Detailed blog post
Visit our YouTube channel to learn step-by-step video tutorials
Youtube.com/@PKAnExcelExpert


Reviews
There are no reviews yet.