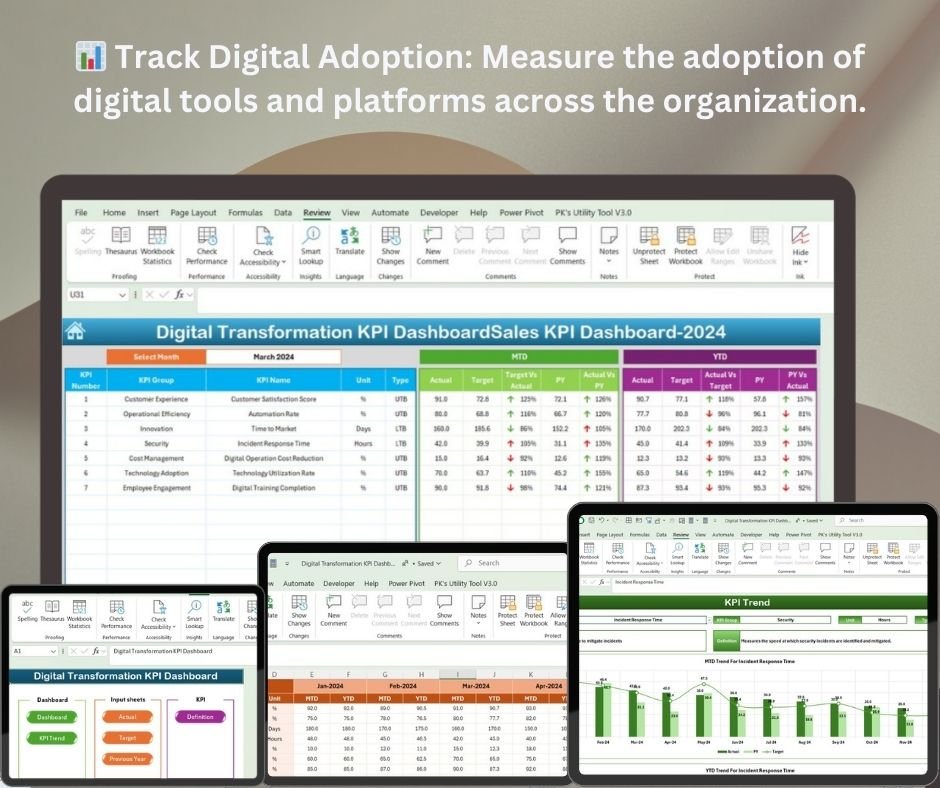
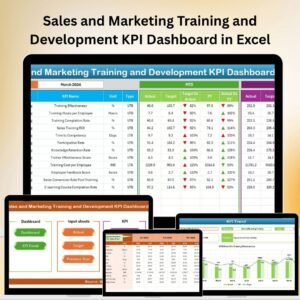
The Digital Transformation KPI Dashboard in Excel is a comprehensive tool designed to help businesses monitor and measure their digital transformation journey. This interactive Excel-based dashboard tracks essential Key Performance Indicators (KPIs) related to digital adoption, innovation, customer experience, and operational efficiency. With this dashboard, organizations can track the success of their digital initiatives, optimize processes, and make data-driven decisions to drive growth and competitiveness.
Whether you’re transitioning to new technologies, implementing digital tools, or enhancing customer experiences, the Digital Transformation KPI Dashboard in Excel provides valuable insights to assess the effectiveness of your digital strategies. It helps you ensure that your digital transformation aligns with business goals, improves efficiency, and maximizes ROI.
Key Features of the Digital Transformation KPI Dashboard in Excel
📊 Track Digital Adoption & Innovation
Monitor the adoption of digital tools, platforms, and technologies across your organization. Track progress on your digital initiatives and ensure that the company is moving towards a fully integrated digital model.
⚡ Customer Experience Monitoring
Measure key aspects of the customer experience, such as engagement, satisfaction, and retention, to ensure that digital tools are improving your customer service and relationships.
📈 Operational Efficiency Metrics
Track efficiency improvements in various departments, such as sales, marketing, and operations. Measure the impact of digital transformation on productivity, cost reduction, and process optimization.
💰 ROI & Financial Performance
Evaluate the financial success of your digital transformation efforts. Track ROI, revenue growth, and cost savings resulting from digital tools and strategies.
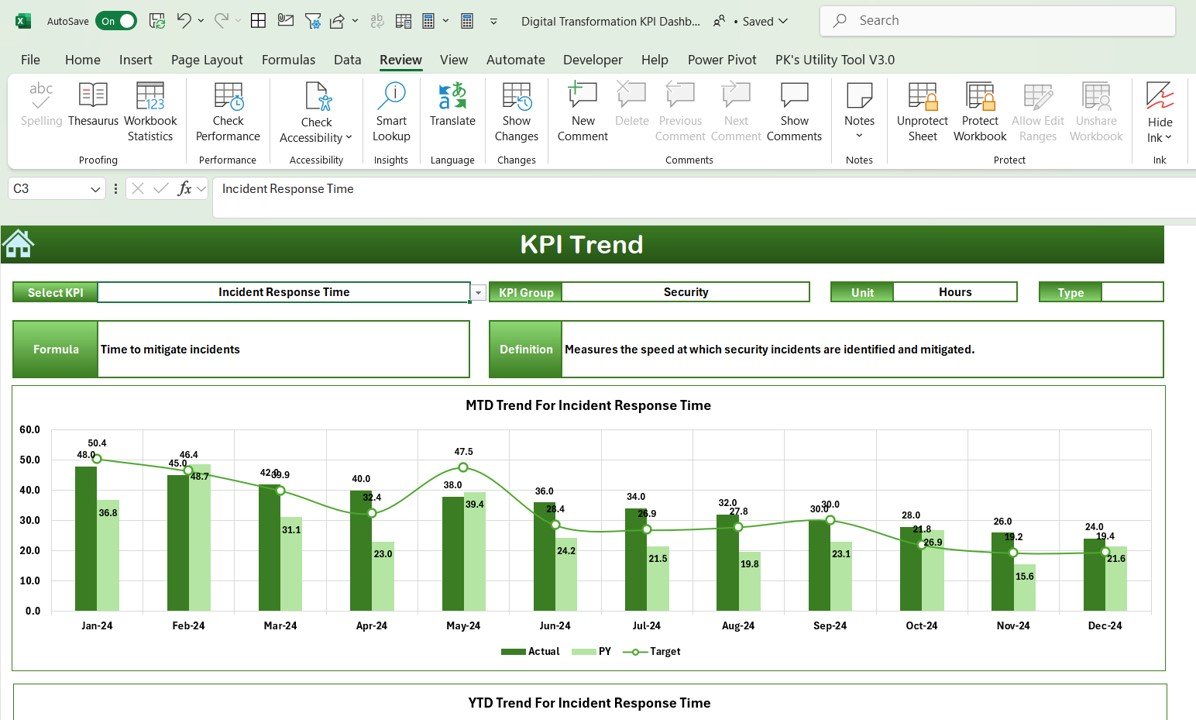
🖥️ Interactive & Real-Time Data Insights
With the Excel dashboard, gain real-time updates on all key digital transformation metrics. The dashboard provides dynamic charts, slicers, and filters for deep insights and quick decision-making.
Why You’ll Love the Digital Transformation KPI Dashboard in Excel
✅ Track Digital Adoption Progress
Measure how effectively digital tools are being adopted across your organization and track the success of your digital initiatives in real time.
✅ Optimize Customer Experience
Monitor customer satisfaction, engagement, and retention to ensure that your digital transformation is enhancing the customer experience.
✅ Measure Operational Efficiency Gains
Track the operational efficiency improvements driven by digital tools and strategies. Identify areas where processes can be further optimized to achieve greater productivity.
✅ Evaluate ROI & Financial Performance
Track the return on investment (ROI) from your digital initiatives. Measure the financial success of your transformation efforts, including cost savings and revenue growth.
✅ Make Data-Driven Transformation Decisions
Leverage real-time insights to make informed decisions about your digital transformation strategy. Optimize your efforts to stay ahead in an increasingly digital world.
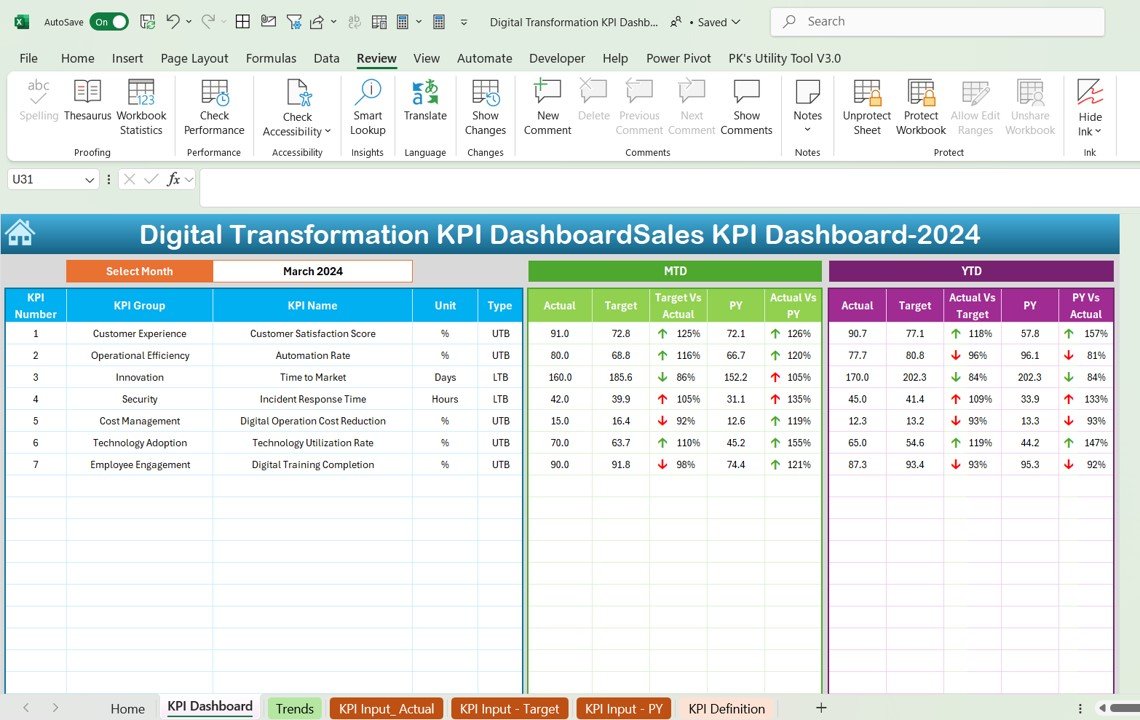
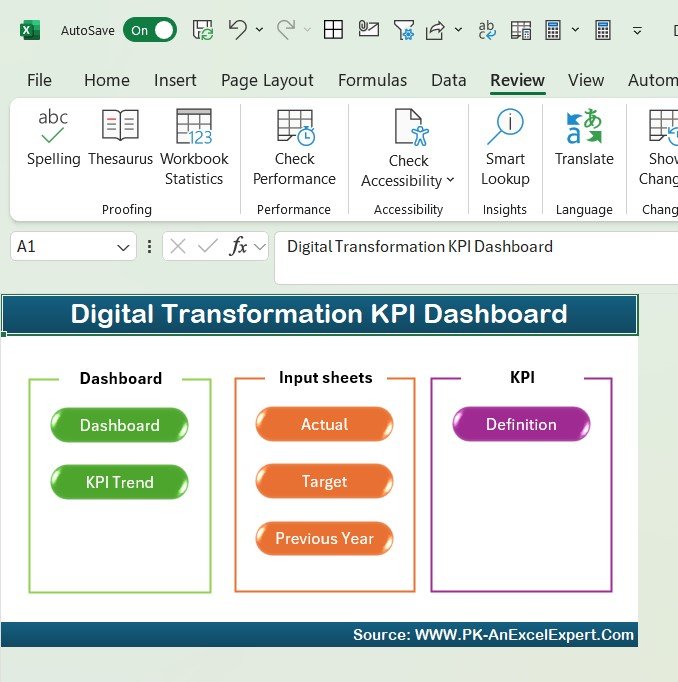
What’s Inside the Digital Transformation KPI Dashboard Template?
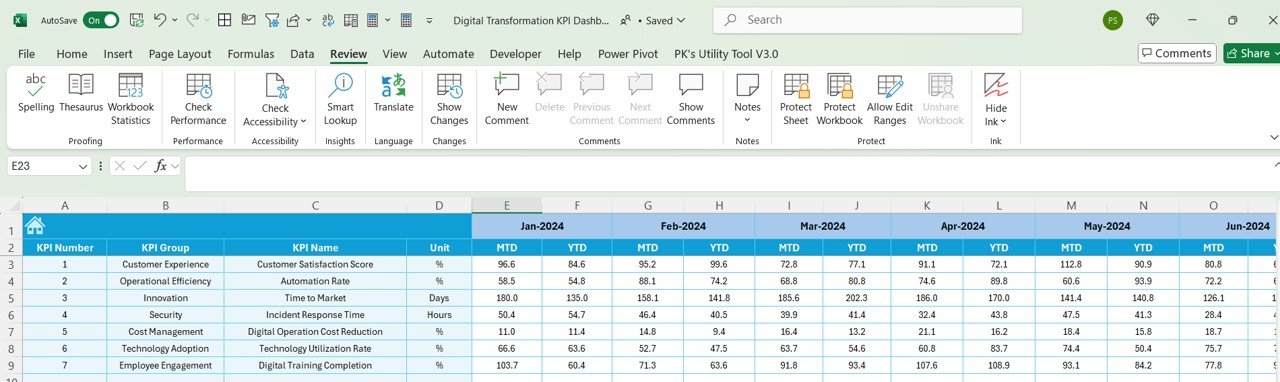
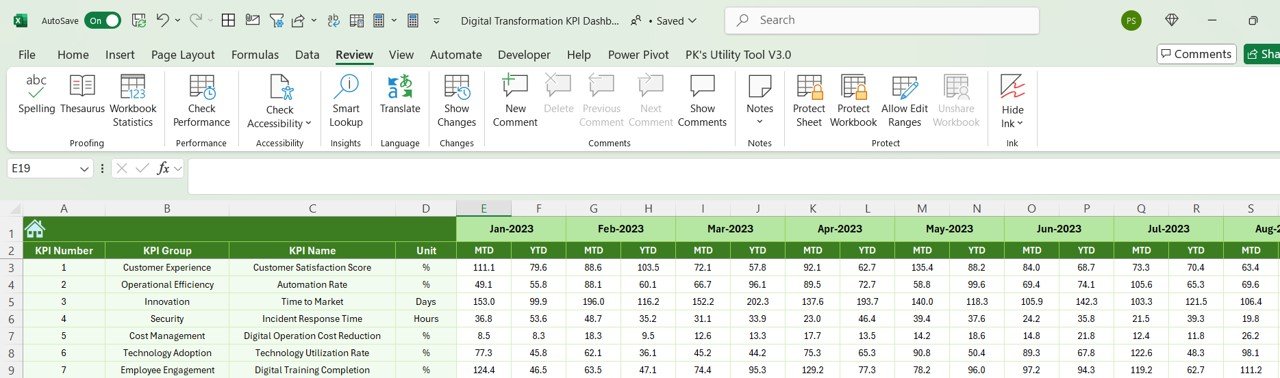
- Digital Adoption Tracking: Measure the adoption of digital tools and platforms within your organization.
- Customer Experience Metrics: Track key customer experience indicators such as satisfaction, engagement, and retention.
- Operational Efficiency KPIs: Monitor productivity, cost savings, and process optimization across departments.
- ROI & Financial Performance Tracking: Evaluate the financial success and ROI of your digital transformation efforts.
- Real-Time Data Insights: Access live data and insights that help optimize decision-making and strategy.
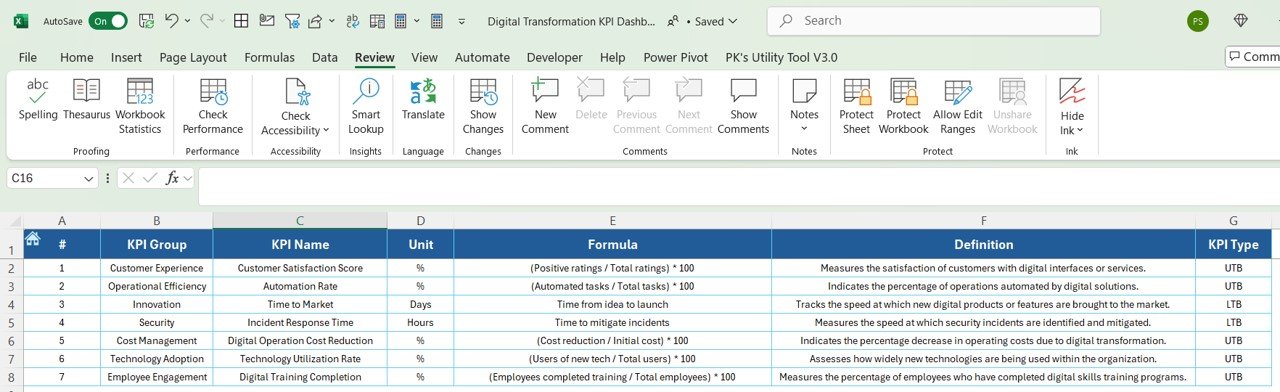
- Customizable KPIs: Adjust the dashboard to track the specific KPIs that matter most to your business.
How to Use the Digital Transformation KPI Dashboard in Excel
1️⃣ Download the Template: Get instant access to your Digital Transformation KPI Dashboard in Excel.
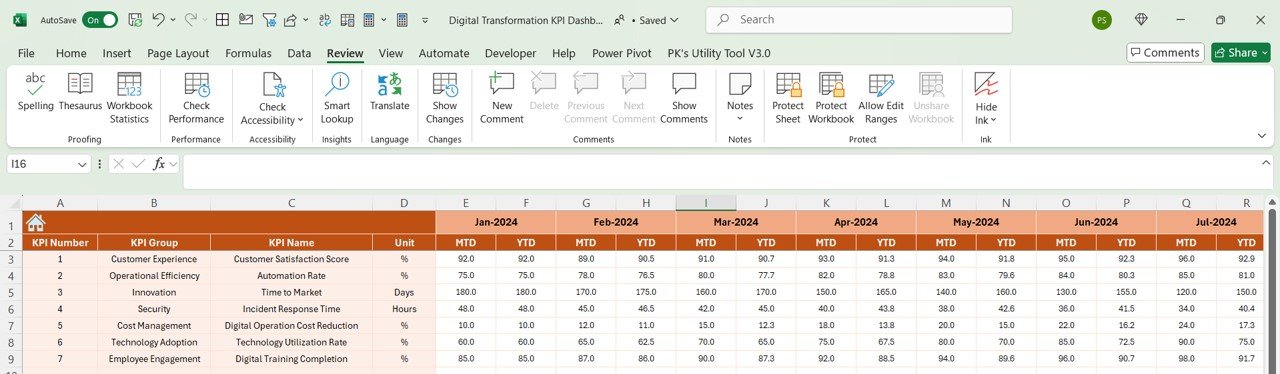
2️⃣ Input Your Data: Enter your digital adoption, customer experience, efficiency, and financial data into the dashboard.
3️⃣ Track & Monitor KPIs: Use the dashboard to track real-time performance across all aspects of your digital transformation.
4️⃣ Analyze & Optimize: Use the insights provided by the dashboard to optimize digital strategies, improve efficiency, and enhance customer experience.
Who Can Benefit from the Digital Transformation KPI Dashboard in Excel?
🔹 Digital Transformation Leaders & Consultants
🔹 Chief Technology Officers (CTOs)
🔹 Marketing & Customer Experience Managers
🔹 Business Analysts & Operations Managers
🔹 Entrepreneurs & Business Owners Implementing Digital Change
🔹 Anyone Leading or Managing Digital Transformation in an Organization
Ensure that your digital transformation initiatives are on the right track with the Digital Transformation KPI Dashboard in Excel. Track adoption rates, optimize customer experiences, improve operational efficiency, and measure the ROI of your digital tools to maximize business growth.
Click here to read the Detailed blog post
Visit our YouTube channel to learn step-by-step video tutorials
Youtube.com/@PKAnExcelExpert


Reviews
There are no reviews yet.