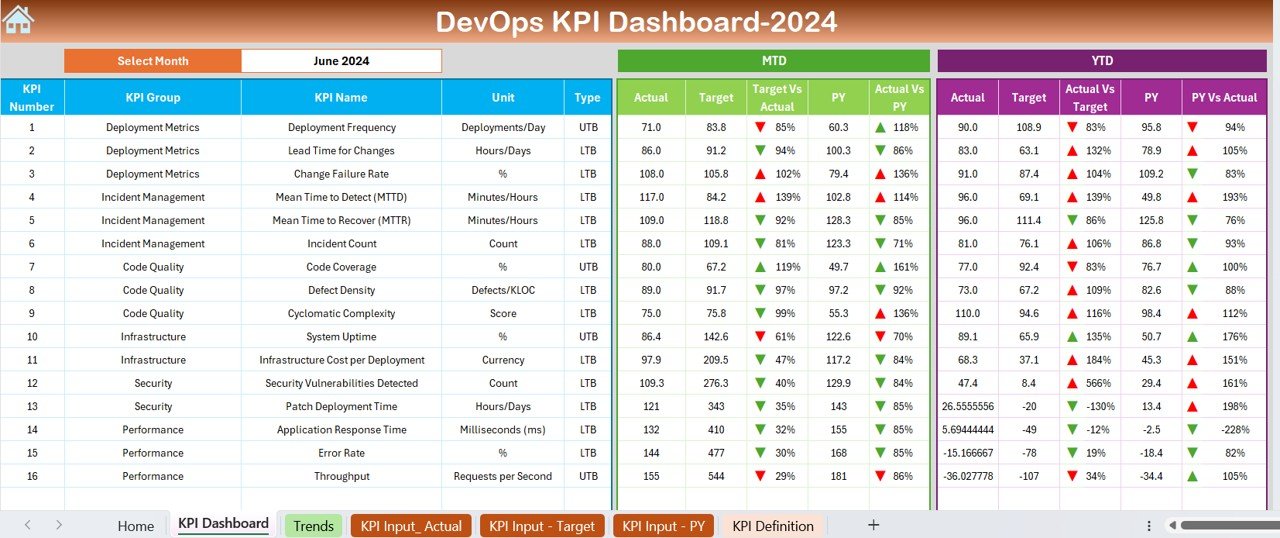
The DevOps KPI Dashboard in Excel is an essential tool for monitoring and improving the performance of DevOps teams. It provides clear insights into key performance indicators (KPIs) such as deployment frequency, lead time for changes, change failure rate, and mean time to recovery (MTTR). Designed for DevOps professionals, managers, and IT teams, this Excel-based dashboard helps track the efficiency and effectiveness of software delivery pipelines, ensuring continuous improvement and faster software releases.
This dashboard offers a structured way to track DevOps metrics, allowing teams to quickly identify bottlenecks, inefficiencies, and areas for improvement. With real-time data tracking and customizable KPIs, it supports organizations in optimizing their DevOps processes and aligning them with business goals.
Key Features of the DevOps KPI Dashboard in Excel
📊 Deployment Frequency Tracking
Monitor the frequency of deployments to production, providing insights into the speed of software delivery. Track how often new features, updates, and patches are deployed.
⏱ Lead Time for Changes
Track the time it takes from code commit to deployment in production. This metric helps in identifying inefficiencies in the development and deployment process and improving speed.
🔄 Change Failure Rate
Monitor the percentage of changes that result in failures or require remediation. This metric helps to assess the quality of deployments and the effectiveness of testing practices.
⚡ Mean Time to Recovery (MTTR)
Track how quickly the system recovers from incidents or failures. A low MTTR indicates effective issue resolution and recovery processes.
📈 Customizable KPIs & Metrics
Customize the dashboard to track additional DevOps KPIs based on your organization’s needs. Add metrics like system uptime, error rates, and customer satisfaction scores.
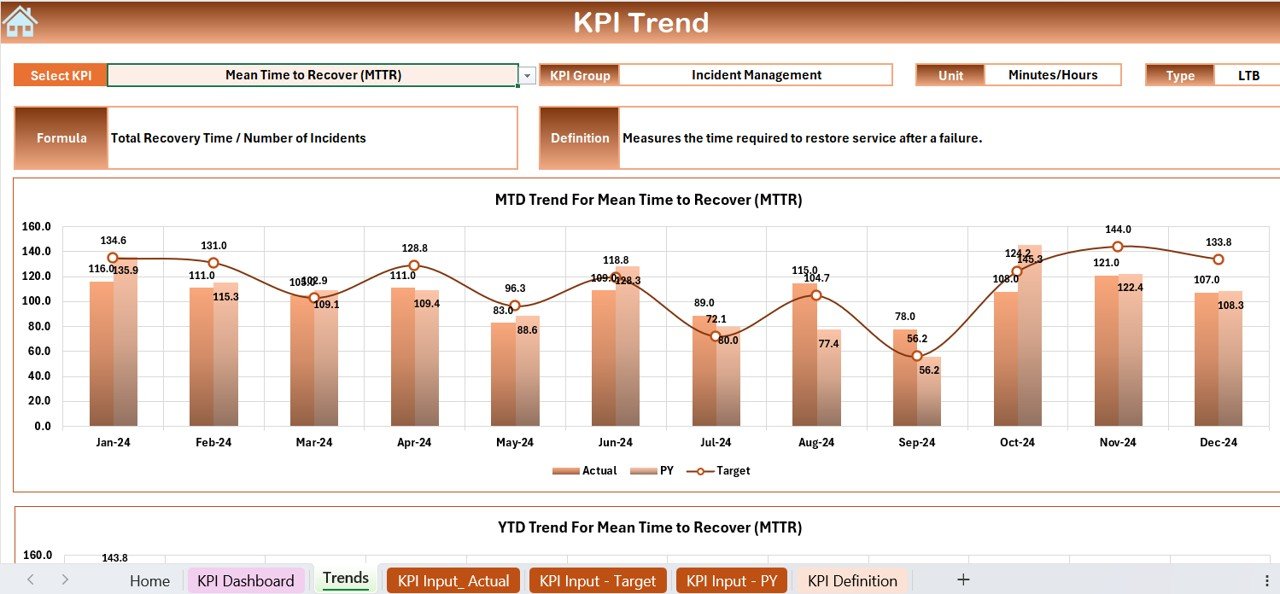
📅 Time-Based Reporting & Trends
Analyze performance over different time periods to identify trends in deployment frequency, lead time, and failure rates. This helps to make informed decisions for continuous improvement.
Why You’ll Love the DevOps KPI Dashboard in Excel

✅ Streamline Software Delivery
Monitor key metrics related to deployment frequency, lead time, and recovery to improve software delivery pipelines and speed up the development lifecycle.
✅ Improve Incident Response & Resolution
Track MTTR and change failure rates to identify issues quickly, ensuring faster recovery times and improving system stability.
✅ Enhance Continuous Improvement
Use the insights from the dashboard to continuously refine DevOps processes, identify bottlenecks, and enhance overall team productivity.
✅ Align DevOps with Business Goals
Measure and track the performance of your DevOps team to ensure that software delivery aligns with business objectives and customer expectations.
✅ Data-Driven Decisions
Make informed decisions based on real-time data from the dashboard to optimize your DevOps practices, increase efficiency, and reduce operational risks.
What’s Inside the DevOps KPI Dashboard in Excel?
-
Deployment Frequency: Monitor how often new code is deployed to production.
-
Lead Time for Changes: Track the time it takes to deploy new features or fixes.
-
Change Failure Rate: Monitor the percentage of changes that result in failure.
-
Mean Time to Recovery (MTTR): Track recovery times to improve incident resolution.
-
Customizable KPIs: Add your organization-specific DevOps metrics.
-
Time-Based Analysis: Analyze performance trends over different time periods.
How to Use the DevOps KPI Dashboard in Excel
1️⃣ Download the Template: Get instant access to the DevOps KPI Dashboard in Excel.
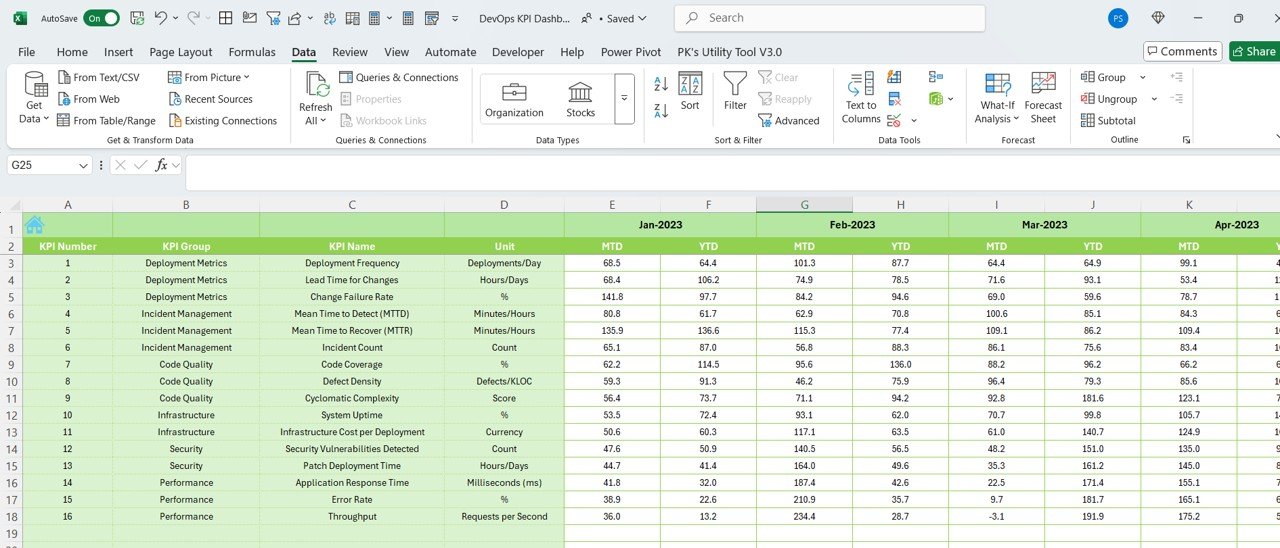
2️⃣ Integrate Your Data Sources: Connect your deployment and incident management data to the dashboard.
3️⃣ Track Key Metrics: Monitor KPIs such as deployment frequency, lead time, change failure rate, and MTTR.
4️⃣ Analyze Trends: Use time-based analysis to identify trends and areas for improvement.
5️⃣ Optimize Your DevOps Pipeline: Make data-driven decisions to streamline processes and improve software delivery.
Who Can Benefit from the DevOps KPI Dashboard in Excel?
🔹 DevOps Engineers & Managers
🔹 IT Operations & Development Teams
🔹 Continuous Integration/Continuous Delivery (CI/CD) Teams
🔹 IT Executives & Leadership
🔹 Agile & Lean Development Teams
🔹 Software Development Companies
🔹 IT Infrastructure Teams
Ensure that your DevOps teams are operating at peak efficiency with the DevOps KPI Dashboard in Excel. Track key metrics, improve software delivery speed, and optimize incident resolution with this easy-to-use tool.
Click here to read the Detailed blog post
Visit our YouTube channel to learn step-by-step video tutorials
Youtube.com/@PKAnExcelExpert











Reviews
There are no reviews yet.