


Department Stores Dashboard in a fast-paced, highly competitive retail environment. Every day, they generate massive volumes of data related to sales, customers, promotions, departments, regions, and operating costs. However, when this data remains scattered across spreadsheets and disconnected reports, valuable insights get lost. As a result, managers react late, costs rise, and profit opportunities slip away.
That is exactly why the Department Stores Dashboard in Power BI becomes a powerful and essential retail analytics solution 🚀.
This ready-to-use Power BI dashboard transforms raw retail data into clear, interactive, and actionable insights. Instead of manually consolidating reports, retail teams gain a centralized view of performance across sales channels, departments, customer types, promotions, and time periods. Because Power BI updates visuals dynamically, decision-makers can analyze trends instantly and act with confidence.
Whether your objective is improving profitability, optimizing promotions, controlling costs, or enhancing customer experience, this dashboard helps department stores move from reactive reporting to proactive retail management.
🔑 Key Features of Department Stores Dashboard in Power BI
📊 Centralized Retail Performance View – Monitor sales, costs, and profits from one dashboard
🎯 Interactive Slicers & Filters – Analyze data by store, region, department, customer type, promotion, and month
💰 Sales & Cost Visibility – Track net sales, gross sales, marketing cost, and operating cost clearly
📈 Department-Wise Analysis – Compare performance across retail departments
👥 Customer Segmentation Insights – Understand which customer types drive revenue
🎉 Promotion Effectiveness Tracking – Measure promotion impact on sales and profit
⚡ Real-Time Power BI Refresh – Always work with up-to-date retail data
🧩 Scalable & Flexible Design – Easily adapt KPIs and visuals as the business grows
📂 What’s Inside the Department Stores Dashboard in Power BI
This digital product includes five structured analytical pages, each designed to answer a specific retail business question:
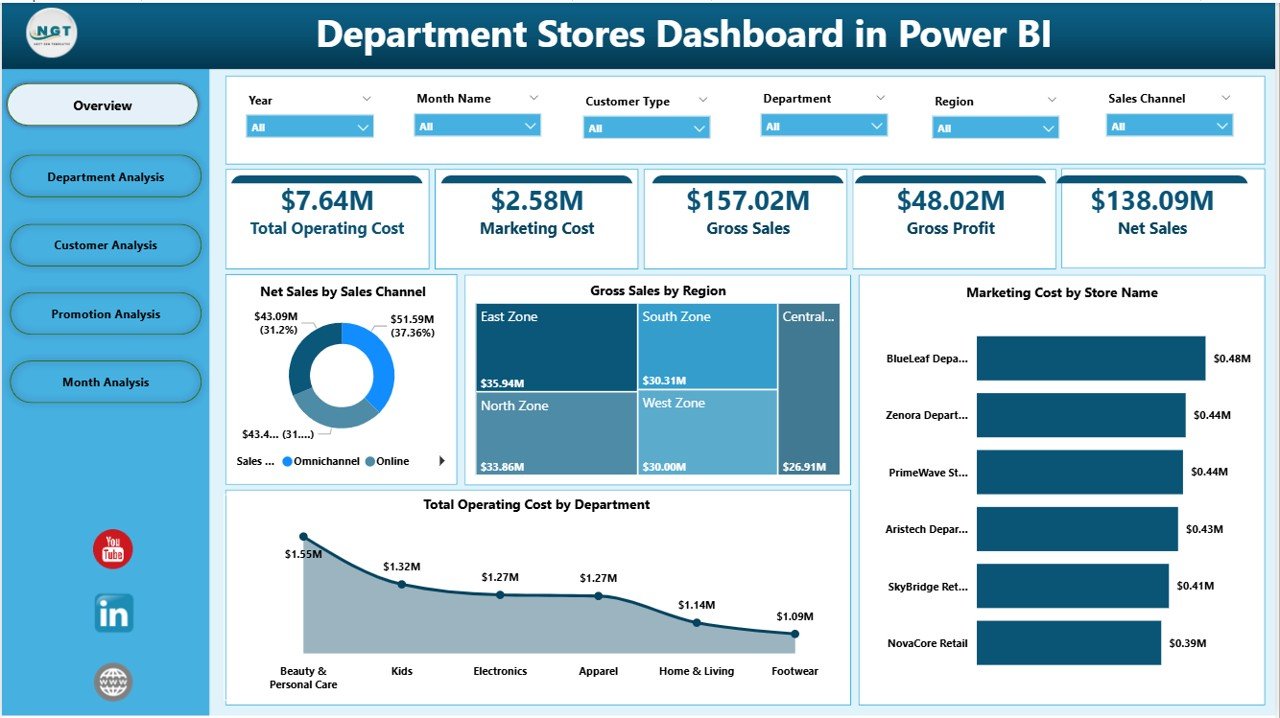
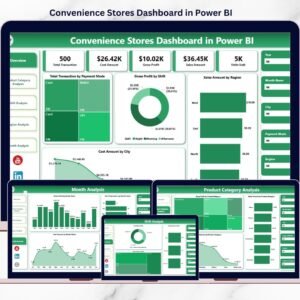
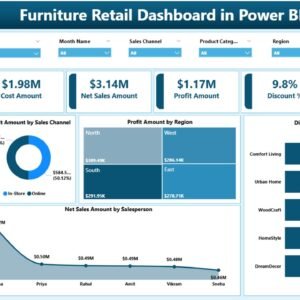
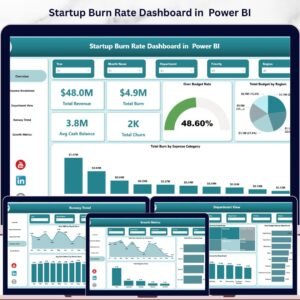
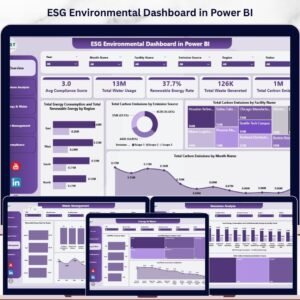
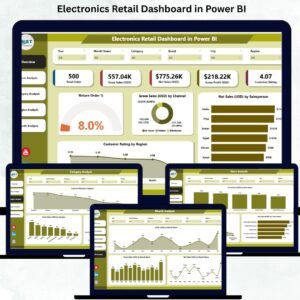
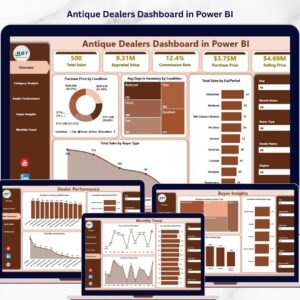
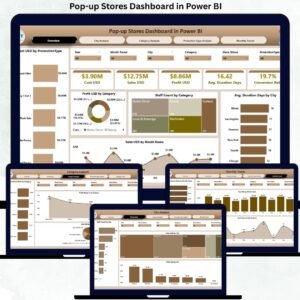
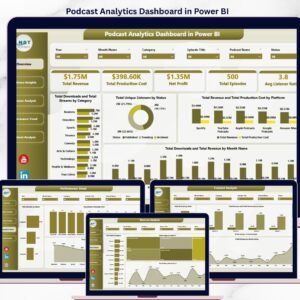
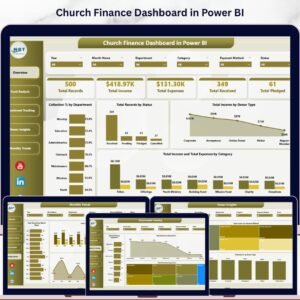
📌 Overview Page – Executive snapshot with KPI cards and charts for net sales, gross sales, marketing cost, and operating cost
📌 Department Analysis Page – Analyze utilities cost, gross sales, and marketing cost by department
📌 Customer Analysis Page – Compare net sales, gross sales, and marketing cost by customer type
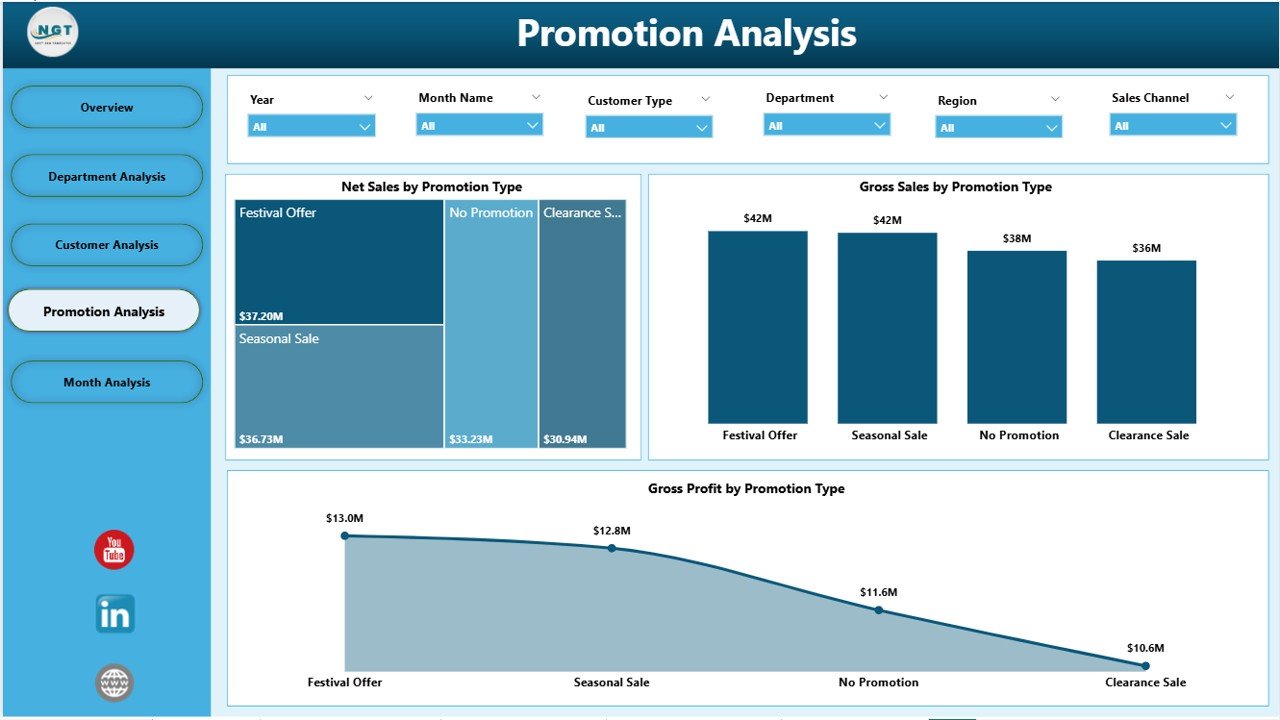
📌 Promotion Analysis Page – Evaluate net sales, gross sales, and gross profit by promotion type
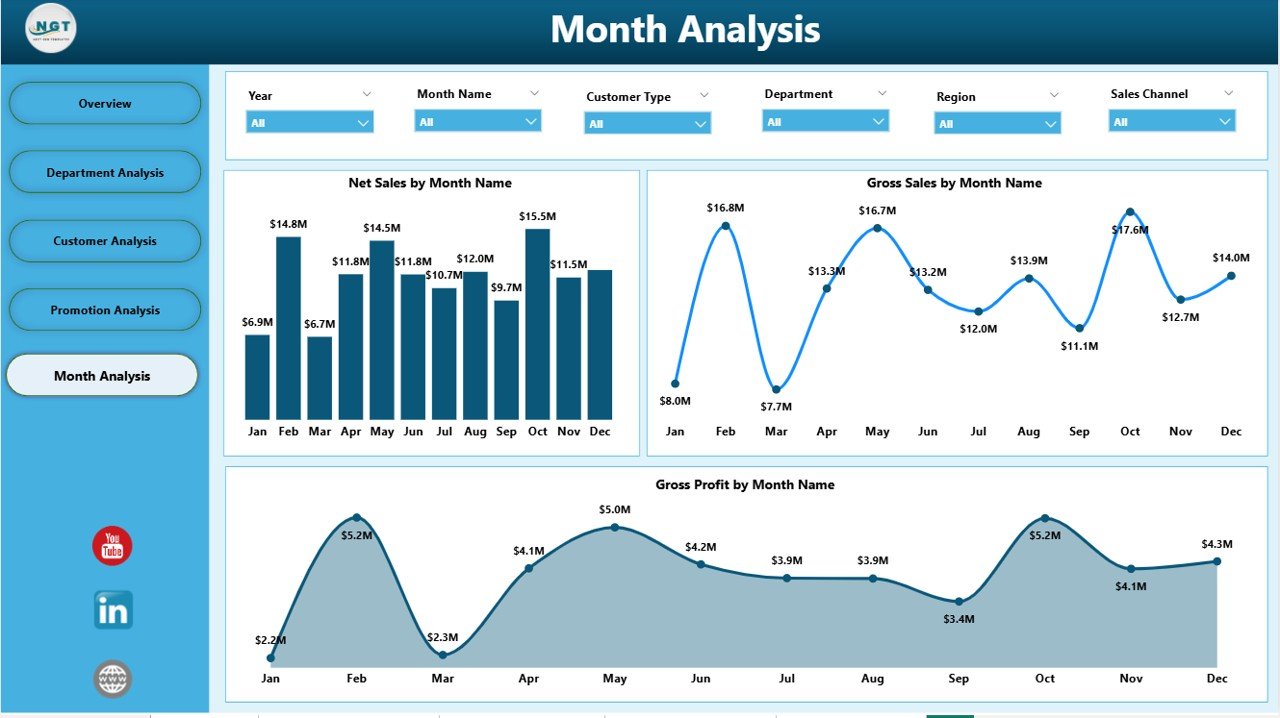
📌 Monthly Trends Page – Track net sales, gross sales, and gross profit trends over time
All pages are fully interactive and respond instantly to slicer selections.
🛠️ How to Use the Department Stores Dashboard in Power BI
Using this dashboard is simple and business-friendly:
1️⃣ Connect your retail data from Excel, ERP, or database sources
2️⃣ Refresh the Power BI dashboard
3️⃣ Use slicers to filter by store, region, department, customer type, promotion, or month
4️⃣ Start with the Overview Page for instant performance clarity
5️⃣ Drill into department, customer, or promotion analysis
6️⃣ Review monthly trends for forecasting and planning
7️⃣ Share insights with operations, finance, marketing, and leadership teams
No complex setup. No manual consolidation. Just fast, reliable retail insights.
👥 Who Can Benefit from This Department Stores Dashboard in Power BI
This dashboard is ideal for:
🏬 Store Managers – Monitor daily and monthly store performance
🌍 Regional Managers – Compare performance across regions and stores
💰 Finance Teams – Control operating and marketing costs
📢 Marketing Teams – Optimize promotions and customer targeting
📊 Retail Analysts – Identify trends and performance gaps
📈 Executives & Leadership – Make strategic, data-driven decisions
Because the dashboard is flexible, it works for single-store operations and large retail chains.
📘 Click here to read the detailed blog post
▶️ Visit our YouTube channel to learn step-by-step video tutorials


Reviews
There are no reviews yet.