


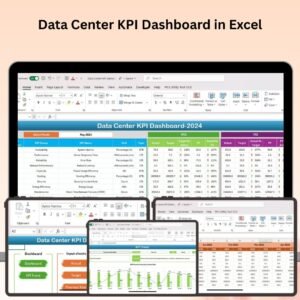
The Data Center KPI Dashboard in Excel is a powerful tool designed for IT managers, data center operators, and business owners who need to monitor, analyze, and optimize their data center operations. This Excel-based dashboard allows you to track key performance indicators (KPIs) such as uptime, energy efficiency, cooling efficiency, resource utilization, and operational costs, ensuring your data center runs efficiently and cost-effectively.
With real-time insights and customizable reports, this dashboard helps you stay on top of your data center’s performance, prevent downtime, improve energy usage, and enhance overall operational efficiency. Whether you are managing a small server room or a large enterprise data center, this tool ensures that you are constantly optimizing your resources.

Key Features of the Data Center KPI Dashboard in Excel:
💻 Comprehensive Performance Monitoring
Track critical KPIs like uptime, power usage effectiveness (PUE), cooling efficiency, resource utilization, and operational performance.
⚡ Energy Efficiency Tracking
Monitor energy consumption and efficiency with metrics such as PUE, which helps identify areas where energy usage can be reduced and operational costs optimized.
🌡 Cooling Efficiency
Keep an eye on cooling system performance to ensure that your data center remains within optimal temperature ranges, reducing the risk of overheating and system failures.
📊 Resource Utilization Analytics
Analyze server, storage, and network resource utilization to ensure that resources are being used efficiently and identify any underutilized assets.
💰 Cost and Budget Tracking
Track operational costs and compare them against budgeted figures to ensure that your data center is cost-efficient and within budget.
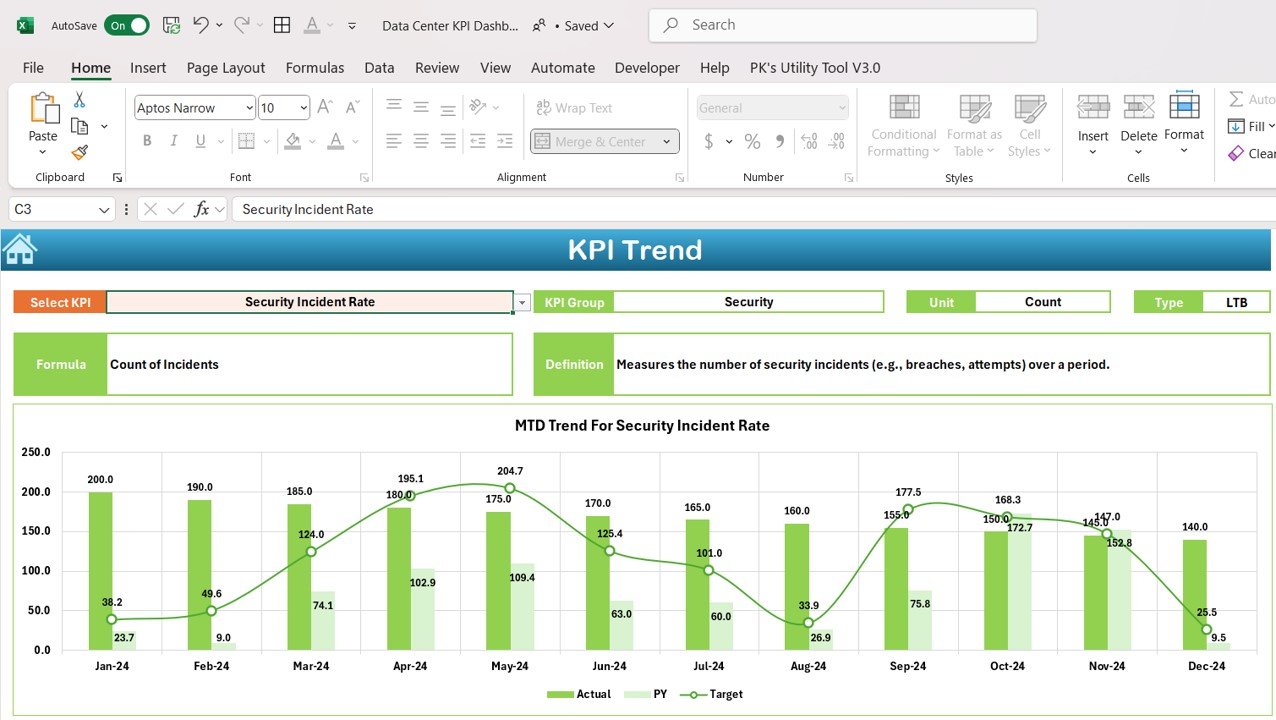
📅 Real-Time Reporting and Visualization
Use dynamic charts and graphs to visualize your data center’s performance in real-time, allowing you to identify trends and make data-driven decisions.
🚀 Why You’ll Love the Data Center KPI Dashboard in Excel:
✅ Monitor Data Center Performance – Track uptime, resource utilization, cooling efficiency, and other KPIs to ensure that your data center is running smoothly.
✅ Optimize Energy Usage – Identify areas for improvement in energy efficiency, helping you reduce costs and minimize environmental impact.
✅ Track Cooling Efficiency – Ensure that your data center’s cooling systems are operating at peak efficiency, preventing overheating and maximizing equipment lifespan.
✅ Improve Resource Allocation – Analyze server, storage, and network resource usage to ensure that your data center’s assets are being used efficiently.
✅ Stay Within Budget – Monitor costs and compare actual performance to budgeted figures to ensure that your data center operations stay within financial limits.
✅ User-Friendly and Customizable – The Excel dashboard is easy to use, and you can customize it to fit the unique needs of your data center.
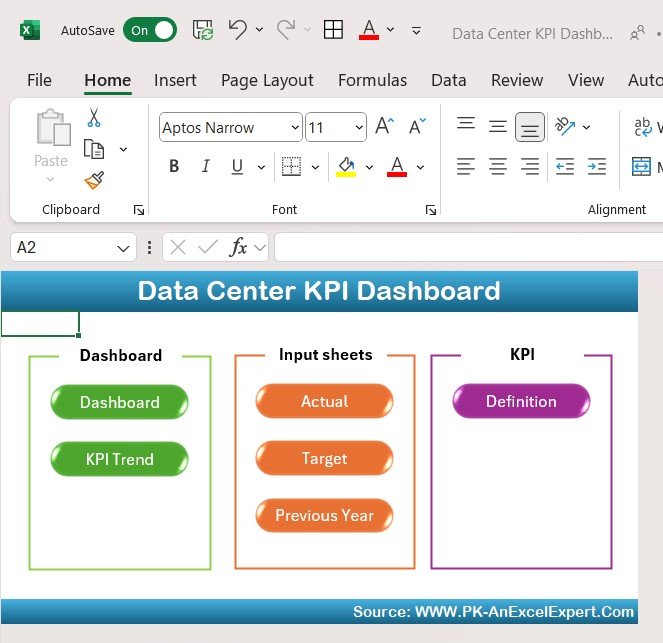
What’s Inside the Data Center KPI Dashboard in Excel:
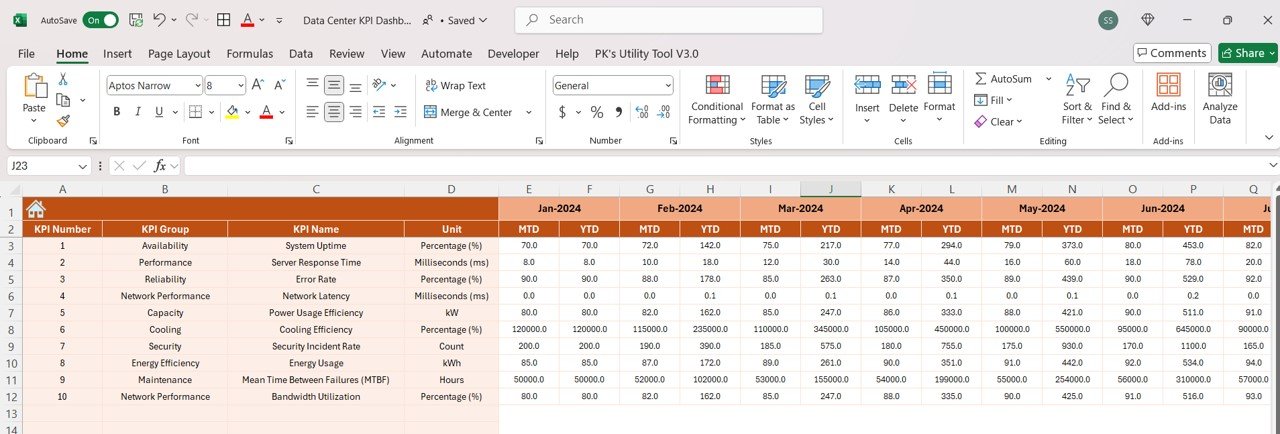
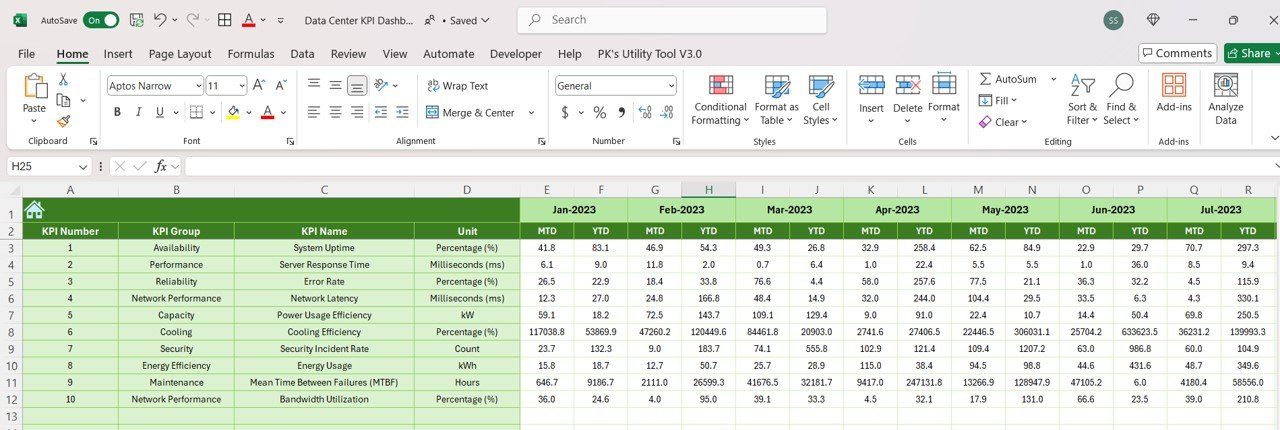
- Performance Metrics: Track uptime, PUE, cooling efficiency, and resource utilization to monitor the overall performance of your data center.
- Energy Efficiency Tracker: Monitor energy consumption and PUE to improve energy efficiency and reduce costs.
- Cooling Efficiency Monitoring: Keep track of temperature levels, cooling performance, and system health to ensure optimal conditions for your equipment.
- Resource Utilization Analytics: Track and analyze server, storage, and network resource usage to ensure efficient utilization and reduce waste.
- Cost and Budget Management: Track operational expenses, compare them with the budget, and analyze cost efficiency across different departments.
- Real-Time Dashboards: Visualize data center performance with dynamic charts and graphs that update in real-time, helping you quickly identify performance gaps and areas for improvement.
How to Use the Data Center KPI Dashboard in Excel:
1️⃣ Download the Template – Instantly access your Excel file upon purchase.
2️⃣ Enter Data Center Metrics – Input key metrics such as uptime, resource utilization, energy consumption, and cooling efficiency into the dashboard.
3️⃣ Track Performance – Monitor your data center’s performance, including energy efficiency, resource usage, and cooling efficiency.
4️⃣ Analyze Costs and Resources – Track operational costs and resource usage, and ensure optimal resource allocation.
5️⃣ Generate Reports – Create customizable reports to showcase your data center’s performance to stakeholders or team members.
Who Can Benefit from the Data Center KPI Dashboard in Excel:
- Data Center Managers
- IT Managers
- Facility Managers
- Business Owners
- Energy Efficiency Analysts
- Operations Managers
- Finance Teams
- Data Center Technicians
The Data Center KPI Dashboard in Excel helps you ensure that your data center operates efficiently, cost-effectively, and with minimal environmental impact. Whether you’re managing a single data center or overseeing a global infrastructure, this tool provides the insights you need to make informed decisions and optimize your operations.
Click here to read the Detailed blog post
https://www.pk-anexcelexpert.com/data-center-kpi-dashboard-in-excel/
Visit our YouTube channel to learn step-by-step video tutorials
Youtube.com/@PKAnExcelExpert


Reviews
There are no reviews yet.