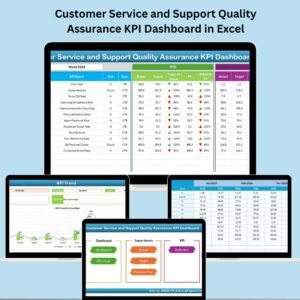
Drive long-term service excellence and track your performance like a pro with this ready-to-use Excel-based Customer Service and Support Sustainability KPI Dashboard template! Designed specifically to help you monitor customer service operations through the lens of sustainability, this tool puts actionable insights at your fingertips. Whether you manage a small support team or a large customer service department, this dashboard can optimize your performance and keep your service operations sustainable, efficient, and effective.
✨ Key Features of Customer Service and Support Sustainability KPI Dashboard
📌 Track Real-Time KPIs
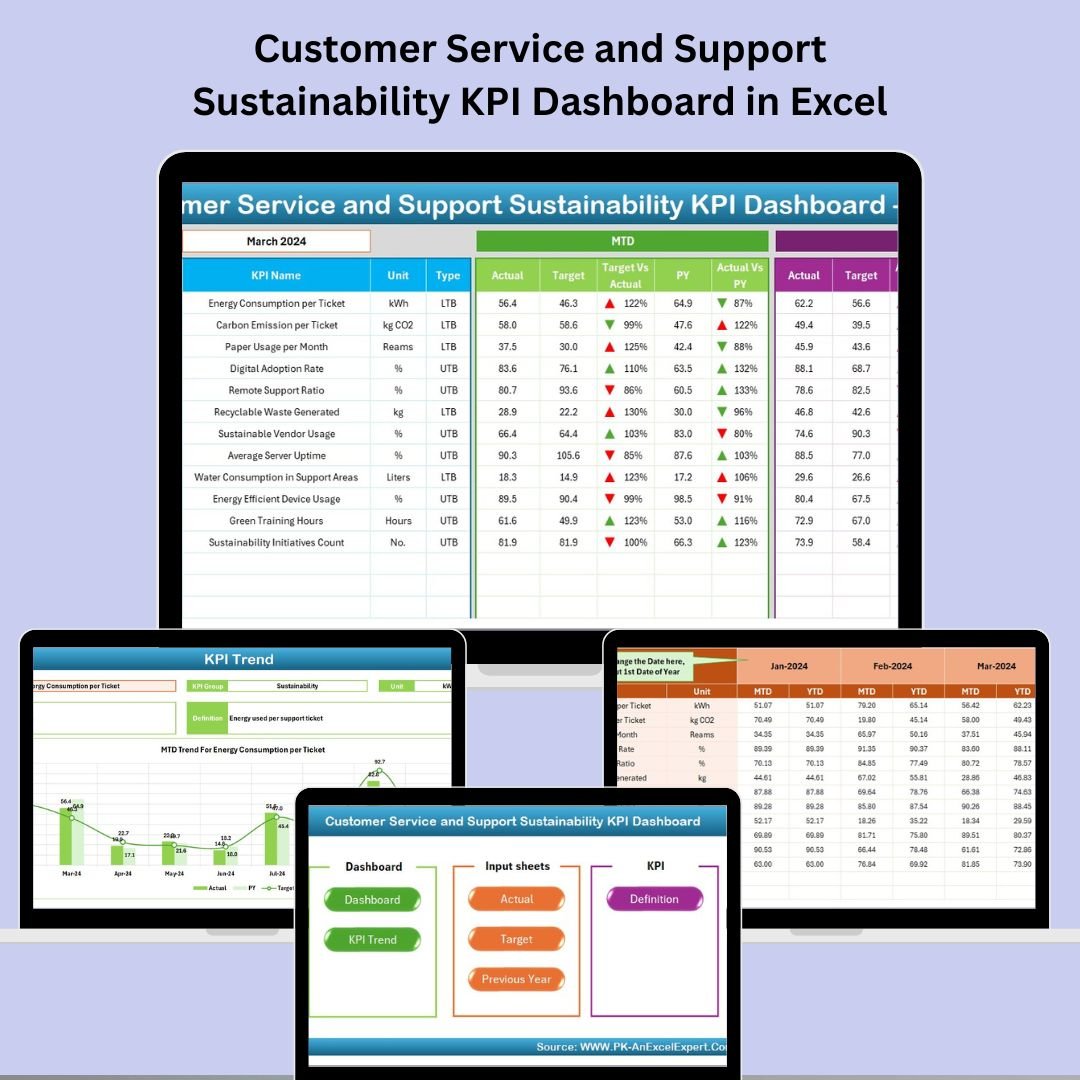
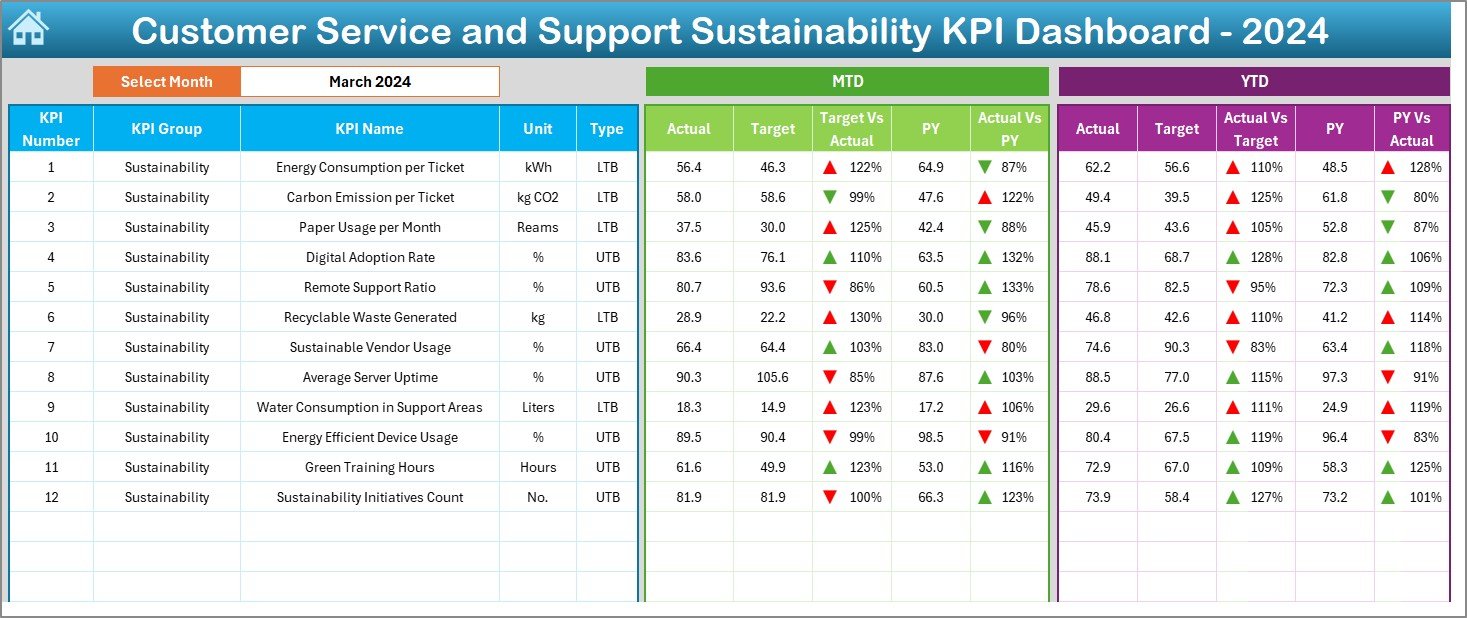
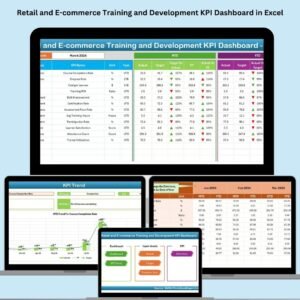
Measure Month-to-Date (MTD) and Year-to-Date (YTD) values for each KPI with side-by-side comparisons against targets and last year’s performance. Visual cues like up/down arrows quickly show whether your performance is improving or slipping.
📊 7 Organized Worksheets
-
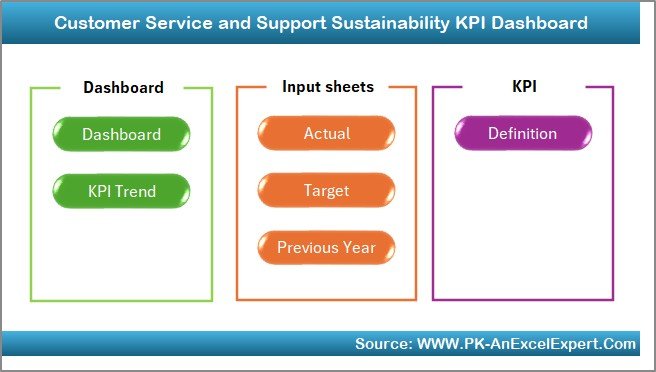
Home Sheet – Easy navigation with jump buttons
-
Dashboard – Central hub with performance charts
-
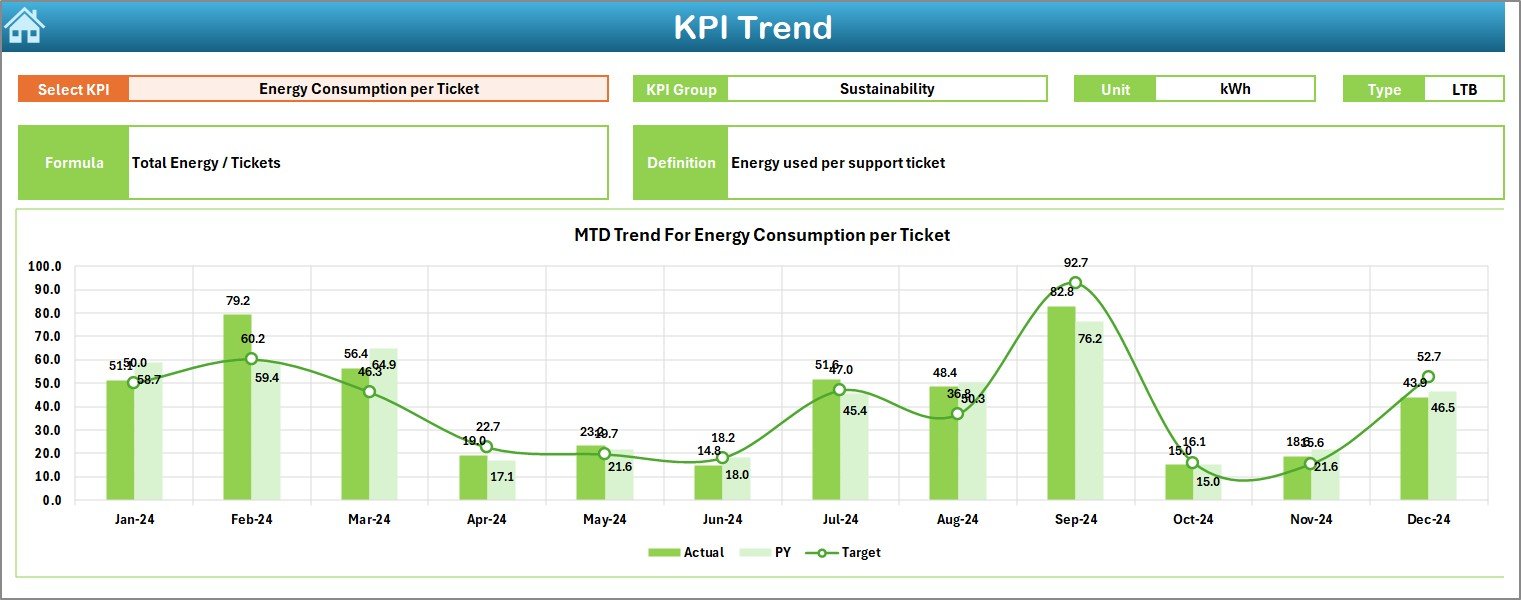
KPI Trend – Analyze trends by KPI
-
Actual Numbers Input – Fill in monthly data
-
Target Sheet – Set monthly KPI goals
-
Previous Year Numbers – Enter last year’s metrics
-
KPI Definition – Define every KPI with unit, formula, and type (LTB/UTB)
📈 Fully Interactive Charts
Includes conditional formatting, dropdown filters, and trend visualizations to make your analysis effortless and interactive.
📦 What’s Inside the Dashboard?
You get a complete Excel solution to monitor and manage your service KPIs:
-
🎯 MTD & YTD KPI cards for quick visibility
-
🧮 Formulas built-in for automatic performance calculation
-
🪄 Dropdown selections for flexible filtering and trend insights
-
🧾 KPI metadata including formula, definition, and unit of measure
Everything is set up—just plug in your numbers!
🛠️ How to Use the Dashboard
Step 1: Start from the Home Sheet and use buttons to jump between sections.
Step 2: Go to the Actual Numbers Input tab to fill in your monthly performance data.
Step 3: Input your targets and previous year numbers in their respective sheets.
Step 4: Select a month in the Dashboard sheet and analyze MTD/YTD results.
Step 5: Use the KPI Trend sheet to monitor growth and identify issues.
⚡ Pro Tip: Update it monthly for accurate insights and reliable trend tracking!
👥 Who Can Benefit from This Dashboard?
This dashboard is perfect for:
✅ Customer Support Managers – Track agent and channel performance
✅ Operations Teams – Monitor SLA, ticket trends, and team workloads
✅ CX Analysts – Dive into sustainability metrics like customer effort and resolution time
✅ Executives – View high-level reports and make data-driven decisions
✅ Small Businesses – Affordable, effective alternative to expensive SaaS tools
Whether you’re scaling or stabilizing, this template ensures you’re aligned with sustainable service goals.
🔗 Click here to read the Detailed blog post
👉 [Blog Post Link Placeholder]
📺 Visit our YouTube channel to learn step-by-step video tutorials
Learn how to set up and maximize your dashboard for real business impact!













Reviews
There are no reviews yet.