

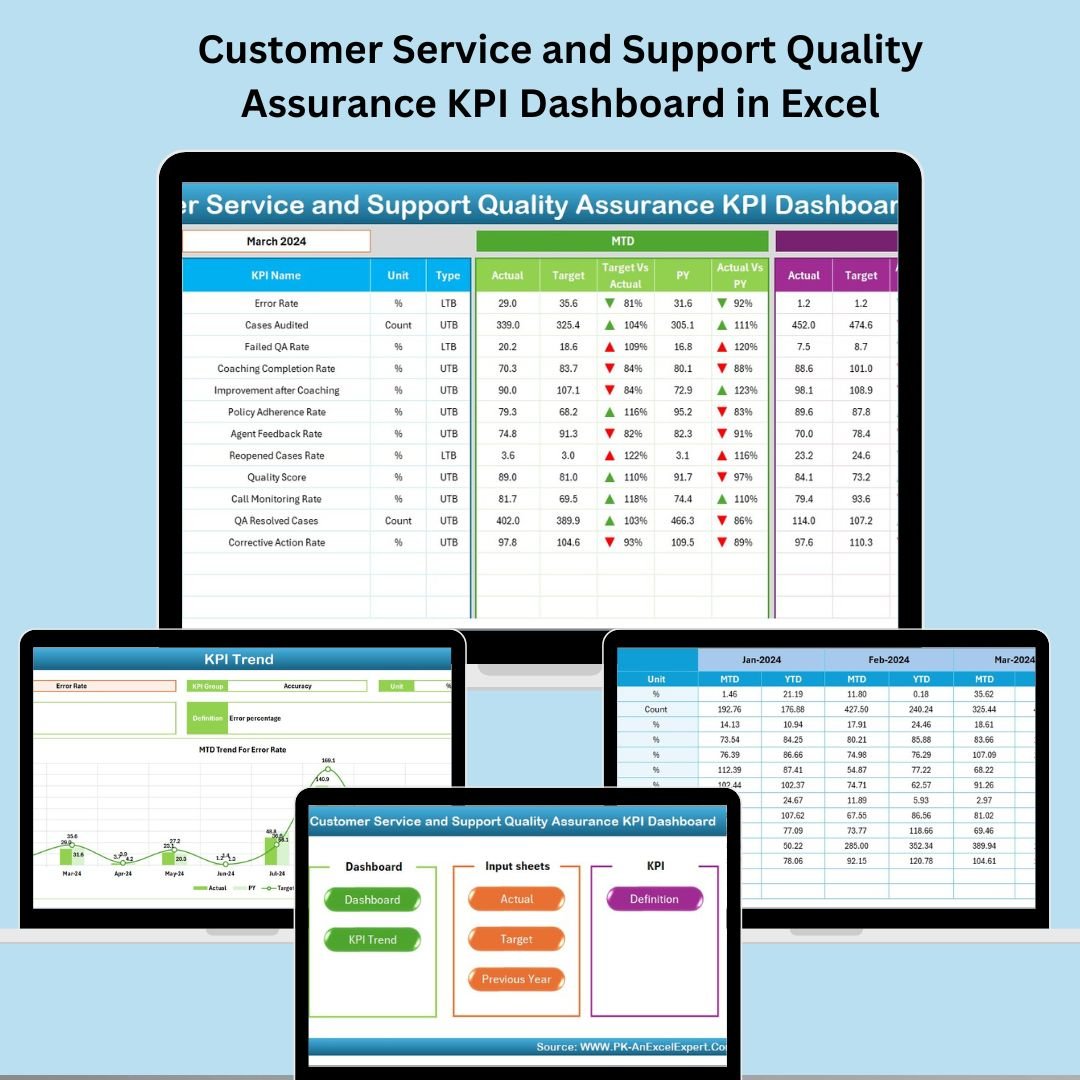

Exceptional customer service isn’t just a nice-to-have—it’s a competitive advantage. But how do you consistently measure, track, and improve service quality across your support team? 🤔 That’s where the Customer Service and Support Quality Assurance KPI Dashboard in Excel becomes your secret weapon. 📈💼
This all-in-one, ready-to-use Excel dashboard template transforms service data into actionable insights. Whether you’re managing a small helpdesk or a large customer support team, this tool will help you boost satisfaction, identify weak spots, and meet service-level expectations with confidence.
✅ Key Features of Customer Service & Support QA KPI Dashboard
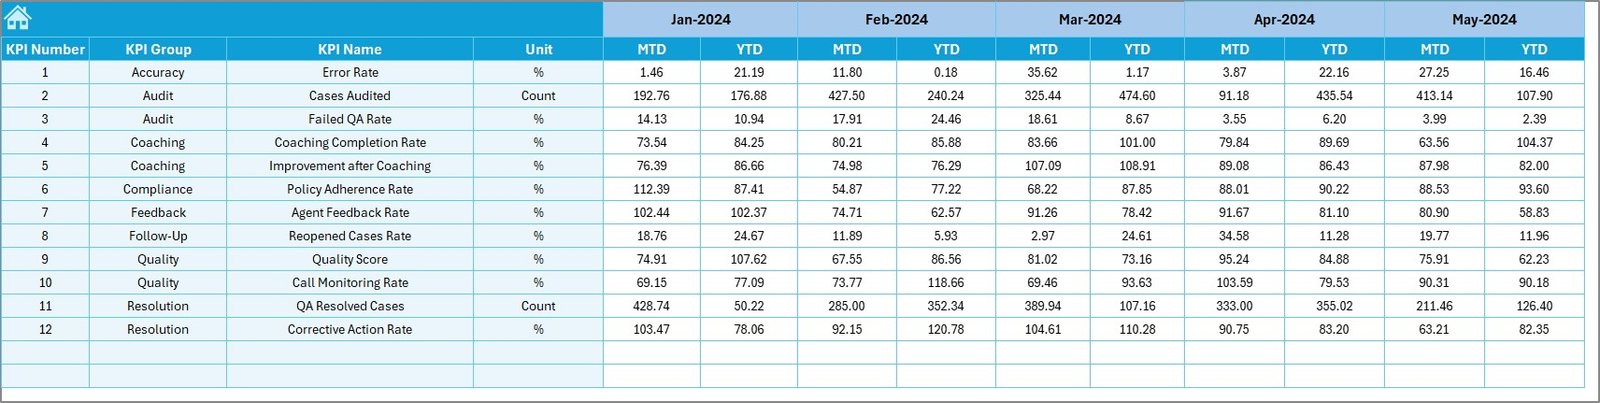
📅 Month Selector: Choose any month to instantly refresh MTD and YTD data.
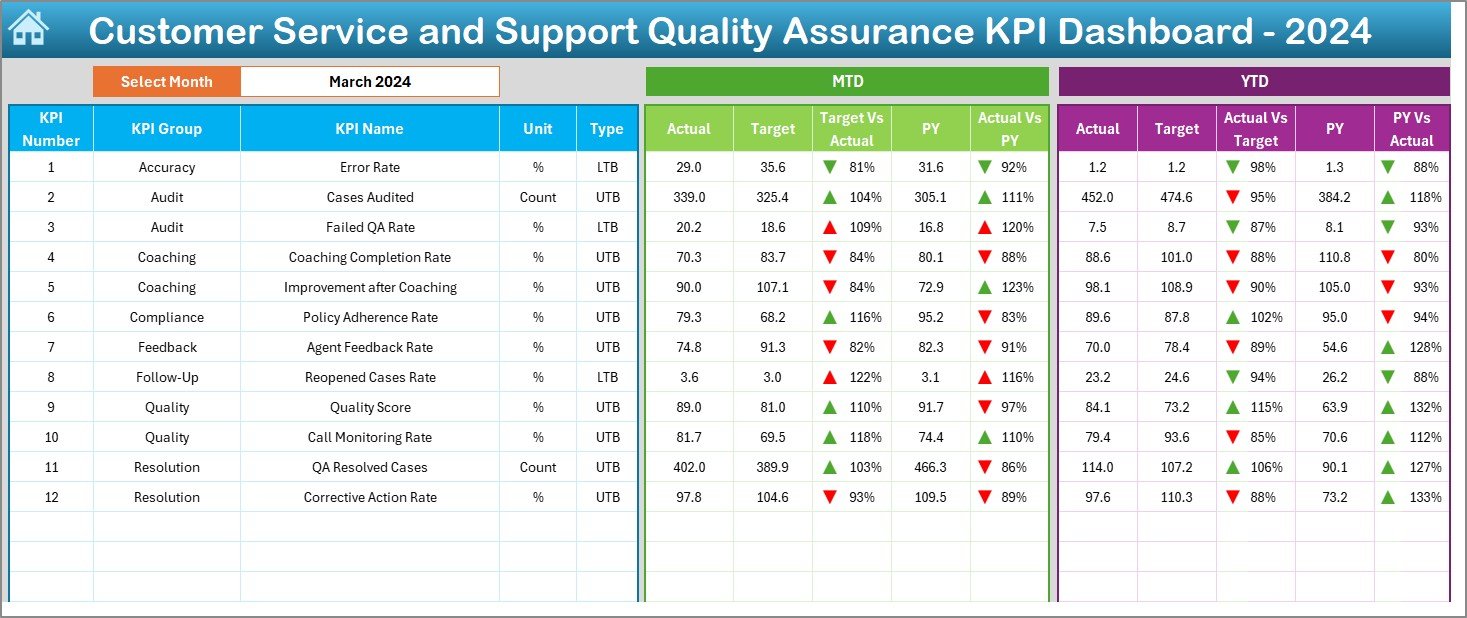
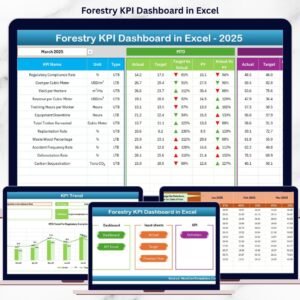
📊 Dashboard Visuals: View KPIs with actual, target, and previous year comparisons.
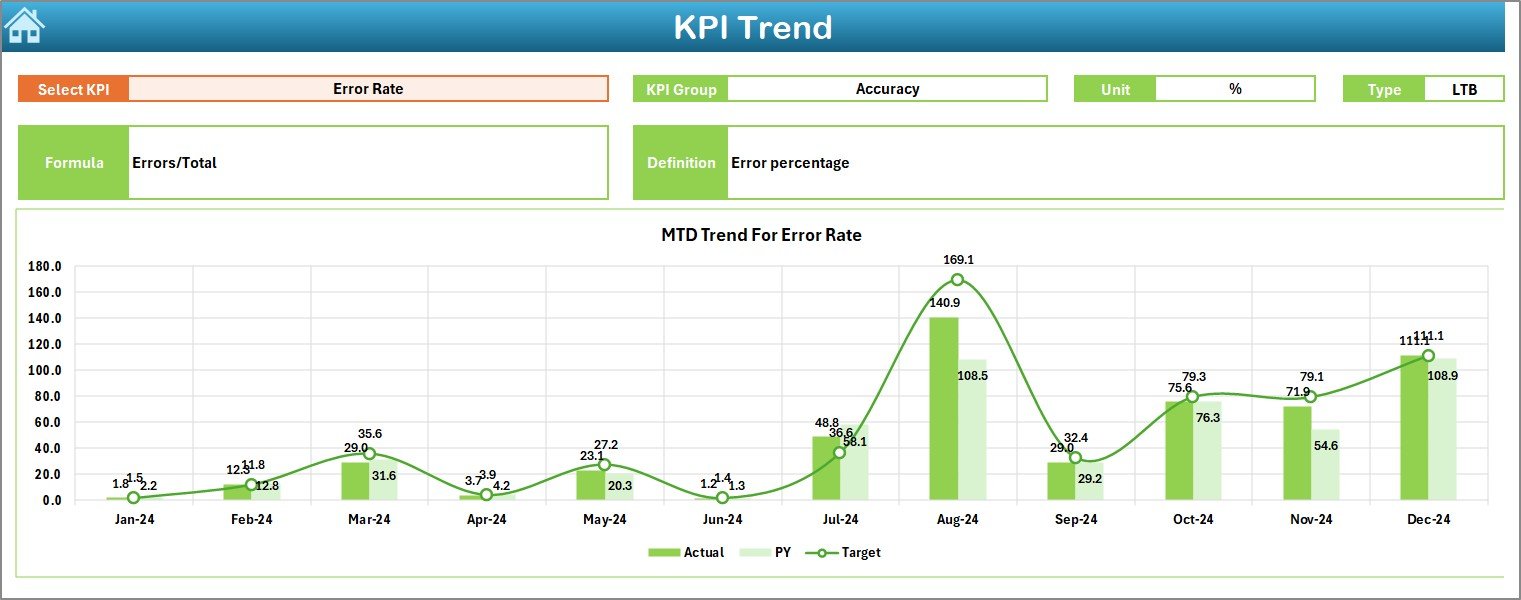
📉 Trend Analysis: Track KPI performance over time with MTD/YTD charts.
🧾 Auto Calculations: Real-time conditional formatting with arrows and color codes.
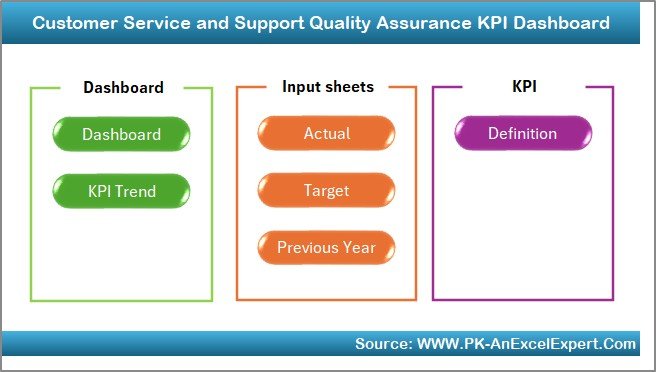
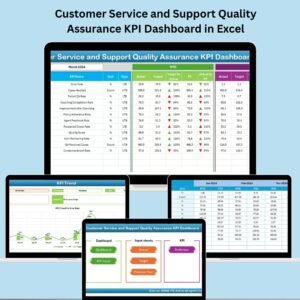
🗂️ 7 Structured Sheets: From input to dashboard and KPI definitions, everything’s built-in.
🧩 Flexible Setup: Easily add KPIs, update data, or customize visuals without coding.
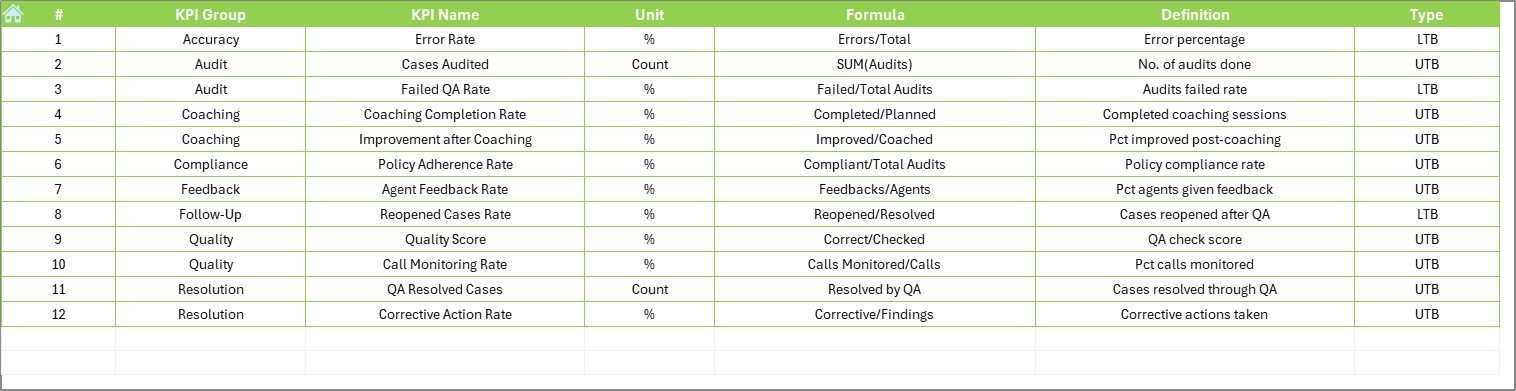
✅ LTB & UTB Ready: Classify each KPI as Lower the Better or Upper the Better.
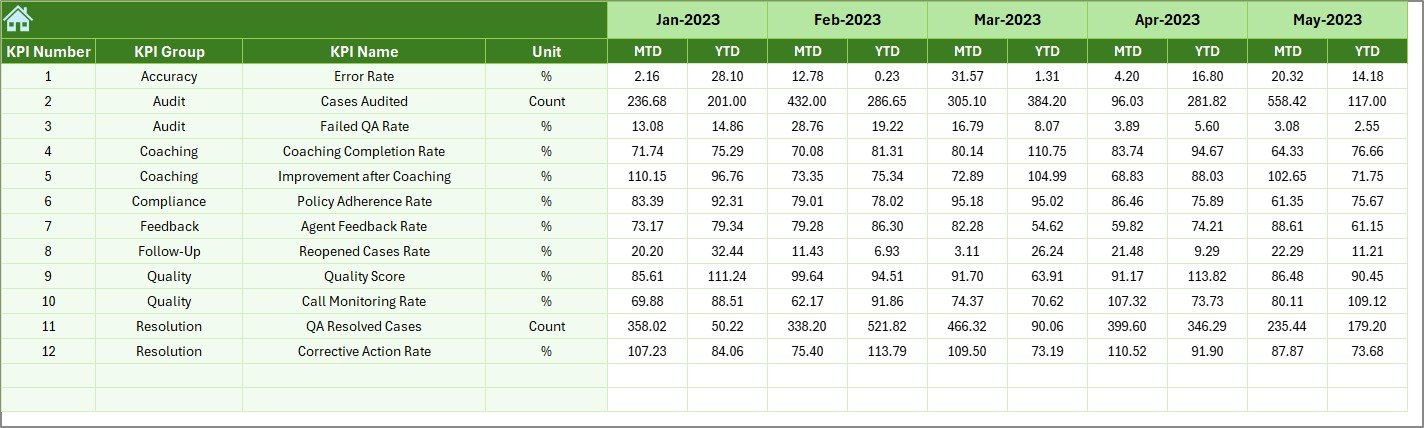
📁 Historical Comparison: Analyze performance against last year’s results.
📦 What’s Inside the Dashboard?
This Excel template includes 7 powerful, interlinked worksheet tabs:
🏠 Home Sheet
Your navigation hub with quick-click buttons to each main sheet.
📊 Dashboard Sheet
The visual summary. See MTD and YTD performance, track trends, and compare Actuals vs Targets and Previous Year values.
📈 KPI Trend Sheet
Select a KPI to analyze monthly progress with:
KPI Group, Unit, Formula, Type
Dynamic charts for MTD/YTD trends
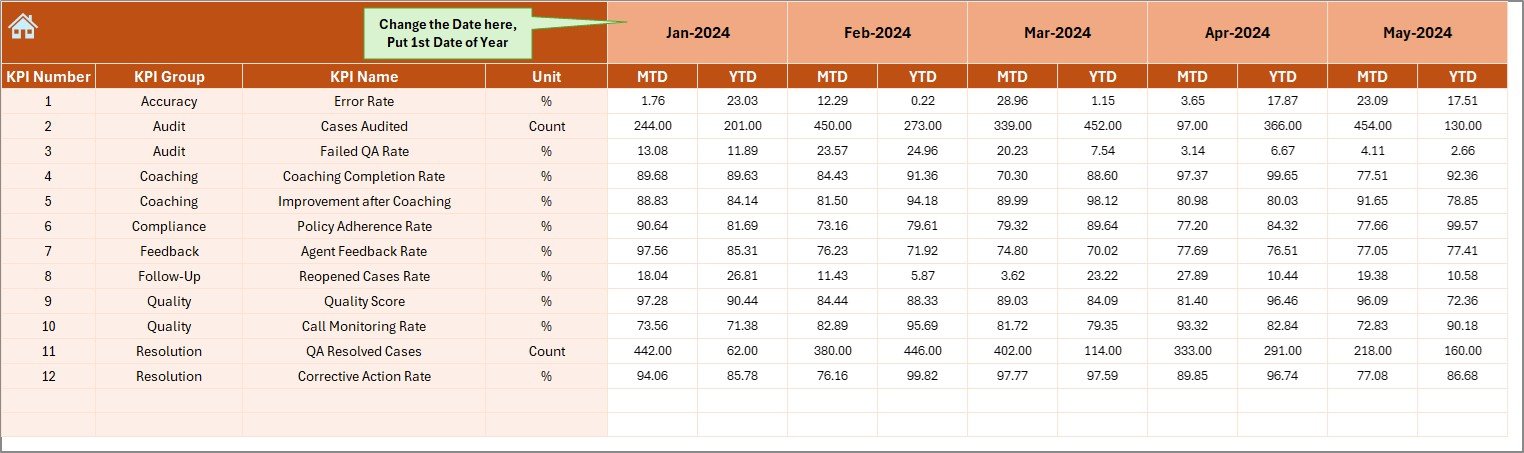
📥 Actual Numbers Input
Enter monthly actuals for each KPI. Use dropdowns and auto-updating logic to keep things simple.
🎯 Target Sheet
Define monthly MTD and YTD targets—compare against actuals to gauge team performance.
📆 Previous Year Sheet
Track historical MTD and YTD data to spot recurring issues or seasonal trends.
📖 KPI Definition Sheet
Document KPI Name, Group, Unit, Formula, Definition, and whether it’s LTB or UTB.
🛠️ How to Use the Dashboard
Enter Your KPIs in the Definition Sheet.
Input Actual, Target & PY Data in their respective sheets.
Select a Month from the dropdown in the Dashboard sheet.
Review Insights from trend charts, color codes, and arrows.
Analyze Trends to guide performance discussions and improvements.
Customize as Needed – add filters, KPIs, or extend monthly ranges.
👥 Who Can Benefit from This Dashboard?
👩💼 Customer Service Managers – Monitor agent and team performance.
📊 Operations Leads – Maintain SLA compliance and service quality.
🧑💻 Support Agents – Gain visibility into metrics that matter.
💼 Small Business Owners – Run efficient support without complex tools.
📈 Data Analysts – Generate QA reports with ease from structured data.
🔗 Click here to read the Detailed blog post
🔗 Visit our YouTube channel to learn step-by-step video tutorials
Watch the step-by-step video tutorial:
Compatibility and Requirements
- Works in Microsoft Excel desktop (Excel 2016 or later, or Microsoft 365).
- You pick the month from a dropdown on the Dashboard sheet. Microsoft explains dropdowns in Create a drop-down list.
Frequently Asked Questions
Which sheets are included?
Seven sheets: Home, Dashboard, KPI Trend, Actual Numbers Input, Target, Previous Year and KPI Definition.
How do I update the dashboard?
Enter your monthly figures in the Actual Numbers Input sheet and your goals in the Target sheet. Then select a month on the Dashboard sheet and the MTD and YTD views refresh.
Can I compare this year with last year?
Yes. Add last year’s MTD and YTD values to the Previous Year sheet and the Dashboard shows them next to your actuals and targets.
How do I see the trend for one KPI?
Open the KPI Trend sheet and select a KPI. It shows the KPI group, unit, formula and type, with charts for MTD and YTD trends.
Can I add my own KPIs?
Yes. Add the KPI name, group, unit, formula and definition on the KPI Definition sheet, and mark it as Lower the Better or Upper the Better.
Is there a Google Sheets version of a similar dashboard?
See the Customer Service Dashboard in Google Sheets. For a Power BI option, see the Customer Service KPI Dashboard in Power BI.
Related Customer Service Templates
- Customer Service and Support Performance KPI Dashboard in Excel: a performance view of support KPIs
- Customer Service and Support Cost Efficiency KPI Dashboard in Excel: the cost side of support
- Customer Support SLA KPI Dashboard in Excel: service level tracking
- Quality Assurance KPI Dashboard in Excel: a general quality assurance KPI view
- Customer Service Dashboard in Excel: a customer service dashboard
Browse all Excel KPI dashboards.












Reviews
There are no reviews yet.