
Customer onboarding is one of the most critical stages in the customer lifecycle. A smooth onboarding experience builds trust, improves product adoption, and increases long-term retention. However, many businesses still struggle because onboarding data is scattered across spreadsheets, emails, and manual reports. As a result, teams lose visibility, onboarding timelines stretch, and customer satisfaction drops.
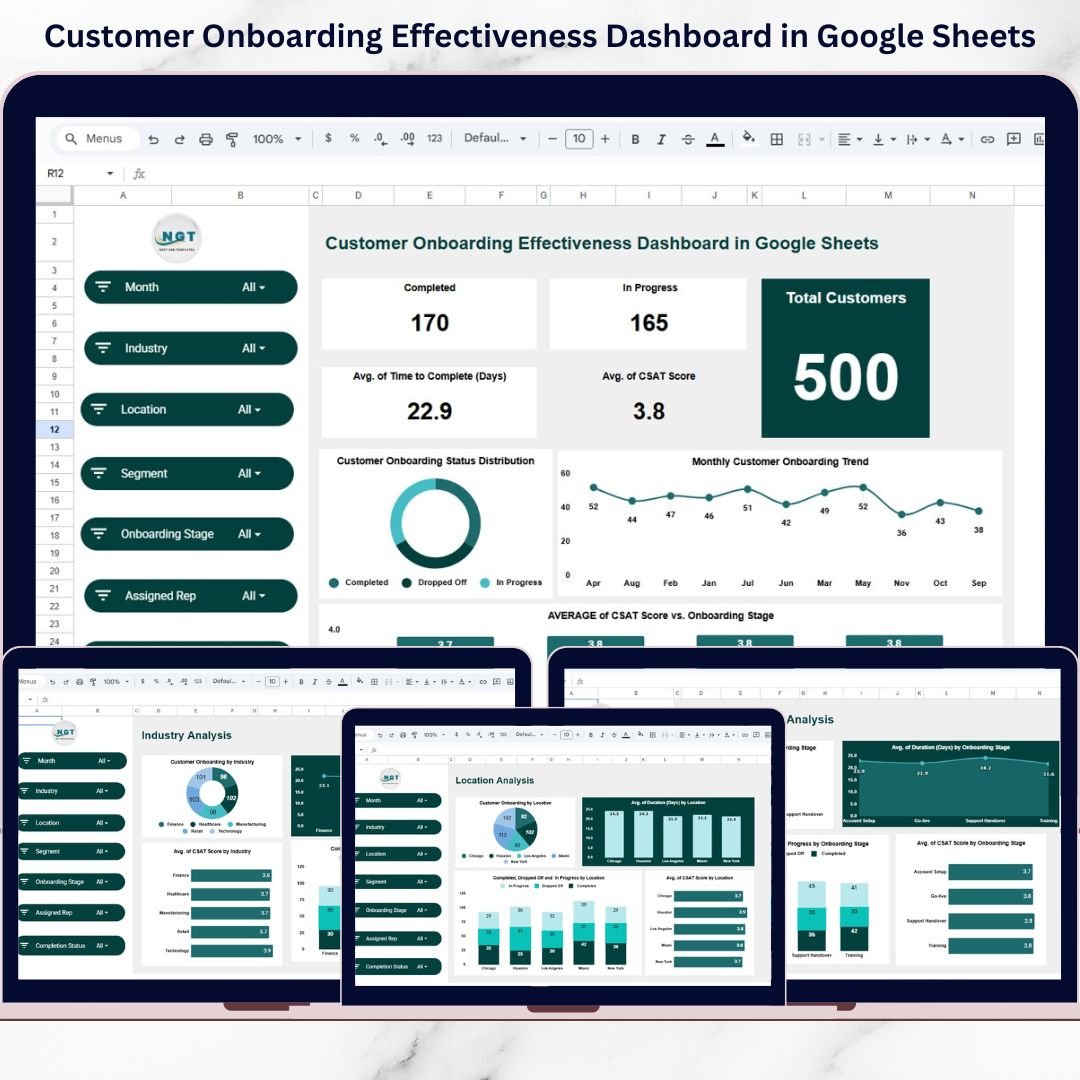
That is exactly why the Customer Onboarding Effectiveness Dashboard in Google Sheets is a game-changing solution.
This ready-to-use Google Sheets dashboard helps businesses track, measure, and optimize the entire onboarding journey—from customer entry to completion. Instead of spending hours compiling reports, teams get a centralized, interactive dashboard that shows onboarding progress, completion rates, CSAT scores, timelines, and drop-off trends in real time.
Because it is built entirely in Google Sheets, the dashboard supports real-time collaboration, instant filtering, and easy data updates without any technical skills. As a result, onboarding, sales, and customer success teams stay aligned and proactive.
🔑 Key Features of Customer Onboarding Effectiveness Dashboard
📊 360° Onboarding Visibility – Track onboarding status, duration, and satisfaction in one place
📅 Time-to-Complete Analysis – Measure onboarding efficiency in days
😊 CSAT Tracking – Monitor customer satisfaction across onboarding stages
📈 Monthly Trend Analysis – Identify performance improvements or slowdowns over time
🍩 Completion Status Distribution – Visual breakdown of completed, in-progress, and dropped-off customers
🌍 Location & Industry Insights – Compare onboarding performance across regions and industries
🎛️ Interactive Slicers – Filter data by month, industry, location, segment, stage, and status
☁️ Google Sheets Native – No installation, no macros, no complexity
📂 What’s Inside the Customer Onboarding Effectiveness Dashboard
This dashboard includes multiple professionally designed analysis pages, each focused on a specific onboarding dimension.
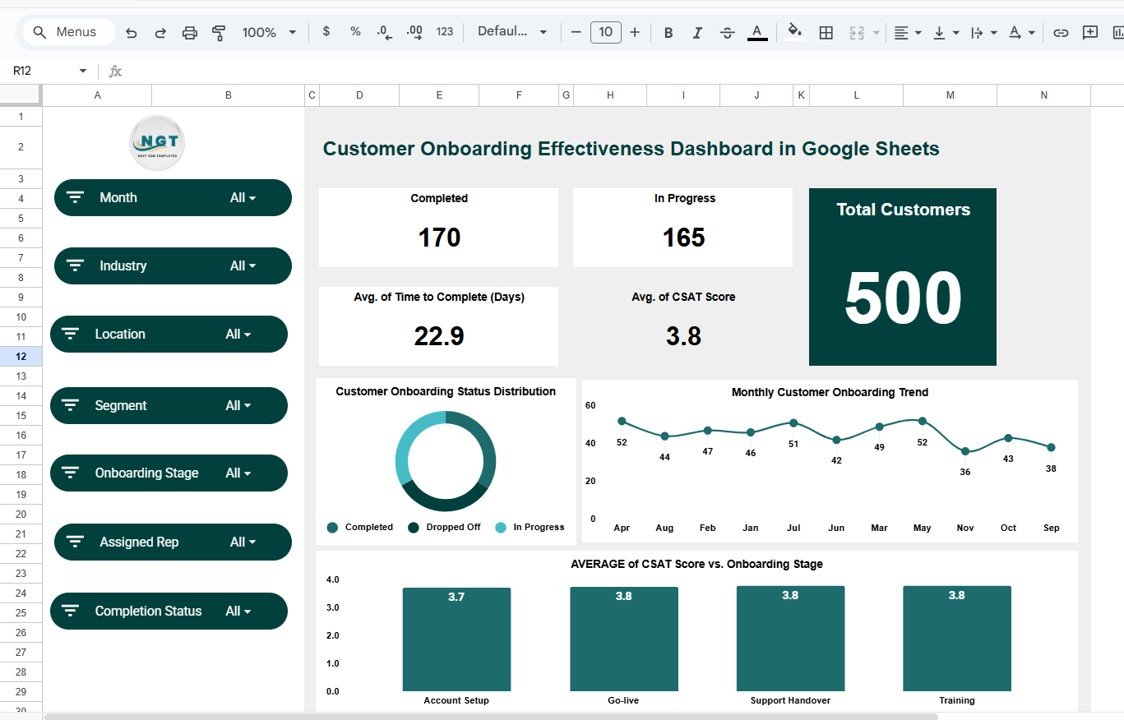
📄 Overview Page
This is the main summary page that provides instant onboarding insights:
-
Total customers in onboarding
-
Completed vs in-progress customers
-
Average onboarding duration (days)
-
Average CSAT score
A donut chart visually displays onboarding status distribution, while trend charts show monthly onboarding volumes.
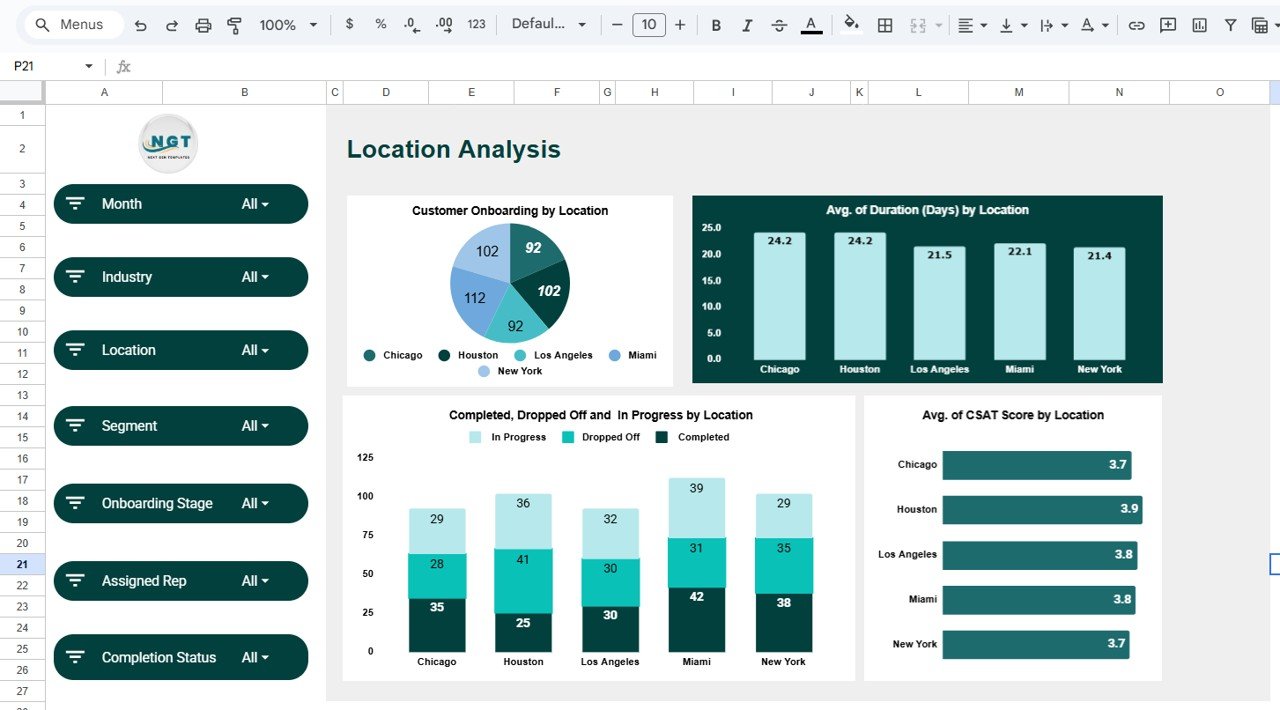
📄 Location Analysis Page
This page helps teams compare onboarding performance across regions:
-
Customer onboarding distribution by location
-
Average onboarding duration by location
-
Completed, dropped-off, and in-progress counts
-
CSAT score comparison by location
📄 Onboarding Stage Analysis Page
This page focuses on stage-level bottlenecks:
-
Customer count by onboarding stage
-
Average duration per stage
-
Completion vs drop-off by stage
-
CSAT score by onboarding stage
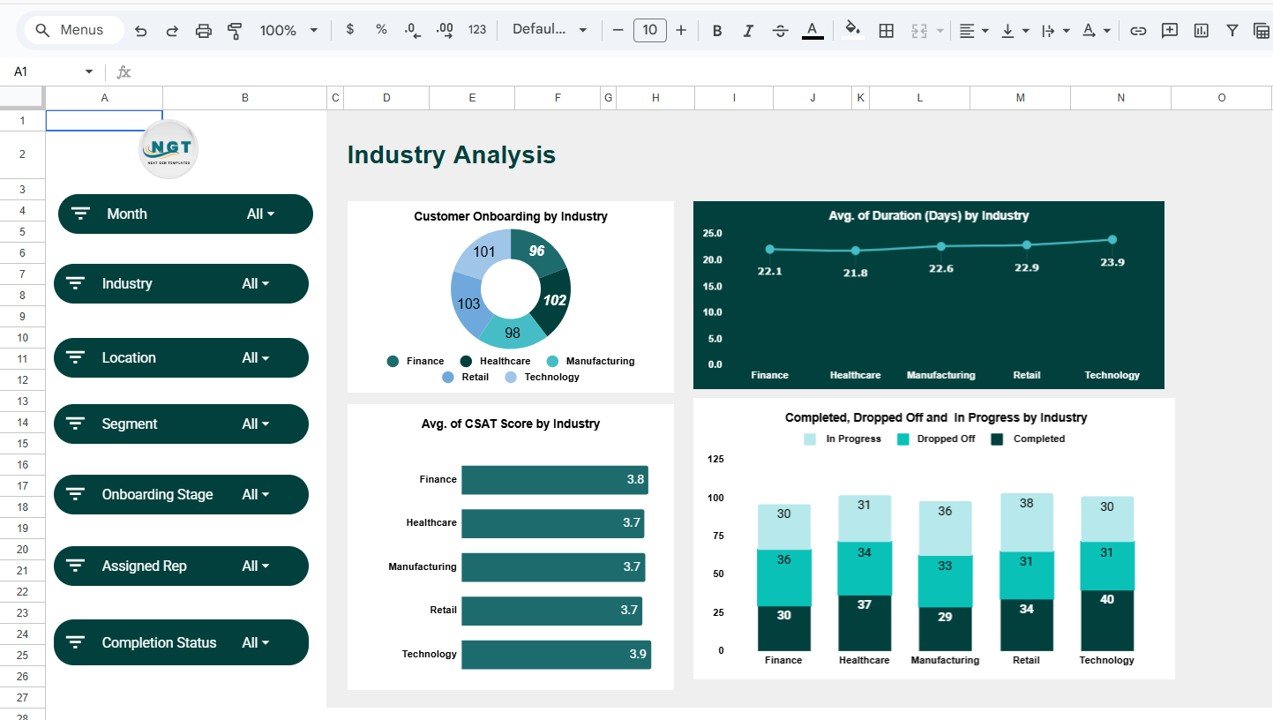
📄 Industry Analysis Page
Analyze onboarding effectiveness across industries:
-
Customer distribution by industry
-
Average onboarding duration by industry
-
CSAT score by industry
-
Completion vs drop-off comparison
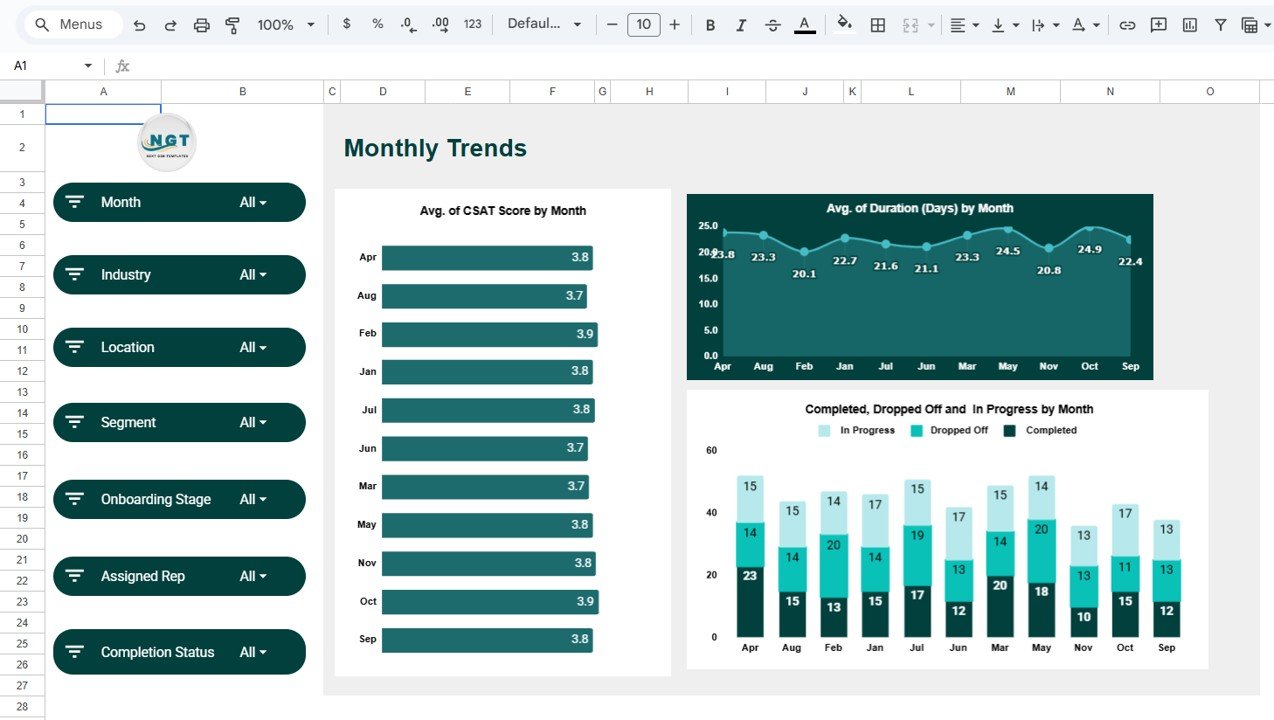
📄 Monthly Trends Page
This page tracks consistency and planning metrics:
-
Monthly CSAT trends
-
Monthly onboarding duration trends
-
Monthly completed, in-progress, and dropped-off customers
🧭 How to Use the Customer Onboarding Effectiveness Dashboard
Using the dashboard is simple and intuitive:
1️⃣ Update onboarding data in Google Sheets
2️⃣ Use slicers to filter by month, industry, location, or stage
3️⃣ Review KPIs, charts, and trends automatically
4️⃣ Identify delays, drop-offs, and satisfaction gaps
5️⃣ Take action to improve onboarding efficiency
Because everything updates dynamically, decision-makers always work with current data.
👥 Who Can Benefit from This Customer Onboarding Dashboard
This dashboard is ideal for:
-
🚀 SaaS Companies
-
🤝 Customer Success Managers
-
📊 Onboarding & Implementation Teams
-
💼 Sales Enablement Teams
-
🧠 Product & Growth Managers
-
🏢 Service-Based Businesses
If onboarding speed, quality, and experience matter to your business, this dashboard is a must-have.
🔗 Click here to read the Detailed Blog Post
🎥 Visit our YouTube channel to learn step-by-step video tutorials
Watch the step-by-step video tutorial:
Visit our YouTube channel to learn step-by-step video tutorials


