


The Courier Service KPI Dashboard in Excel is an essential tool for courier and logistics companies looking to track and optimize their key performance indicators (KPIs). This Excel-based dashboard provides real-time insights into the performance of your courier operations, helping you monitor delivery efficiency, customer satisfaction, and overall business profitability.
Designed for courier service managers, logistics coordinators, and operations teams, this dashboard allows you to track key metrics such as delivery times, on-time deliveries, customer complaints, and operational costs. With visualizations, data tracking, and performance metrics at your fingertips, this dashboard helps you make data-driven decisions to improve operational efficiency and customer satisfaction.
Key Features of the Courier Service KPI Dashboard in Excel
📈 Track Delivery Performance
Monitor key delivery KPIs such as on-time delivery rates, average delivery times, and number of packages delivered. Track how your service is performing and identify areas where improvement is needed.
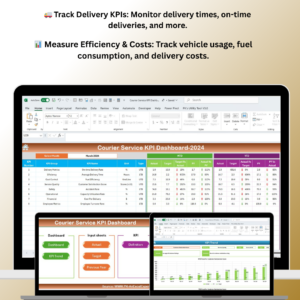
🚚 Delivery Efficiency & Cost Tracking
Measure the efficiency of your deliveries, including total delivery costs, fuel consumption, and vehicle usage. Monitor costs per delivery to ensure your operations remain profitable.
📊 Customer Satisfaction Metrics
Track customer feedback and complaints to evaluate service quality. Monitor metrics such as customer satisfaction ratings, complaint resolution times, and delivery feedback to improve customer experience.
📅 Real-Time Data Tracking
Stay up to date with real-time data tracking for deliveries and service performance. Monitor your team’s performance and adjust strategies as needed to stay on track with your business goals.
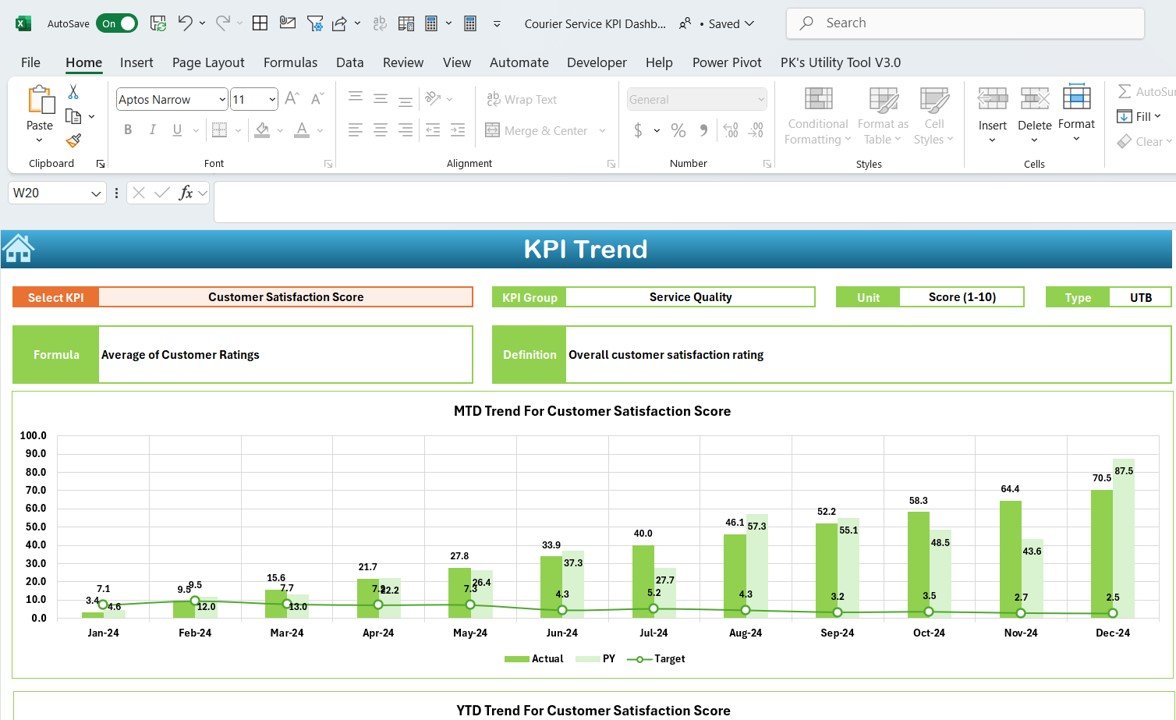
💡 Visual Data Insights
Use graphs, charts, and visual representations of your data to easily analyze your courier performance. Identify trends, recognize areas for improvement, and optimize your strategies.
🔄 Customizable Metrics & KPIs
Adjust the dashboard to fit your courier service’s specific needs. Add, remove, or modify metrics such as delivery types, service zones, or any other relevant KPIs to suit your business.
Why You’ll Love the Courier Service KPI Dashboard in Excel

✅ Optimize Delivery Performance
Track your delivery metrics and identify bottlenecks in your process. Optimize delivery efficiency by monitoring key indicators and improving service areas that need attention.
✅ Improve Customer Satisfaction
By tracking customer complaints, feedback, and resolution times, you can address any service issues promptly and ensure better customer retention.
✅ Reduce Operational Costs
Monitor costs like fuel usage and delivery expenses to find opportunities for cost-saving initiatives. Keep your operations profitable without compromising service quality.
✅ Data-Driven Decision Making
Use real-time data and visual insights to make informed decisions that will improve efficiency, reduce costs, and enhance the overall customer experience.
✅ Fully Customizable & Scalable
Easily adjust the dashboard to meet the specific needs of your courier service. Whether you’re a local delivery service or a global logistics provider, the dashboard is flexible enough to scale with your business.
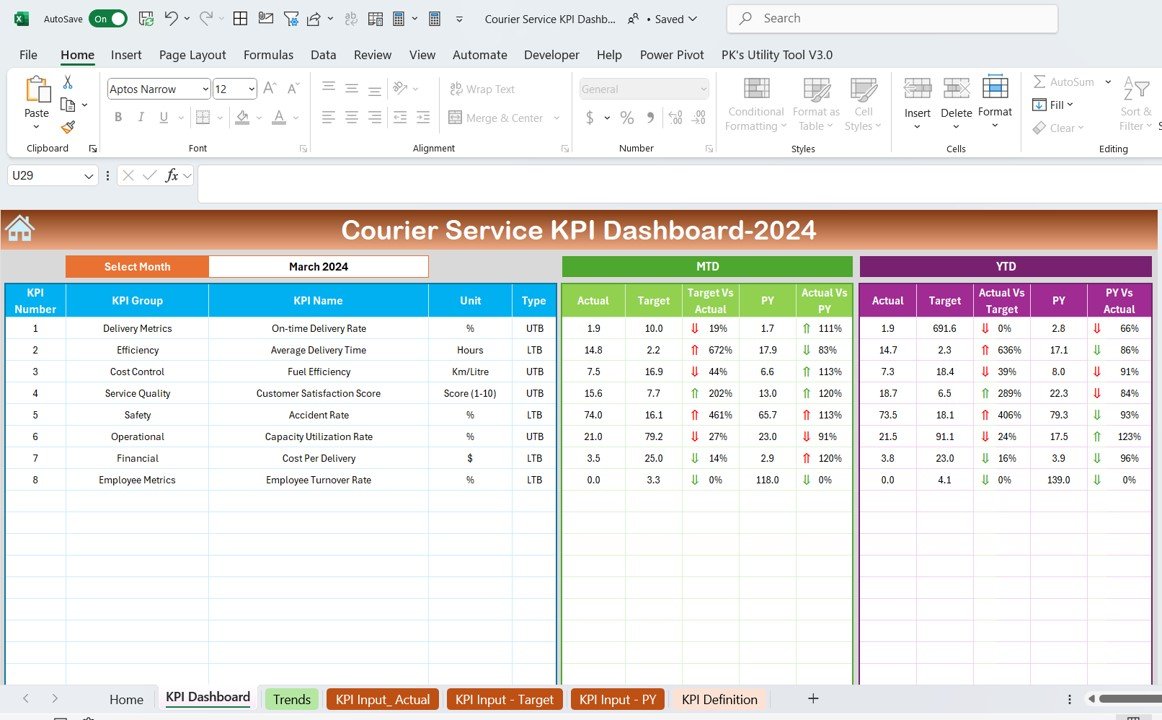
What’s Inside the Courier Service KPI Dashboard in Excel?
- Delivery Performance Metrics: Track key delivery KPIs, such as on-time deliveries, average delivery time, and total packages delivered.
- Cost & Efficiency Tracker: Monitor fuel usage, vehicle costs, and delivery efficiency to manage operational expenses.
- Customer Satisfaction Tracker: Evaluate customer feedback and monitor complaint resolution times to improve service quality.
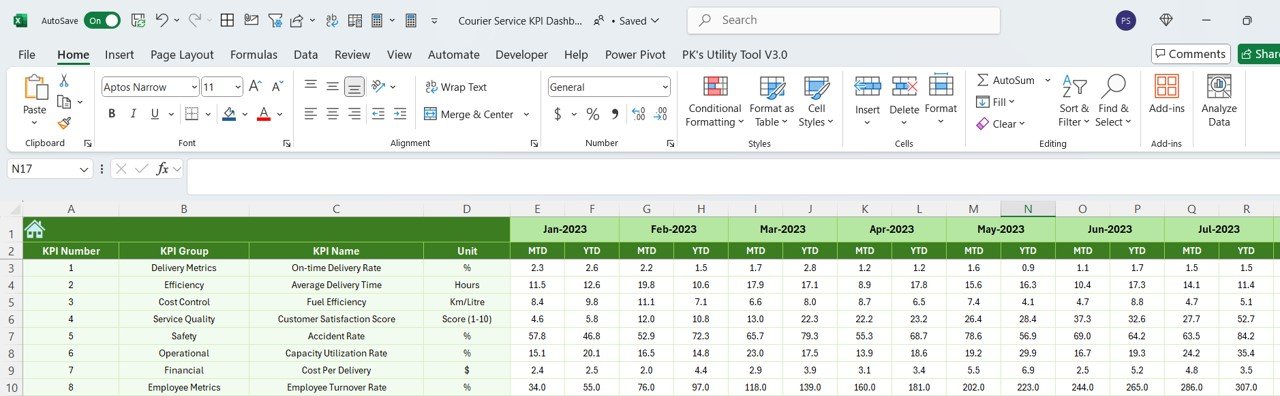
- Real-Time Data Integration: Get real-time updates for accurate monitoring of deliveries and performance metrics.
- Visual Data Insights: Use graphs and charts to visualize data trends and make better decisions based on performance.
- Customizable KPIs: Modify and track additional KPIs that are important to your courier service’s performance.
How to Use the Courier Service KPI Dashboard in Excel
1️⃣ Download the Template: Instantly access the Courier Service KPI Dashboard in Excel.
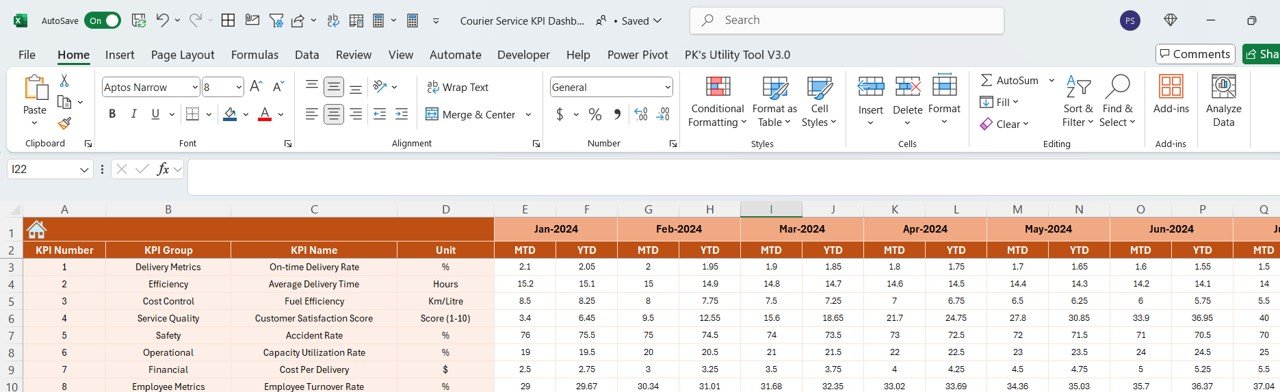
2️⃣ Input Your Data: Enter data such as delivery times, customer feedback, and operational costs into the template.
3️⃣ Track & Monitor KPIs: Use the dashboard to track key performance metrics and monitor delivery efficiency.
4️⃣ Analyze Performance: Review trends, identify bottlenecks, and analyze customer satisfaction data.
5️⃣ Generate Reports & Insights: Use visualizations to generate reports and share insights with your team or stakeholders.
Who Can Benefit from the Courier Service KPI Dashboard in Excel?
🔹 Courier & Logistics Companies
🔹 Delivery Managers & Operations Teams
🔹 Small & Medium Enterprises (SMEs)
🔹 Freight & Parcel Service Providers
🔹 Fleet Managers
🔹 Customer Service & Support Teams
Optimize your courier service operations, track performance, and improve efficiency with the Courier Service KPI Dashboard in Excel. Monitor key KPIs, improve customer satisfaction, and reduce costs to enhance your business performance.
Click here to read the Detailed blog post
Visit our YouTube channel to learn step-by-step video tutorials
Youtube.com/@PKAnExcelExpert


Reviews
There are no reviews yet.