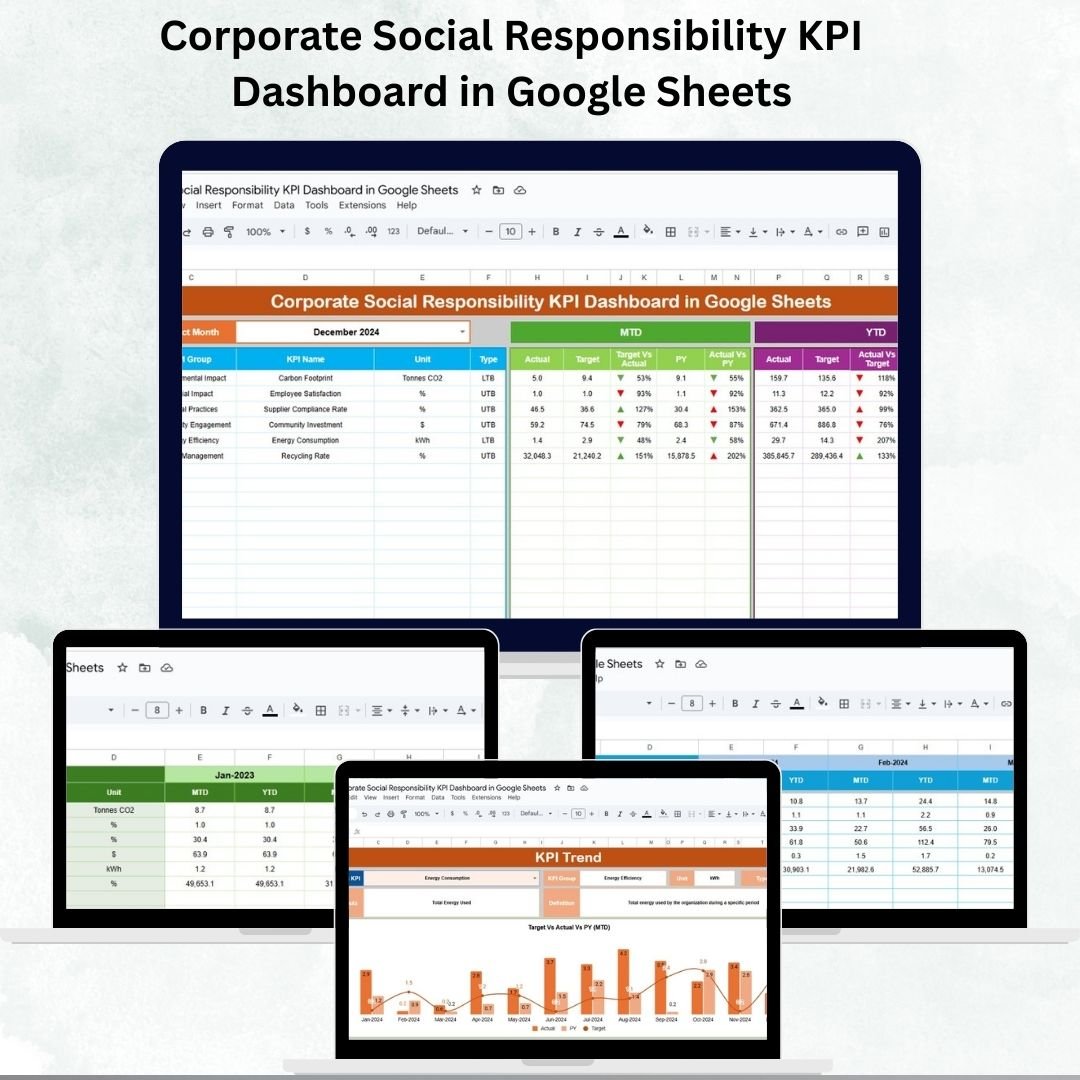
Corporate Social Responsibility (CSR) has become an essential part of modern business strategy. Organizations today are expected to balance profitability with social impact, environmental stewardship, and community engagement. To ensure success, businesses need an efficient way to track, measure, and report on CSR initiatives. That’s where the CSR KPI Dashboard in Google Sheets comes in. 📊✨
This ready-to-use, cloud-based dashboard helps CSR managers, sustainability officers, and business leaders monitor critical CSR KPIs in real time. With Month-to-Date (MTD) and Year-to-Date (YTD) tracking, year-over-year comparisons, and interactive visuals, this tool makes CSR reporting easy, collaborative, and impactful.
🔑 Key Features of CSR KPI Dashboard
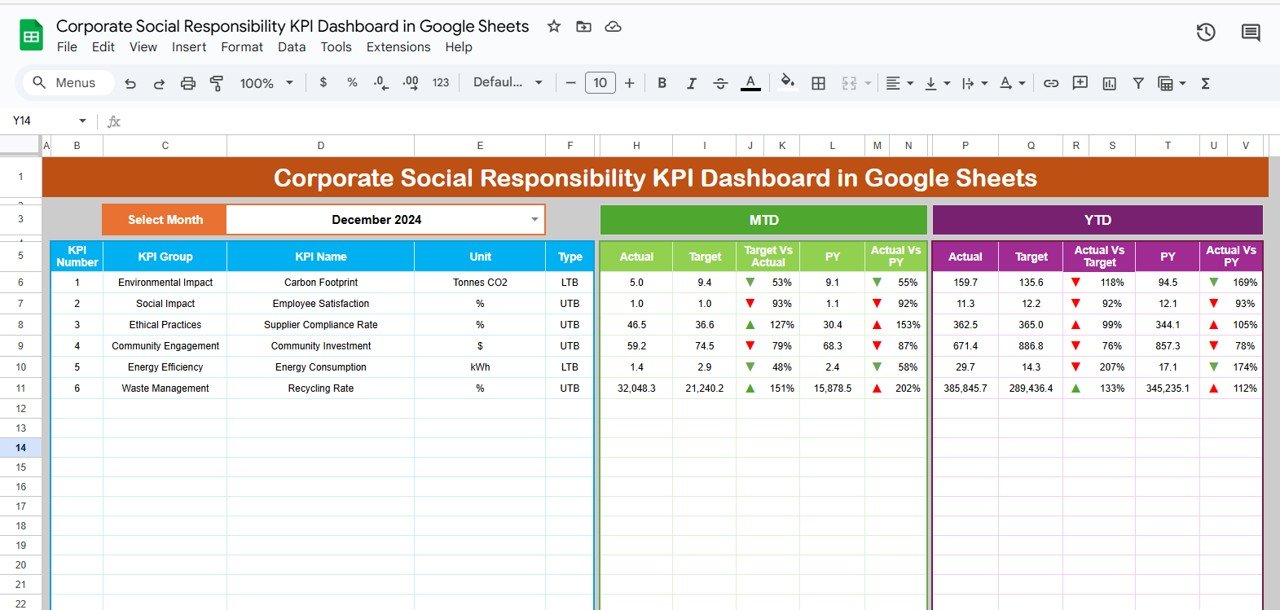
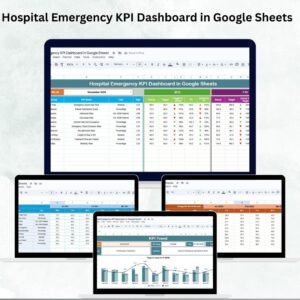
📊 Dashboard Sheet Tab
-
High-level summary of all CSR KPIs.
-
Select any month to auto-update performance metrics.
-
Displays MTD Actual, Target, and Previous Year (PY) data.
-
Conditional formatting with arrows makes performance trends easy to spot.
-
YTD analysis for long-term performance tracking.
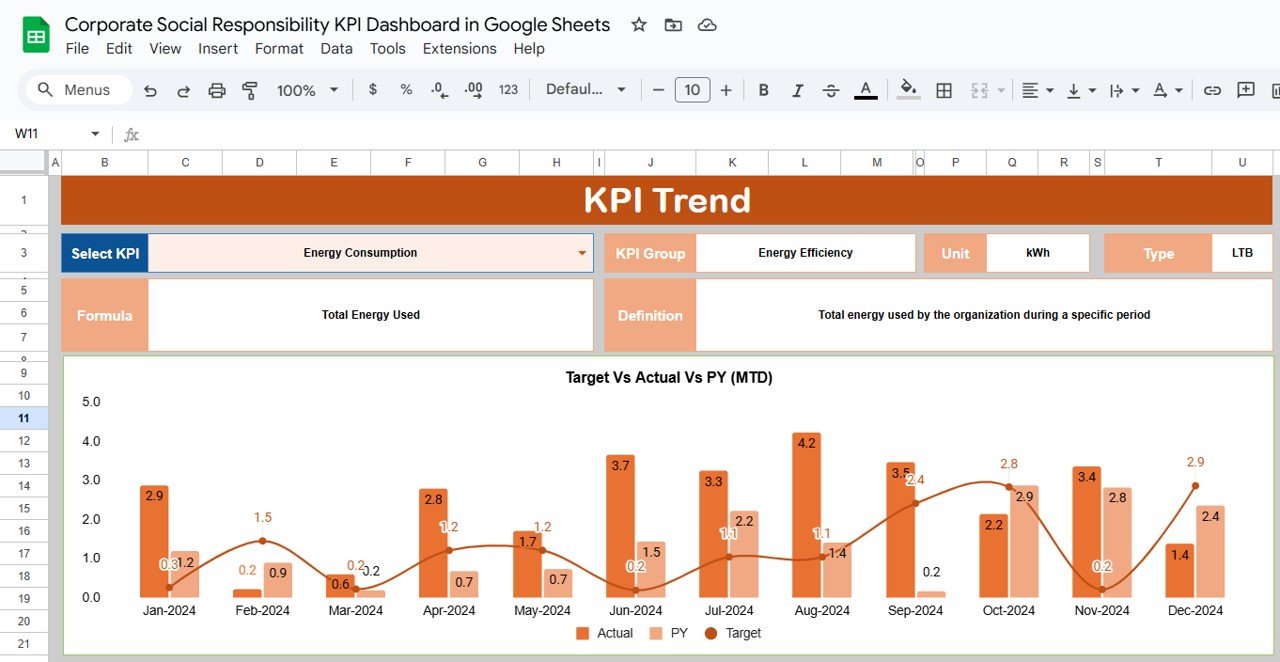
📈 KPI Trend Sheet Tab
-
Drill into any KPI with dropdown selection.
-
Shows KPI Group, Unit, Type (LTB/UTB), Formula, and Definition.
-
Helps ensure clarity and consistency across the organization.
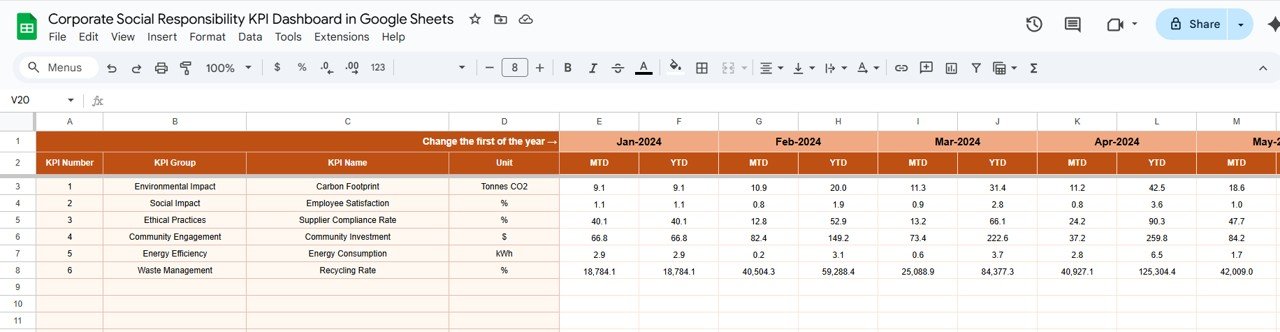
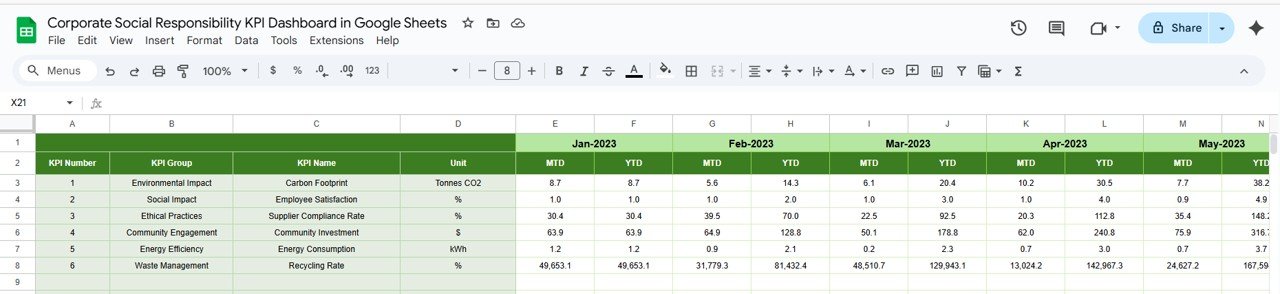
🧾 Actual Number Sheet Tab
-
Input actual values for MTD and YTD metrics.
-
Auto-calculates performance based on starting month.
-
Ensures accuracy and transparency.
🎯 Target Sheet Tab
-
Input monthly and yearly targets for all KPIs.
-
Keep CSR initiatives aligned with organizational goals.
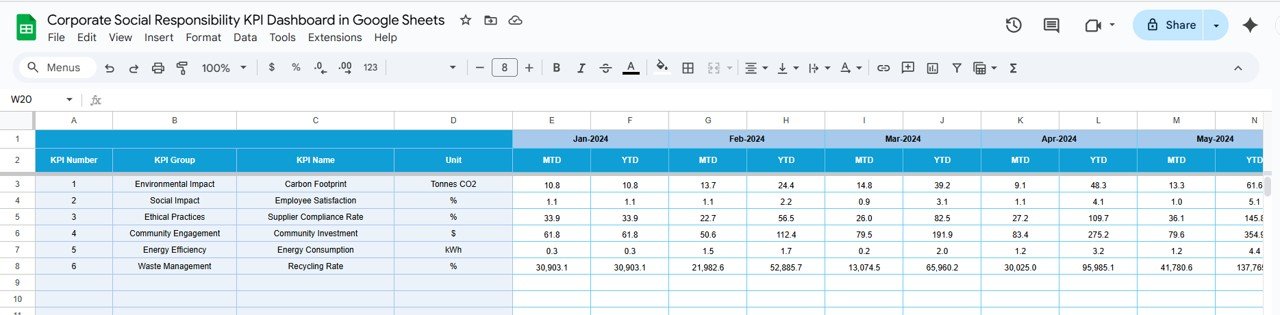
📉 Previous Year Number Sheet Tab
-
Record historical data for year-over-year benchmarking.
-
Quickly spot progress and recurring challenges.
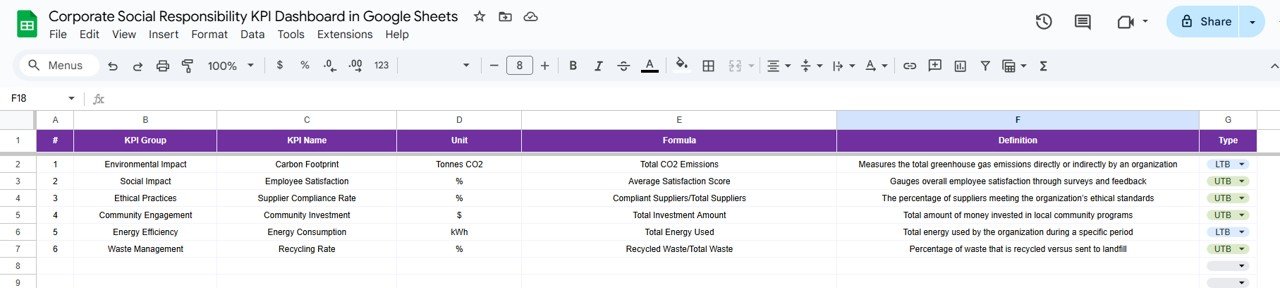
📑 KPI Definition Sheet Tab
-
Master database of CSR KPIs.
-
Includes names, groups, formulas, units, and definitions.
-
Standardizes KPI understanding across departments.
📦 What’s Inside the Dashboard
✅ 6 Pre-Built Tabs – Dashboard, KPI Trend, Actual Numbers, Targets, Previous Year, KPI Definitions
✅ Interactive Reporting – MTD, YTD, and YoY comparisons
✅ Conditional Formatting – Arrows and highlights for instant analysis
✅ Cloud Access – Real-time updates and collaboration in Google Sheets
✅ Pre-Formatted Layout – Plug-and-play structure, no coding needed
✅ Customizable KPIs – Add or adjust to fit your organization’s CSR goals
👥 Who Can Benefit from This Dashboard?
🌍 CSR Managers & Sustainability Officers – Track and showcase impact.
🏢 Business Leaders & Executives – Align CSR initiatives with strategy.
💡 Nonprofits & NGOs – Monitor donor-driven CSR activities.
📊 Analysts & Auditors – Simplify compliance and reporting.
🤝 HR & Community Teams – Track employee volunteerism and engagement.
Whether you’re a small business or a large enterprise, this dashboard helps you demonstrate accountability, improve transparency, and maximize impact.
📋 Best Practices for Using the CSR KPI Dashboard
-
🔄 Update actual data regularly (weekly or monthly).
-
🎯 Set measurable CSR goals with clear targets.
-
📊 Monitor trends using the KPI Trend Sheet.
-
🔎 Use conditional formatting to quickly detect underperformance.
-
👩🏫 Educate staff about KPI definitions for consistent reporting.
-
💾 Keep historical data for year-over-year impact analysis.
-
🤝 Share with stakeholders to encourage collaboration and trust.
✅ Advantages of CSR KPI Dashboard
-
Centralized Tracking – All CSR KPIs in one platform.
-
Real-Time Collaboration – Cloud-based for easy access.
-
Visual Performance Insights – Arrows and charts make data easy to understand.
-
Goal Alignment – MTD and YTD tracking ensures initiatives meet targets.
-
Comparative Analysis – Benchmark against past performance.
-
Decision Support – Guide resource allocation with data-driven insights.


Reviews
There are no reviews yet.