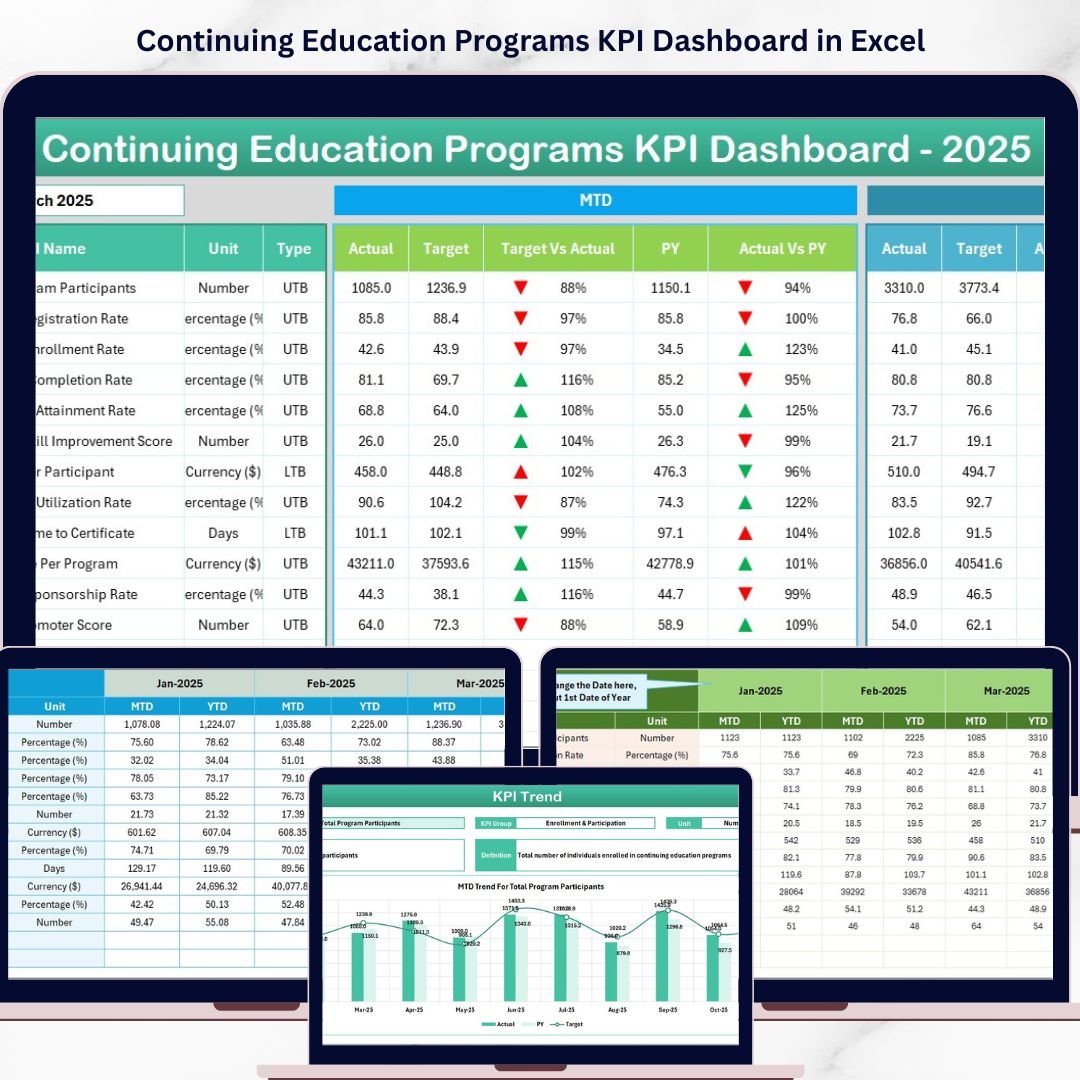
Continuing Education Programs KPI Dashboard in Excel is a professionally designed, ready-to-use analytics template built for training institutes, corporate learning departments, adult education centers, HR teams, and professional development managers who need to monitor program enrollment, track learner progress, measure certification completion rates, and evaluate overall program effectiveness — all from one powerful and interactive Excel KPI Dashboard.Continuing Education Programs KPI Dashboard in Excel
If you are managing continuing education programs and looking for a smarter way to consolidate enrollment data, completion metrics, revenue figures, and learner satisfaction scores into a single reporting view, this Continuing Education Programs KPI Dashboard in Excel is your ultimate solution. Simply input your actual numbers alongside targets and previous year data, and the dashboard automatically calculates MTD and YTD comparisons with intuitive conditional formatting arrows — giving you instant clarity on which KPIs are on track and which need attention.Continuing Education Programs KPI Dashboard in Excel
🔑 Key Features of Continuing Education Programs KPI Dashboard in Excel
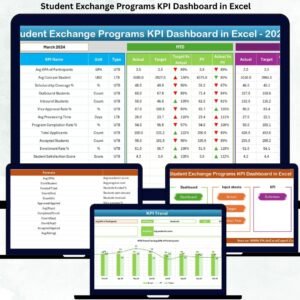
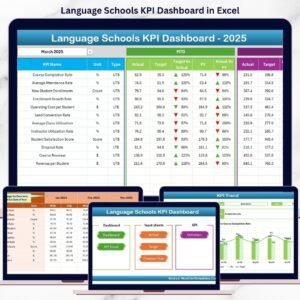
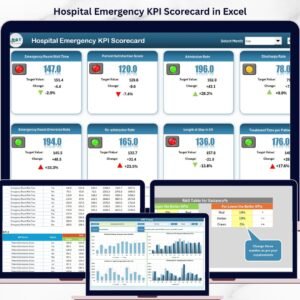
📊 Comprehensive KPI Scorecards — Track all your continuing education metrics at a glance including Enrollment Rate, Completion Rate, Certification Pass Rate, Learner Satisfaction Score, Revenue per Program, Cost per Learner, Instructor Utilization Rate, and many more through dynamic MTD and YTD scorecards with Target vs Actual and Previous Year vs Actual comparisons highlighted by conditional formatting arrows.
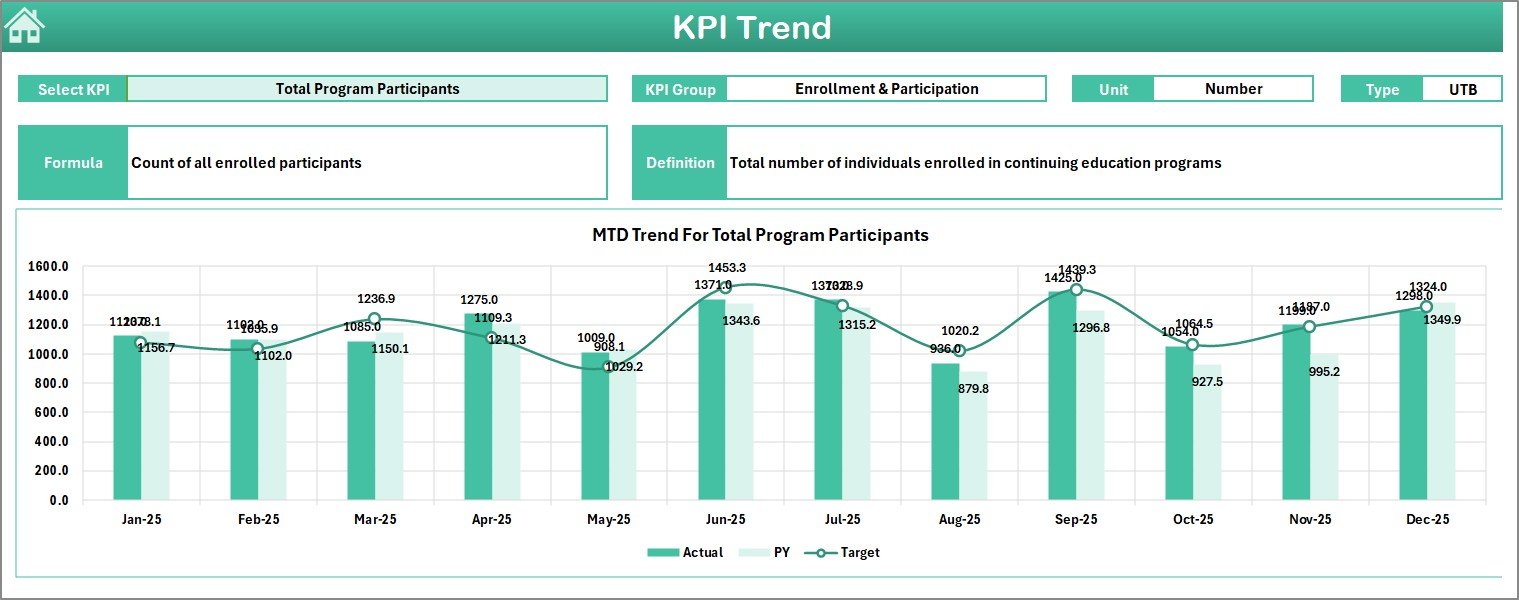
📈 Interactive KPI Trend Analysis — Dive deep into any individual KPI with dedicated trend charts showing Actual vs Target vs Previous Year performance across months for both MTD and YTD periods, helping you spot seasonal patterns and performance drifts early.
🎯 Dynamic Month Selector — Switch between any month from a simple drop-down and watch the entire dashboard update instantly, giving you the flexibility to review current performance or analyze historical data with a single click.
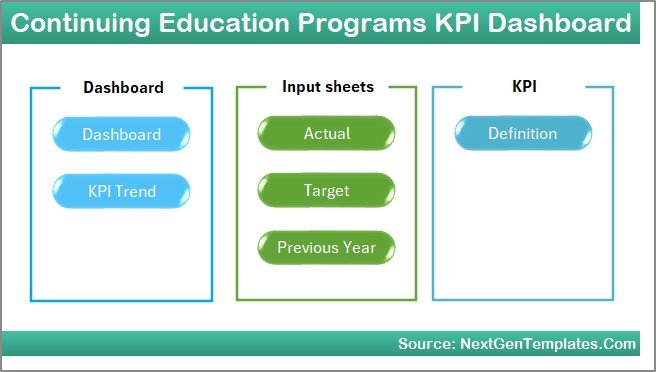
📅 7 Professionally Structured Worksheets — Enjoy a well-organized workbook with dedicated sheets for the Dashboard overview, KPI Trends, Actual Numbers Input, Target Numbers Input, Previous Year Numbers, KPI Definitions, and a Support sheet for guidance and instructions.
🔄 Automated Calculations — All variance calculations, percentage comparisons, and conditional formatting are pre-built using advanced Excel formulas so you spend zero time on manual number-crunching and more time on strategic decision-making.
💡 No VBA or Macros Required — This template runs entirely on native Excel formulas and features, making it compatible with all versions of Excel including Excel for Microsoft 365, Excel 2021, Excel 2019, and Excel Online, similar to our popular STEM Education Centers KPI Dashboard in Excel.
📦 What’s Inside the Continuing Education Programs KPI Dashboard
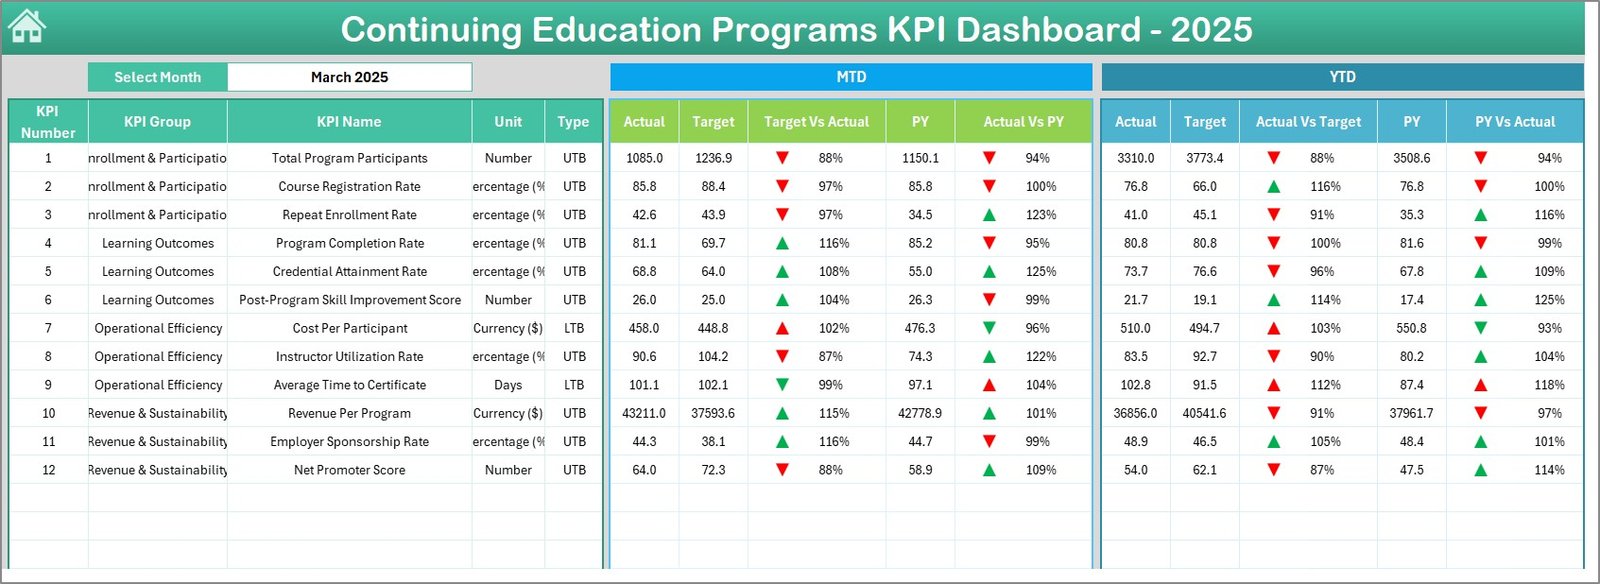
📋 Dashboard Sheet — The main overview page displaying all KPIs with MTD Actual, Target, and Previous Year data alongside YTD Actual, Target, and Previous Year data. Conditional formatting arrows instantly show whether each KPI is performing above or below expectations. Select any month from the drop-down on cell D3 and the entire dashboard refreshes automatically.
📉 KPI Trend Sheet — Select any KPI from the drop-down on cell C3 to view its detailed trend analysis. The sheet displays KPI Group, Unit, Type (Lower the Better or Upper the Better), Formula, and Definition along with MTD and YTD trend charts comparing Actual, Target, and Previous Year numbers across all months.
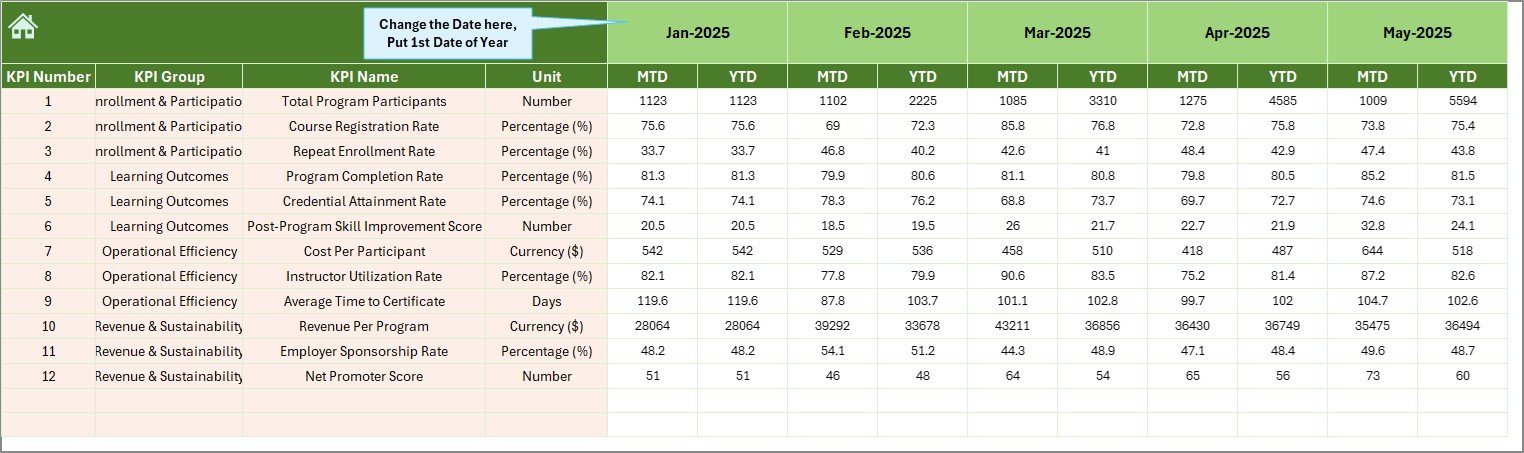
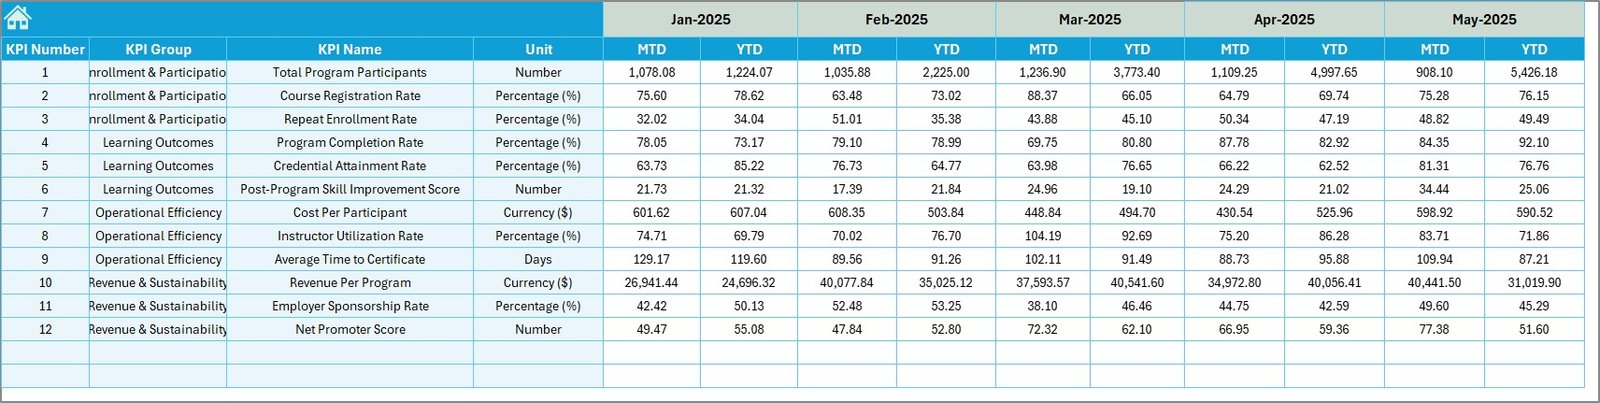
📝 Actual Numbers Input Sheet — Enter your actual MTD and YTD numbers for each KPI here. Change the starting month from cell E1 to align with your fiscal year.
🎯 Target Number Input Sheet — Input your target numbers for each KPI across all months as both MTD and YTD values to enable automatic variance calculations on the Dashboard sheet.
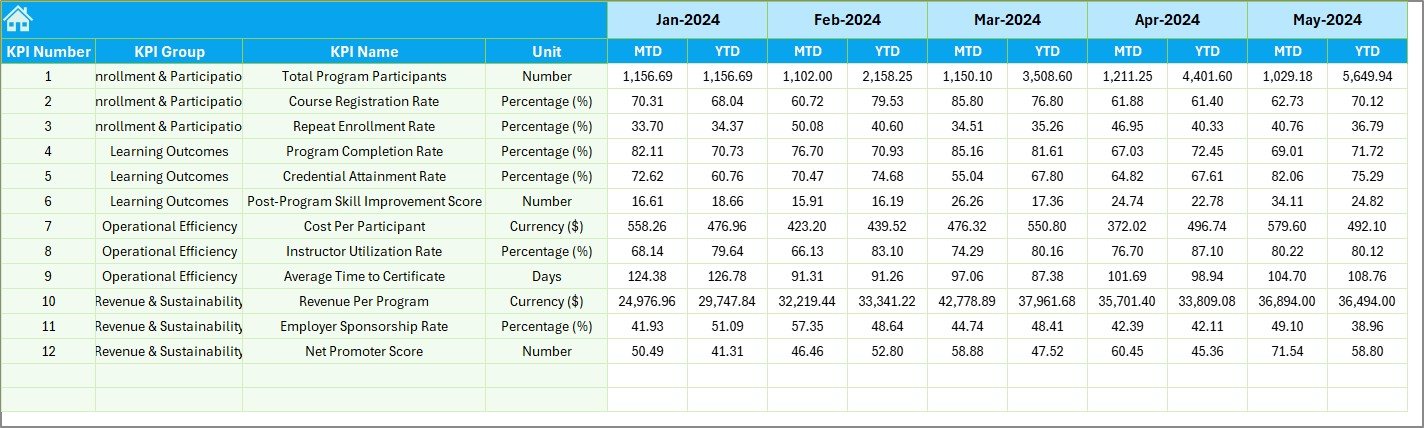
📆 Previous Year Number Sheet — Enter your previous year’s data here in the same format as the current year to enable year-over-year comparisons on the Dashboard and KPI Trend sheets.
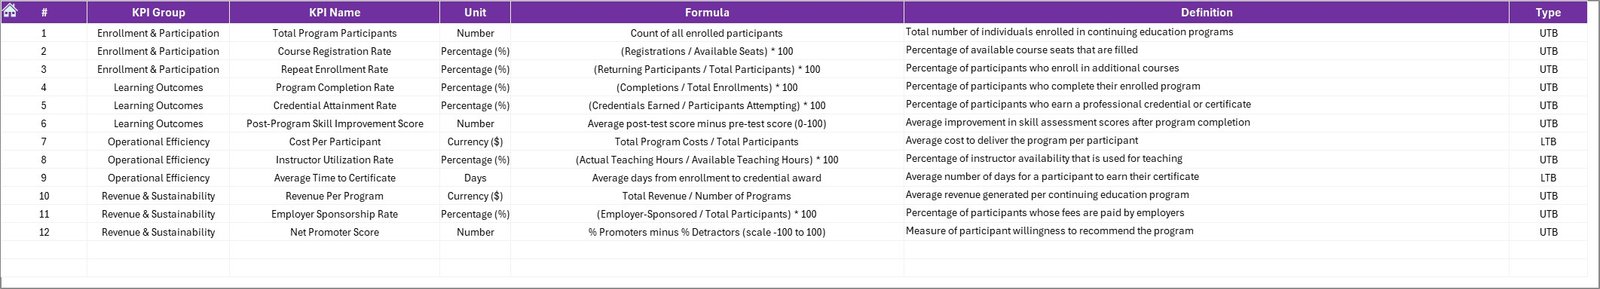
📖 KPI Definition Sheet — Define each KPI with its Name, Group, Unit, Formula, Definition, and Type (LTB — Lower the Better or UTB — Upper the Better). This sheet feeds into the KPI Trend sheet to display contextual information for every metric.
⚙️ How to Use the Continuing Education Programs KPI Dashboard
1️⃣ Open the KPI Definition sheet and enter your KPI names, groups, units, formulas, definitions, and types (LTB or UTB).
2️⃣ Navigate to the Actual Numbers Input sheet, set your fiscal year start month on cell E1, and enter your actual MTD and YTD numbers for each month.
3️⃣ Go to the Target Number Input sheet and enter your target values for each KPI across all months.
4️⃣ Fill in the Previous Year Number sheet with last year’s data to enable year-over-year performance comparisons.
5️⃣ Switch to the Dashboard sheet, select a month from the drop-down on cell D3, and review your complete KPI performance at a glance.
6️⃣ Use the KPI Trend sheet to deep-dive into individual KPI performance trends over time.
👥 Who Can Benefit from This KPI Dashboard?
🎓 Training Institutes and Adult Education Centers — Monitor student enrollment, course completions, and instructor effectiveness across multiple continuing education programs.
🏢 Corporate Learning and Development Teams — Track employee upskilling progress, certification pass rates, and training ROI for compliance and professional development initiatives.
📚 Professional Development Managers — Evaluate program effectiveness, compare budget vs actual spending, and measure learner satisfaction for strategic planning, much like our Space Education Programs KPI Dashboard in Excel.
🏛️ Government and Non-Profit Education Departments — Report on continuing education program KPIs with professional-grade dashboards for stakeholders, funders, and regulatory bodies.
📊 Consultants and Analysts — Deliver polished, ready-to-use KPI dashboards to education-sector clients, similar to our Coding Bootcamps KPI Dashboard.


Reviews
There are no reviews yet.