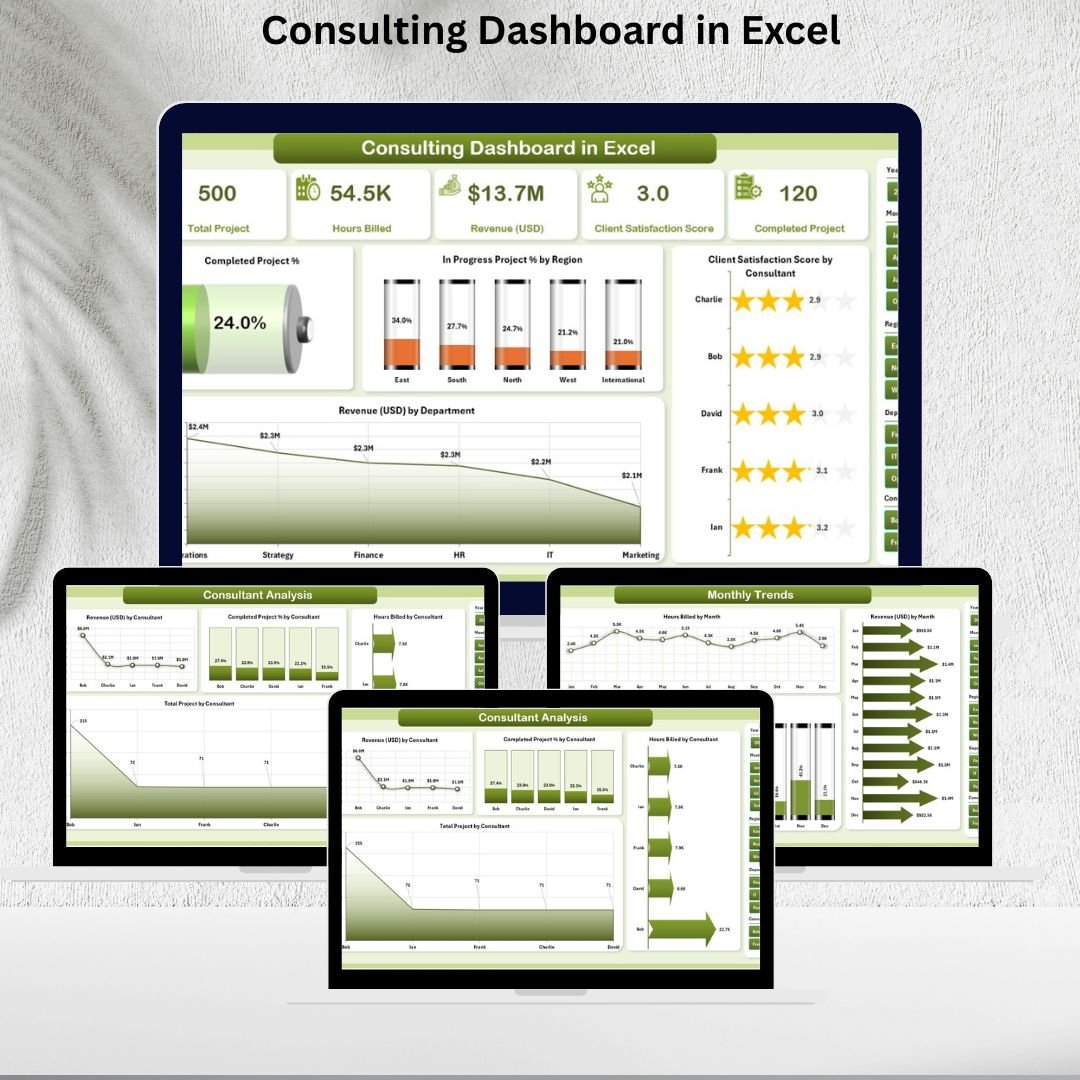
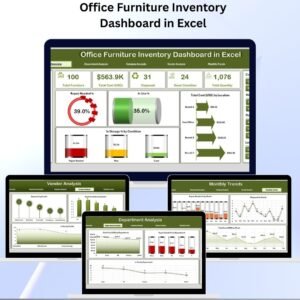
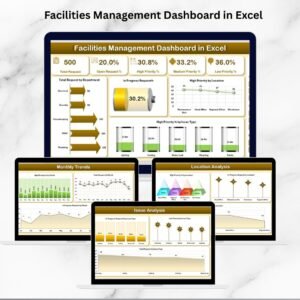
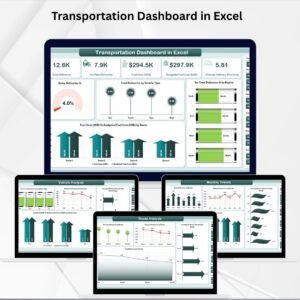
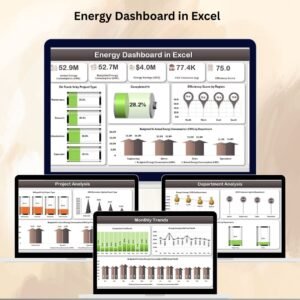
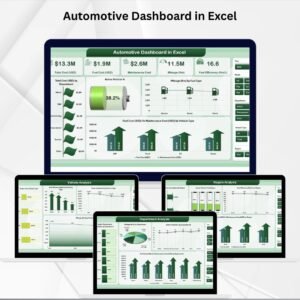
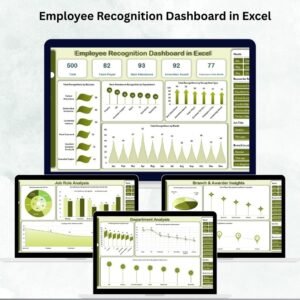
Consulting projects involve multiple clients, departments, and revenue streams—all requiring careful monitoring to ensure profitability and client satisfaction. Tracking all this data manually in scattered spreadsheets is inefficient and prone to errors. That’s why we created the Consulting Dashboard in Excel—a ready-to-use, interactive tool that brings all critical insights into one place.
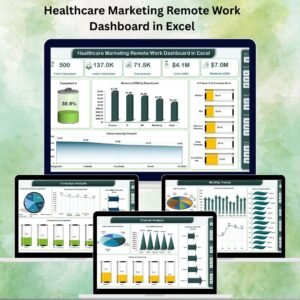
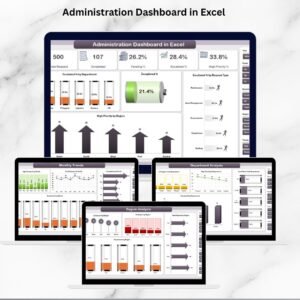
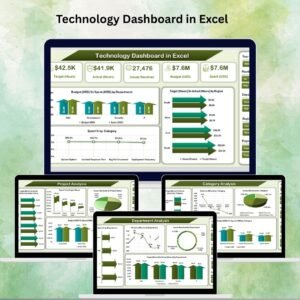
This dashboard helps consultants and managers analyze project performance, client satisfaction, revenue trends, and hours billed—all in a dynamic and visual format. Designed with pivot tables, slicers, and conditional formatting, it transforms raw consulting data into actionable insights for better decision-making.
✨ Key Features of Consulting Dashboard in Excel
-
📊 5 Analytical Pages – Overview, Department, Region, Consultant, and Monthly Trends.
-
🎯 KPI Cards – Track project completion rates, client satisfaction, hours billed, and revenue performance.
-
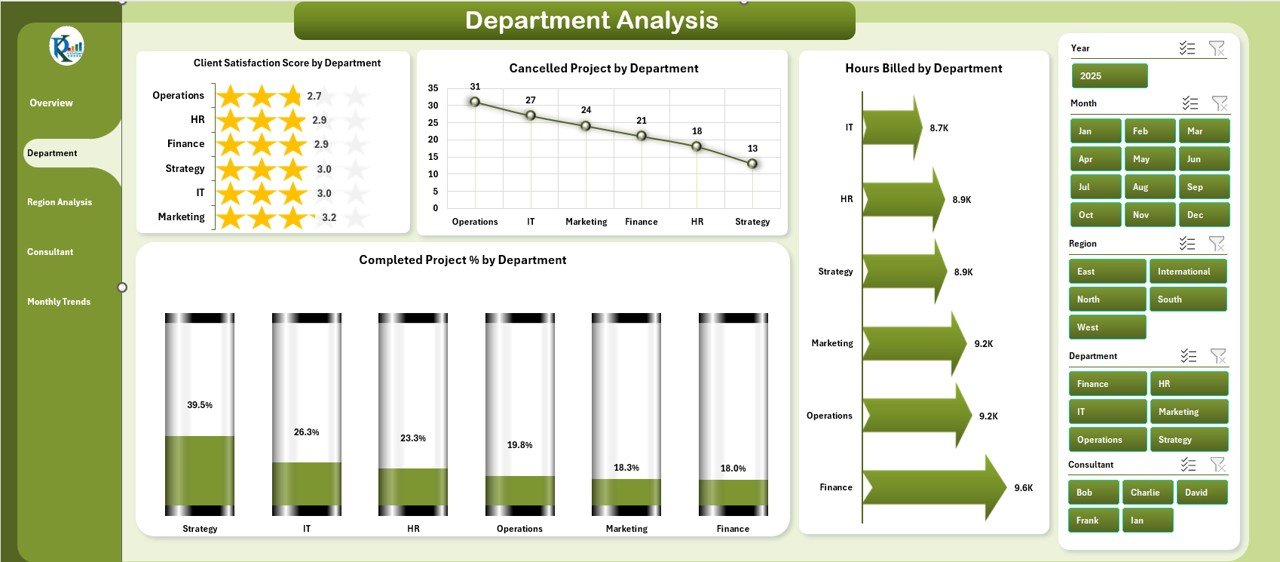
📑 Department Analysis – Compare client satisfaction, hours billed, and project completion by department.
-
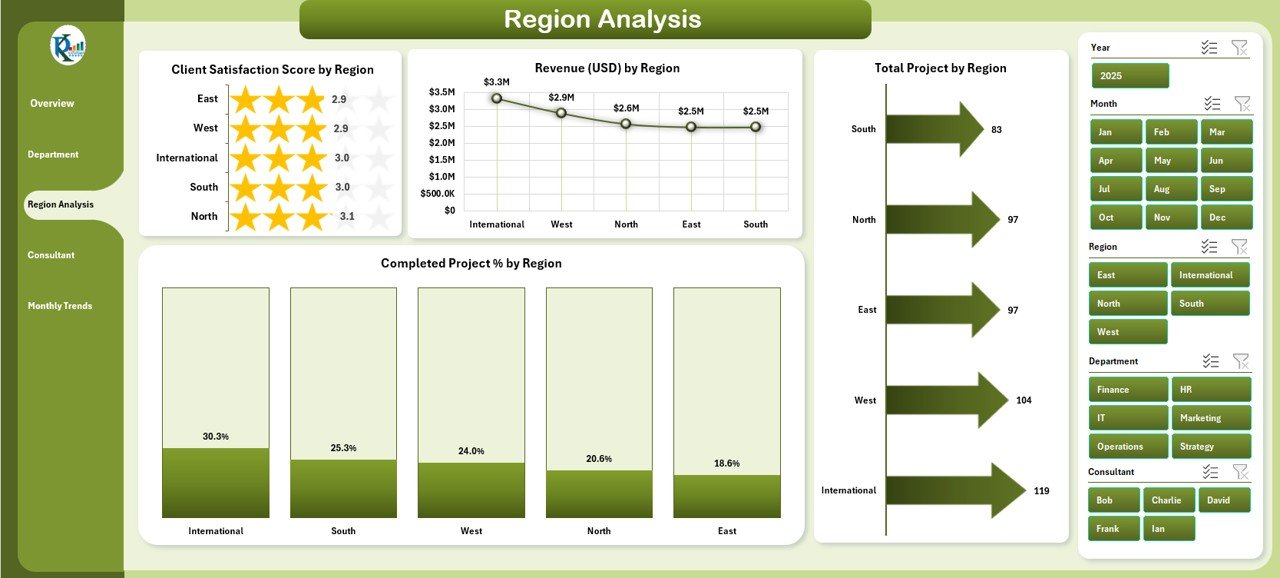
🌍 Region Analysis – Evaluate consulting performance across regions, including revenue and satisfaction scores.
-
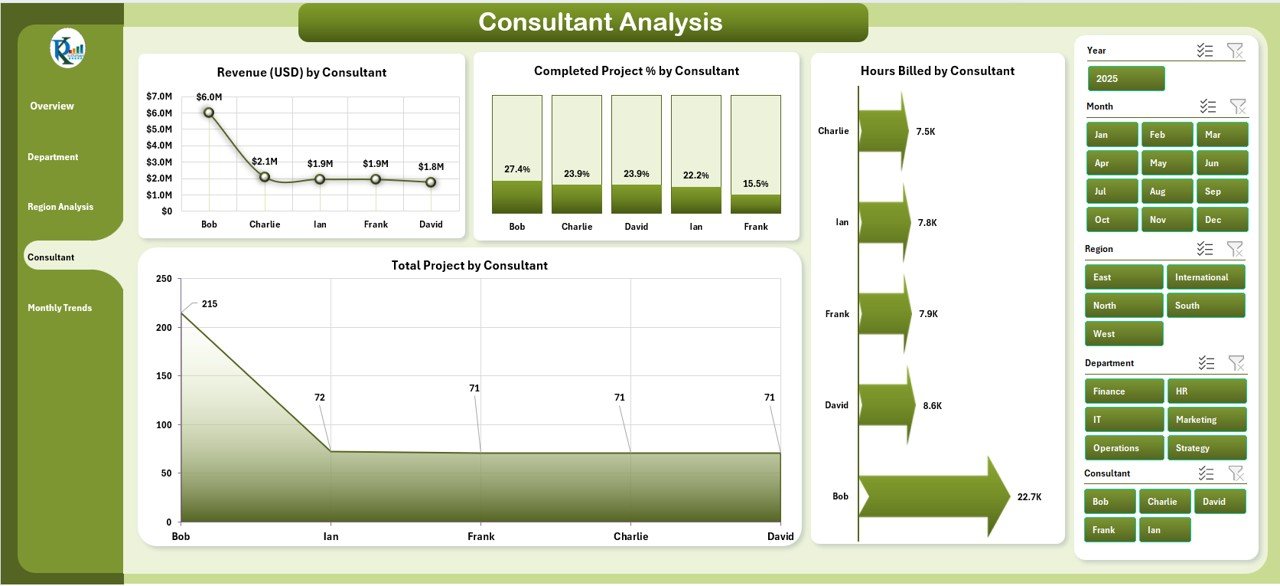
👥 Consultant Analysis – Monitor individual consultant performance on revenue, hours billed, and project delivery.
-
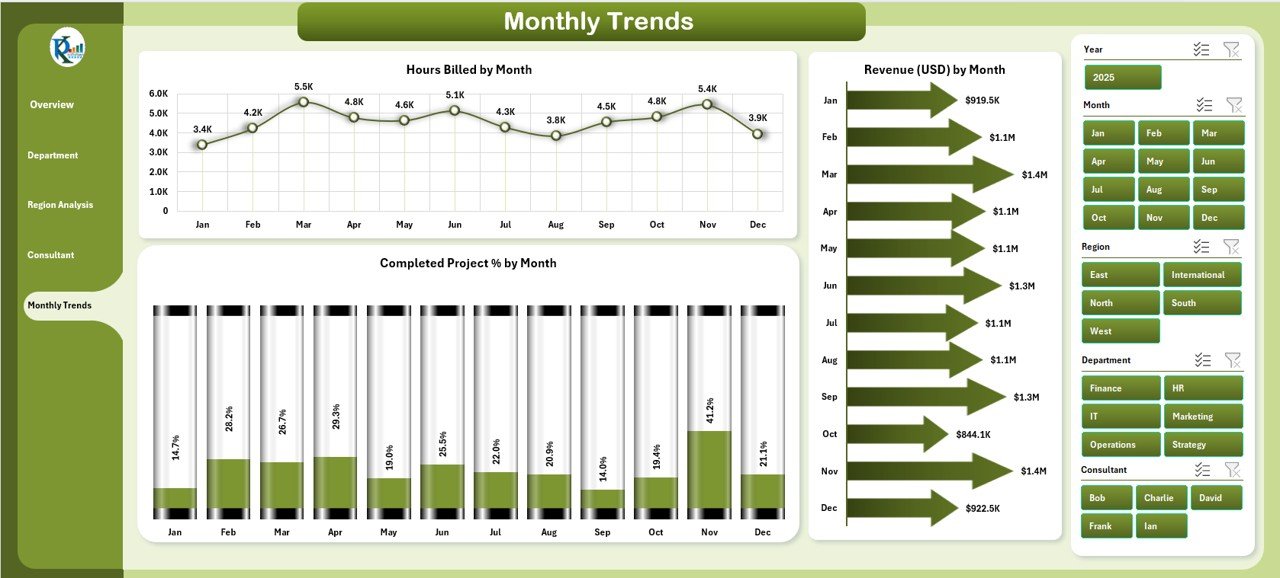
📆 Monthly Trends – Spot seasonal patterns in revenue, hours billed, and project completion.
-
🗂 Support Sheet – Backend data entry sheet for projects, clients, and billing details.
-
⚡ Interactive Slicers – Filter by consultant, department, or region for focused analysis.
-
💰 Cost-Effective – Built entirely in Excel, no extra software costs.
📂 What’s Inside the Dashboard
-
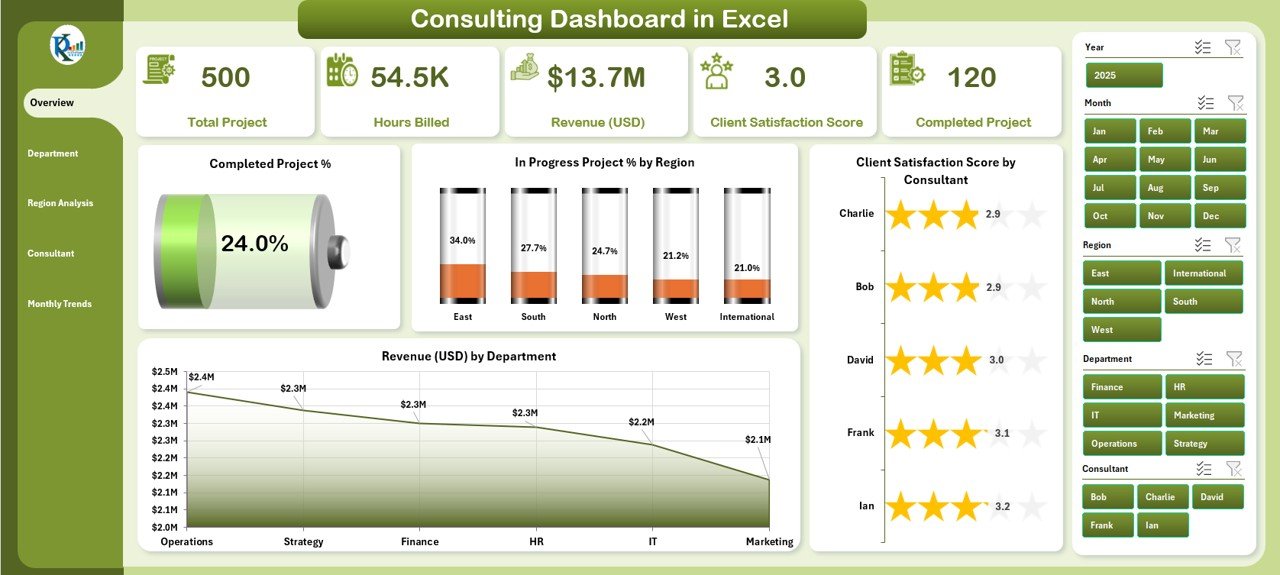
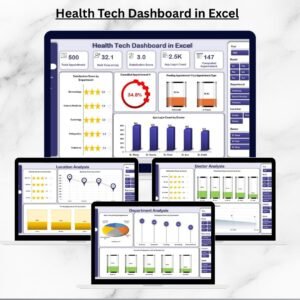
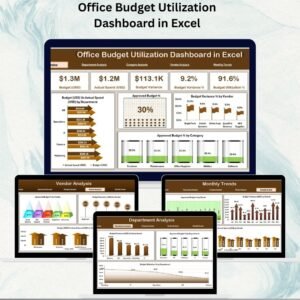
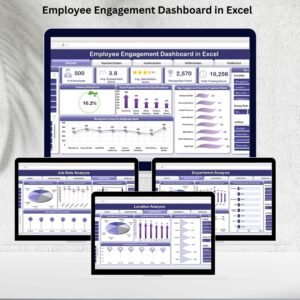
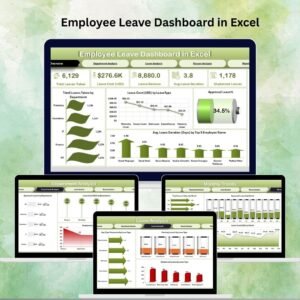
Overview Page – A high-level summary with KPIs and charts like Completed Project %, Client Satisfaction by Consultant, and Revenue by Department.
-
Department Analysis – Compare client satisfaction, hours billed, and completion % across departments.
-
Region Analysis – Visualize regional strengths and revenue contributions.
-
Consultant Analysis – Track consultant-level performance metrics to recognize top performers.
-
Monthly Trends – Understand time-based patterns for forecasting and planning.
-
Support Sheet – Centralized data storage that powers the entire dashboard.
📖 How to Use the Consulting Dashboard
-
Enter Data – Add project details, client ratings, revenue, and hours billed in the Support Sheet.
-
Explore the Overview – Get a snapshot of consulting performance with KPI cards and charts.
-
Drill into Analysis Pages – Use slicers to filter by department, consultant, or region.
-
Review Monthly Trends – Forecast upcoming workload and revenue by analyzing patterns.
-
Act on Insights – Reallocate consultants, improve satisfaction strategies, and optimize resources.
👥 Who Can Benefit from This Dashboard?
-
👔 Management Consulting Firms – Monitor projects, client satisfaction, and departmental KPIs.
-
💻 IT & Technology Consulting – Track project timelines, billed hours, and delivery success.
-
💰 Financial Consulting – Analyze revenue by department, consultant, or client segment.
-
👤 Independent Consultants – Showcase performance and insights to clients with visual dashboards.
-
🏢 Corporate Teams – Manage internal consulting-style projects effectively.
This dashboard empowers professionals to maximize client satisfaction and revenue efficiency.
✅ Click here to read the Detailed blog post
Visit our YouTube channel to learn step-by-step video tutorials


Reviews
There are no reviews yet.