


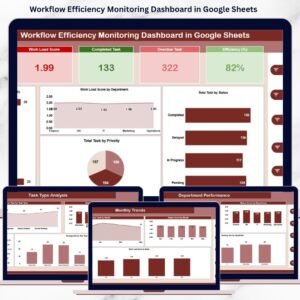
Managing multiple construction projects involves juggling numerous moving parts — from task completion and budget control to contractor performance and on-time delivery. The Construction Progress & Cost Control Dashboard in Google Sheets brings all these elements together into a single, interactive, and real-time platform. 🧱📊
This ready-to-use dashboard is designed for construction managers, project engineers, and financial controllers who want to track actual vs. planned progress, cost variances, and project performance without complex software. Built entirely in Google Sheets, it combines cost control and progress monitoring into one intuitive interface, offering full transparency and actionable insights for decision-making.
With dynamic charts, KPI cards, and automated variance calculations, this dashboard helps ensure projects stay on time and within budget — while keeping teams aligned across departments, contractors, and locations. 💰✅

🔑 Key Features of the Construction Progress & Cost Control Dashboard in Google Sheets
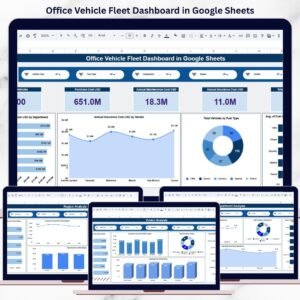
📋 Overview Sheet Tab (Main Dashboard)
-
Displays the overall summary of your construction portfolio.
-
Auto-updates visuals and KPIs based on live data input.
-
Cards Included:
-
Total Tasks
-
Budget (USD)
-
Actual Cost (USD)
-
Cost Variance (USD)
-
Progress (%)
-
-
Charts Included:
-
Total Tasks by Department
-
Cost Variance by Location
-
Budget (USD) vs Actual Cost (USD) by Month
-
Budget (USD) vs Actual Cost (USD) by Status
-
📈 Department Summary Tab
-
View project performance at the departmental level.
-
Charts Included:
-
Progress (%) by Department
-
Cost Variance by Department
-
Budget vs Actual Cost by Department
-
On-Time Task vs Delayed Task by Department
-
👷♂️ Contractor Performance Tab
-
Evaluate contractor efficiency and cost performance.
-
Charts Included:
-
Progress (%) by Contractor
-
Budget vs Actual Cost by Contractor
-
On-Time vs Delayed Tasks by Contractor
-
Cost Variance by Contractor
-
📍 Location Analysis Tab
-
Compare progress and expenses across multiple project locations.
-
Charts Included:
-
Progress (%) by Location
-
Budget vs Actual Cost by Location
-
On-Time vs Delayed Tasks by Location
-
Cost Variance by Location
-
🔎 Search Sheet Tab
-
Quickly locate specific project details using keyword-based search.
-
Examples:
-
Enter “Electrical Work” to view all tasks in that category.
-
Enter “Contractor A” to display their cost and performance details.
-
🧾 Data Sheet Tab
-
Acts as the input source where all project data is stored.
-
Supports fields like Department, Location, Contractor, Planned vs Actual Dates, Budget, Actual Cost, and Progress (%).
-
Automatically updates all charts and KPIs upon data entry.
📦 What’s Inside the Dashboard
✅ Pre-built Google Sheets dashboard with 6 analytical tabs
✅ Automated cost variance and progress tracking formulas
✅ Dynamic charts and KPI cards
✅ Search-enabled record lookup system
✅ Fully editable structure — add more data fields as needed
✅ Cloud collaboration with real-time updates
✅ Plug-and-play usability — no coding required
With this dashboard, project teams can analyze performance from every angle — cost, schedule, contractor, and location — in minutes.
🧑💼 Who Can Benefit from This Dashboard
🏗️ Construction Managers – Monitor project completion and budget adherence.
💼 Financial Controllers – Track spending patterns and cost variances.
👷♂️ Site Engineers – Log progress and ensure deadlines are met.
📊 Project Directors – Gain complete visibility into multiple ongoing projects.
🏢 Contracting Firms & Developers – Evaluate performance, efficiency, and profitability across sites.
Whether it’s a single high-rise project or a multi-site infrastructure operation, this dashboard provides the insight and clarity your team needs.
🧪 How to Use the Construction Progress & Cost Control Dashboard
1️⃣ Enter Project Data: Add tasks, costs, and progress in the Data Sheet tab.
2️⃣ Analyze Overview: Review KPIs and charts in the Overview tab for quick insights.
3️⃣ Drill Down: Use Department, Contractor, or Location tabs for detailed performance analysis.
4️⃣ Use Search: Instantly locate any project record by keyword or field name.
5️⃣ Review Monthly: Monitor trends in Budget vs Actual Cost and progress rates to prevent overruns.
🌟 Why Choose This Dashboard
-
Combines progress tracking and cost control in one tool
-
Offers real-time insights for timely project decisions
-
Improves team accountability and communication
-
Provides customizable visuals to fit any project structure
-
Supports multiple users through cloud-based collaboration
-
Saves time, reduces manual reporting, and improves cost discipline
The Construction Progress & Cost Control Dashboard in Google Sheets is your one-stop solution for managing timelines, budgets, and contractor performance — empowering your team to deliver successful projects every time. 🌟
🔗 Click here to read the Detailed blog post
Watch the step-by-step video Demo:


Reviews
There are no reviews yet.