

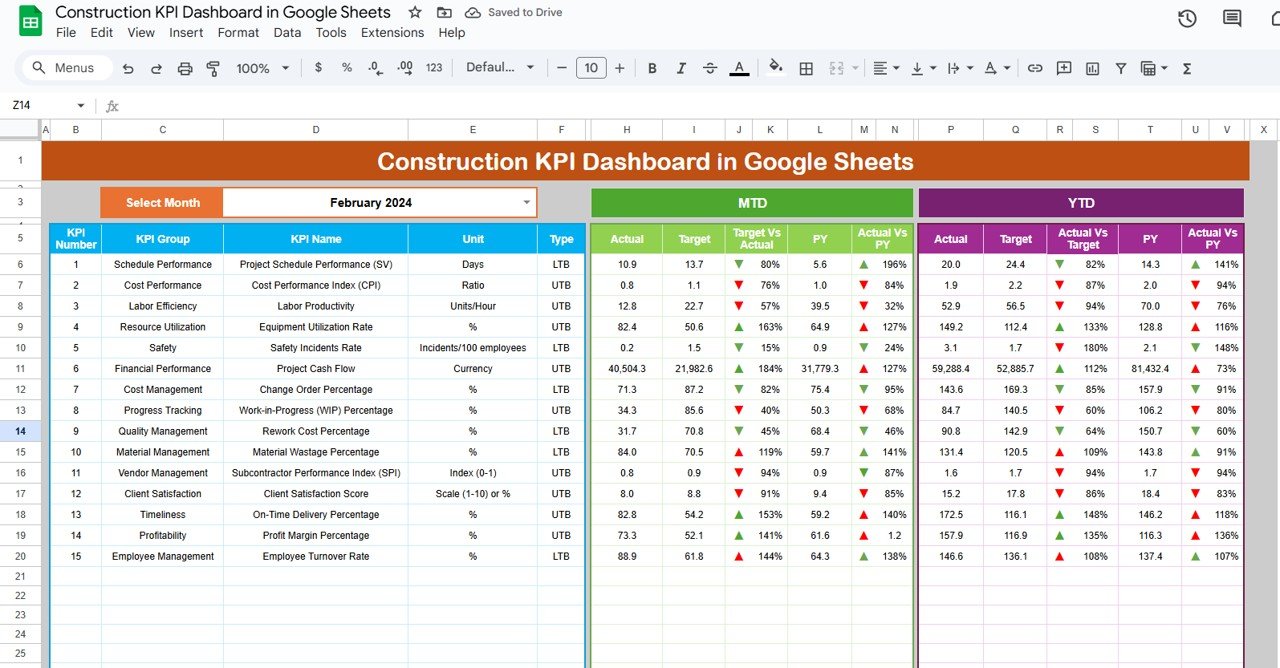


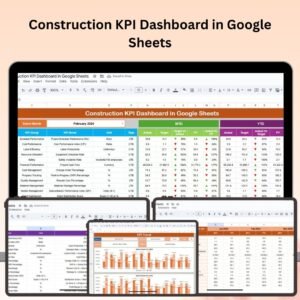
The Construction KPI Dashboard in Google Sheets is a powerful tool designed for construction managers, project coordinators, and business owners who want to track, analyze, and optimize key performance indicators (KPIs) in their construction projects. This easy-to-use dashboard provides real-time insights into essential metrics like project progress, budget management, resource allocation, safety performance, and more.
Whether you’re managing a single project or overseeing multiple construction sites, this Google Sheets dashboard allows you to streamline your project management efforts, improve decision-making, and ensure that projects are completed on time and within budget.

Key Features of the Construction KPI Dashboard in Google Sheets:
 Project Progress Tracking
Track the completion status of tasks, milestones, and phases to monitor overall project progress. Stay on top of deadlines and identify any delays early.
 Budget and Cost Management
Monitor your project budget, track expenses, and compare actual costs with planned costs to ensure that your projects stay within financial limits.
 Resource Allocation and Utilization
Analyze labor, equipment, and material usage to optimize resource allocation. Ensure that all resources are used efficiently to maximize productivity.
 Safety and Compliance Metrics
Track safety incidents, compliance checks, and worker safety KPIs to ensure that all construction sites meet legal requirements and maintain a safe working environment.
 Customizable Reporting
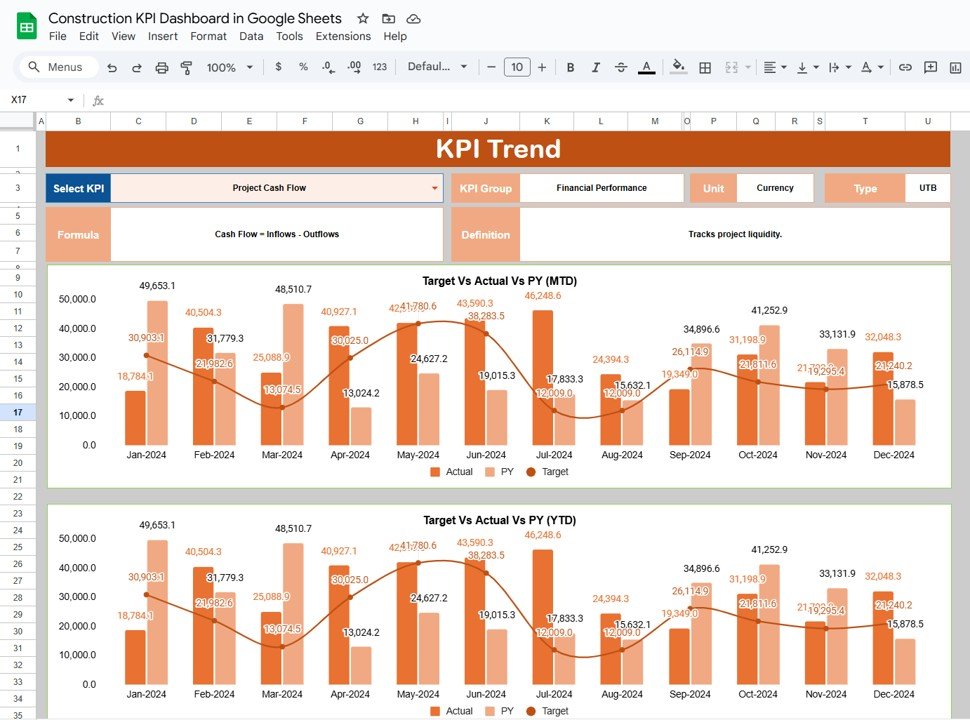
Create tailored reports to present your project performance metrics to stakeholders, contractors, and clients, making communication simple and efficient.
 Why You’ll Love the Construction KPI Dashboard in Google Sheets:
 Comprehensive Project Tracking – Track multiple construction projects simultaneously, including project phases, task completion, and overall progress. Real-Time Budget Monitoring – Track and compare actual expenses against the budget in real time to avoid overspending and ensure profitability. Optimize Resource Usage – Improve resource management by tracking material, labor, and equipment usage, ensuring efficient allocation and minimizing waste. Ensure Safety Compliance – Track safety incidents and monitor safety KPIs to maintain a safe working environment and comply with legal regulations. Customizable and User-Friendly – This Google Sheets dashboard is easy to customize, so you can adjust it to suit your specific project needs. It’s also simple to navigate, even for beginners. Make Informed Decisions – Use real-time data to make informed decisions and keep your projects on track, within budget, and in line with safety regulations.
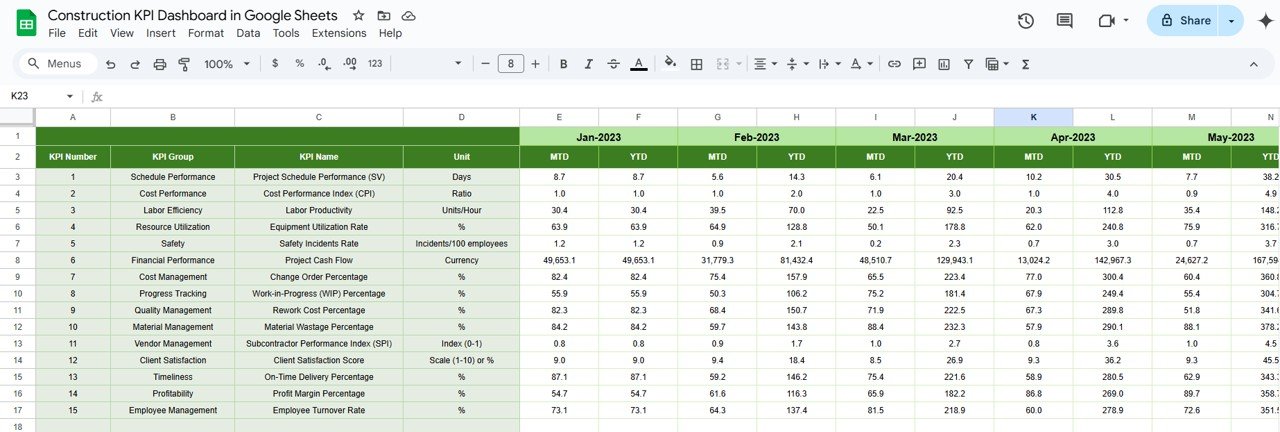
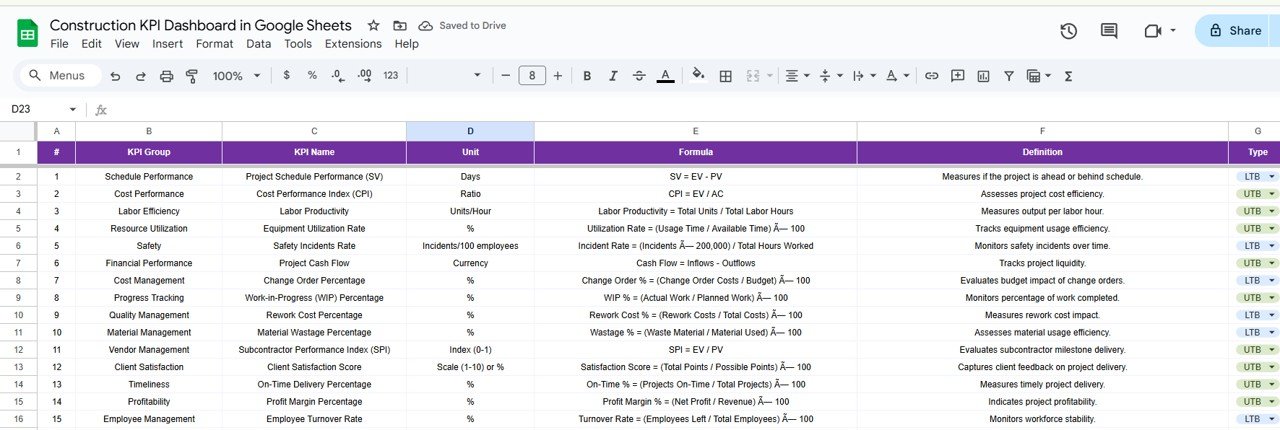
What’s Inside the Construction KPI Dashboard in Google Sheets:
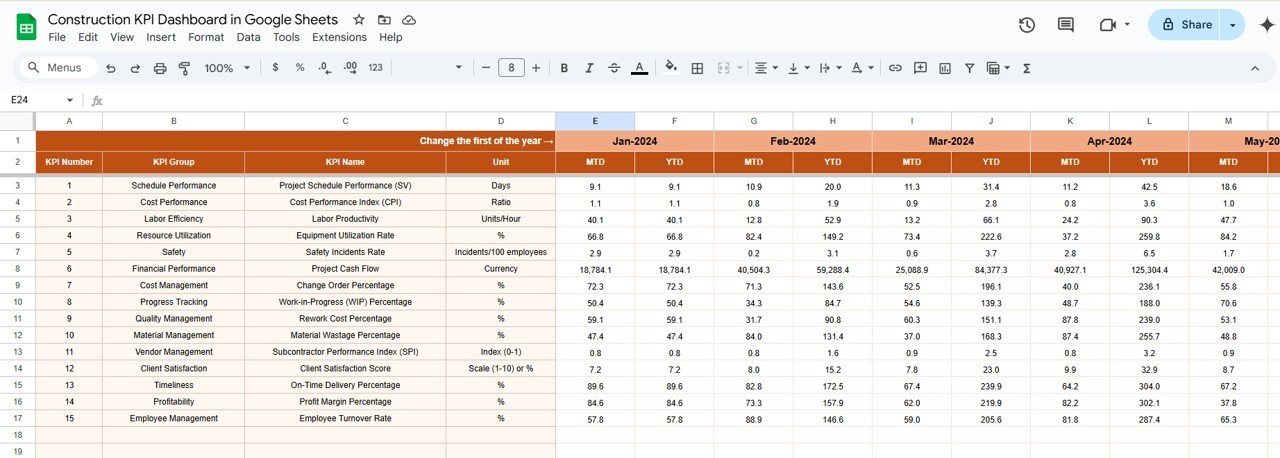
- Project Milestones Tracker: Track the completion of key project milestones and deadlines to monitor overall progress.
- Budget and Cost Tracking: Monitor budget allocations, compare planned vs. actual expenses, and stay on top of costs throughout the project.
- Resource Allocation: Analyze labor, material, and equipment usage to ensure optimal resource distribution.
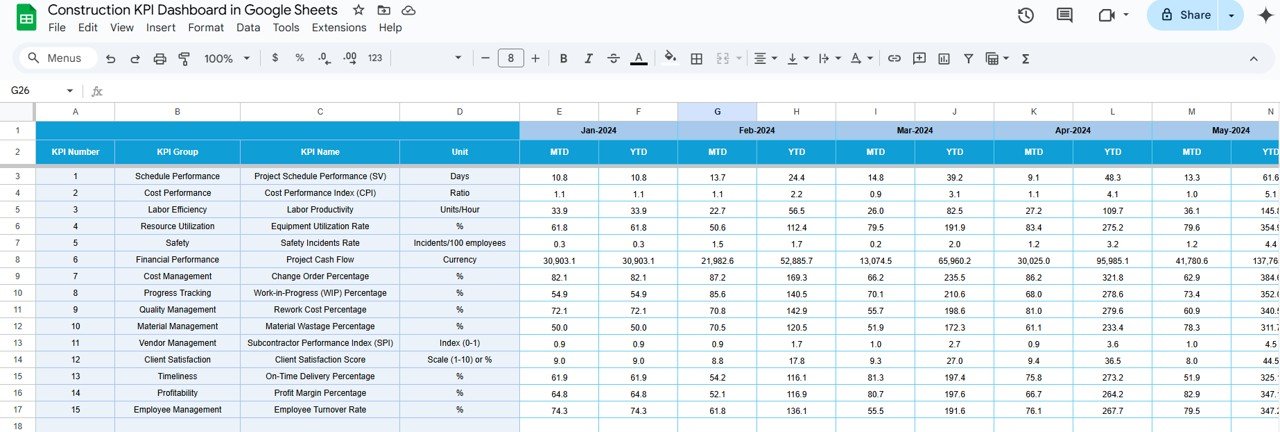
- Safety Performance: Track safety incidents, OSHA compliance, and other key safety metrics to maintain a safe work environment.
- Custom Reports and Dashboards: Create visual reports and dashboards to easily communicate project performance to stakeholders.
How to Use the Construction KPI Dashboard in Google Sheets:
 Download the Template – Instantly access your Google Sheets template upon purchase.
 Input Project Data – Enter your project milestones, cost details, resource usage, and safety metrics into the dashboard.
 Monitor Key Metrics – Track KPIs such as task completion, budget, resource allocation, and safety performance.
 Analyze and Adjust – Use the real-time insights to make data-driven decisions, optimize resource usage, and adjust timelines or budgets as needed.
 Generate Reports – Create customized reports and share them with stakeholders, clients, or project teams to showcase progress and performance.
Who Can Benefit from the Construction KPI Dashboard in Google Sheets:
- Construction Managers
- Project Coordinators
- General Contractors
- Site Supervisors
- Business Owners in the Construction Industry
- Project Owners and Stakeholders
- Budget Analysts
- Safety Officers
The Construction KPI Dashboard in Google Sheets is the ideal tool for anyone managing construction projects, from small renovations to large-scale developments. It helps streamline operations, ensure projects stay within budget, and maintain a high level of safety and efficiency.
Click here to read the Detailed blog post
https://neotechnavigators.com/construction-kpi-dashboard-in-google-sheets/
Visit our YouTube channel to learn step-by-step video tutorials
Youtube.com/@PKAnExcelExpert


Reviews
There are no reviews yet.