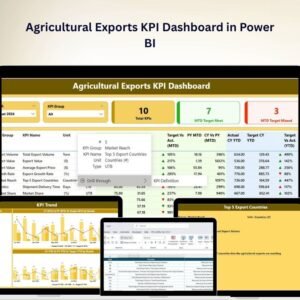
The Climate Action KPI Dashboard in Power BI is a powerful tool designed to help organizations track and monitor their climate action initiatives. This Power BI-based dashboard provides real-time insights into key performance indicators (KPIs) related to climate action, such as carbon emissions, energy usage, sustainability goals, and environmental impact.
With this interactive dashboard, organizations can measure and visualize their progress towards reducing their carbon footprint, improving energy efficiency, and achieving environmental sustainability. Whether you’re tracking progress on climate targets, reporting to stakeholders, or ensuring compliance with climate policies, this dashboard offers the tools you need to make data-driven decisions and improve your climate action strategies.
Key Features of the Climate Action KPI Dashboard in Power BI
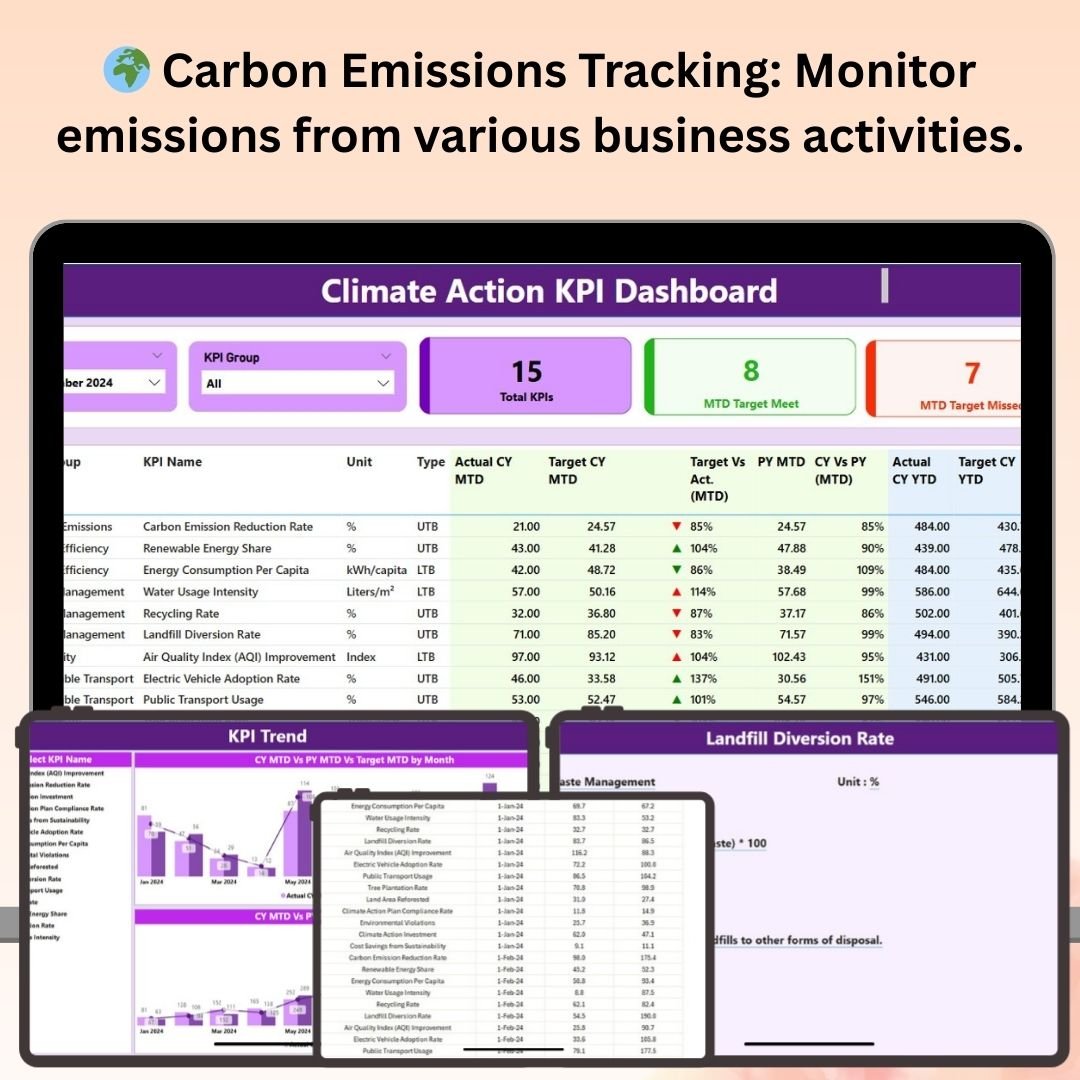
🌍 Carbon Emissions Tracking
Monitor and track your organization’s carbon emissions, including direct and indirect emissions from various activities. Analyze how different areas of your business contribute to your carbon footprint and identify opportunities for reduction.
⚡ Energy Consumption Analysis
Track energy usage across different departments, processes, and facilities. Identify patterns in energy consumption, analyze efficiency, and pinpoint areas where energy-saving strategies can be implemented.
📊 Sustainability Goal Monitoring
Set and monitor sustainability goals related to carbon emissions reduction, energy savings, waste reduction, and other climate-related targets. Use the dashboard to evaluate your progress and adjust strategies as needed.
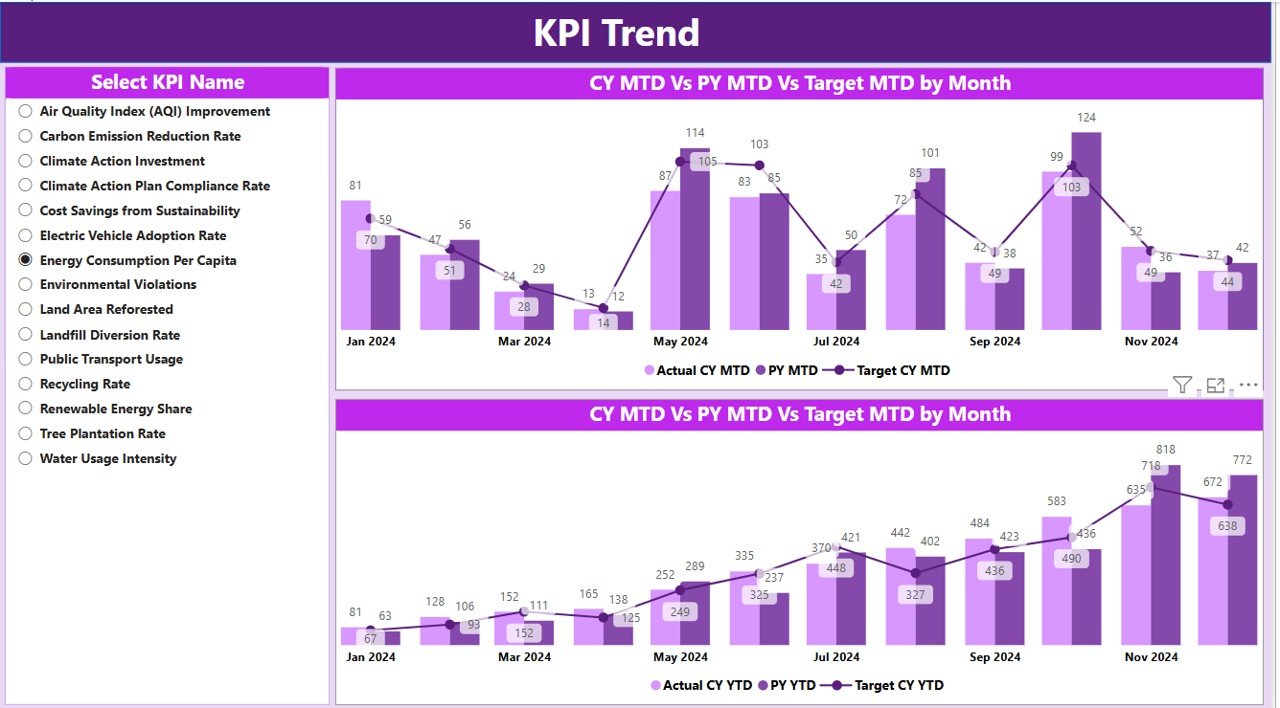
📅 Time-Based Performance Analysis
Analyze your climate action performance over time, including monthly, quarterly, and yearly data. Identify trends, successes, and areas needing improvement to stay on track with your sustainability objectives.
🔄 Customizable KPIs & Metrics
Customize the dashboard to reflect your organization’s specific climate action initiatives. Track a variety of KPIs, from energy use to waste management, and adapt the dashboard to meet your goals.
📈 Data Visualization & Reporting
Easily visualize your data with dynamic charts, graphs, and tables. Present your climate action performance clearly to stakeholders, regulatory bodies, and the public, enhancing transparency and accountability.
Why You’ll Love the Climate Action KPI Dashboard in Power BI
✅ Comprehensive Climate Monitoring
Track all of your climate action metrics in one centralized location. Monitor your carbon emissions, energy consumption, and sustainability efforts to assess your environmental impact.
✅ Real-Time Insights & Reporting
Stay up-to-date with real-time data tracking. The dashboard automatically updates as new data is entered, ensuring you always have the most accurate information available for decision-making.
✅ Data-Driven Decision Making
Leverage the dashboard’s data-driven insights to optimize your climate action strategies. Use the performance data to identify inefficiencies and improve sustainability efforts.
✅ Customizable & Scalable
Tailor the dashboard to your unique climate goals and KPIs. Track different sustainability metrics across various areas of your business and customize the dashboard to reflect your specific needs.
✅ Transparent & Professional Reporting
Generate clear, professional reports to communicate your climate action progress to stakeholders. Use the visuals to demonstrate how your organization is meeting its climate goals and environmental commitments.
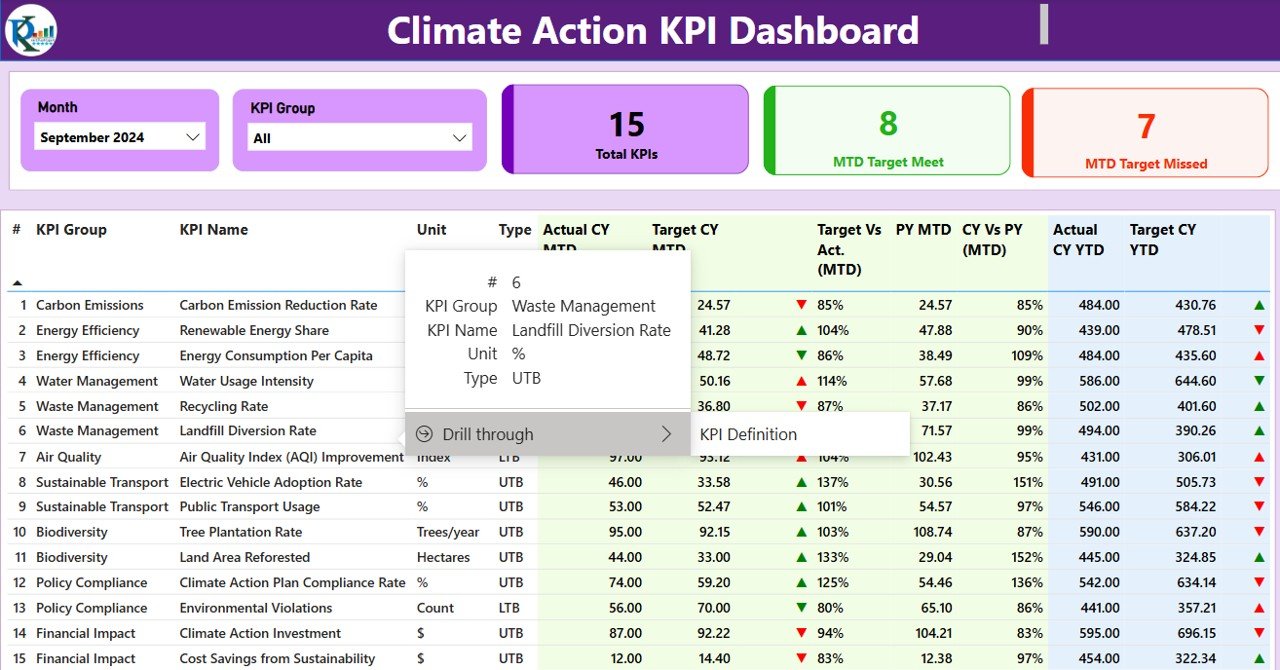
What’s Inside the Climate Action KPI Dashboard in Power BI?
- Carbon Emissions Tracking: Monitor your organization’s carbon emissions and identify reduction opportunities.
- Energy Consumption Monitoring: Analyze energy usage and improve efficiency.
- Sustainability Goal Tracking: Set and track progress towards sustainability goals.
- Time-Based Performance Analysis: Monitor your climate action efforts over different periods.
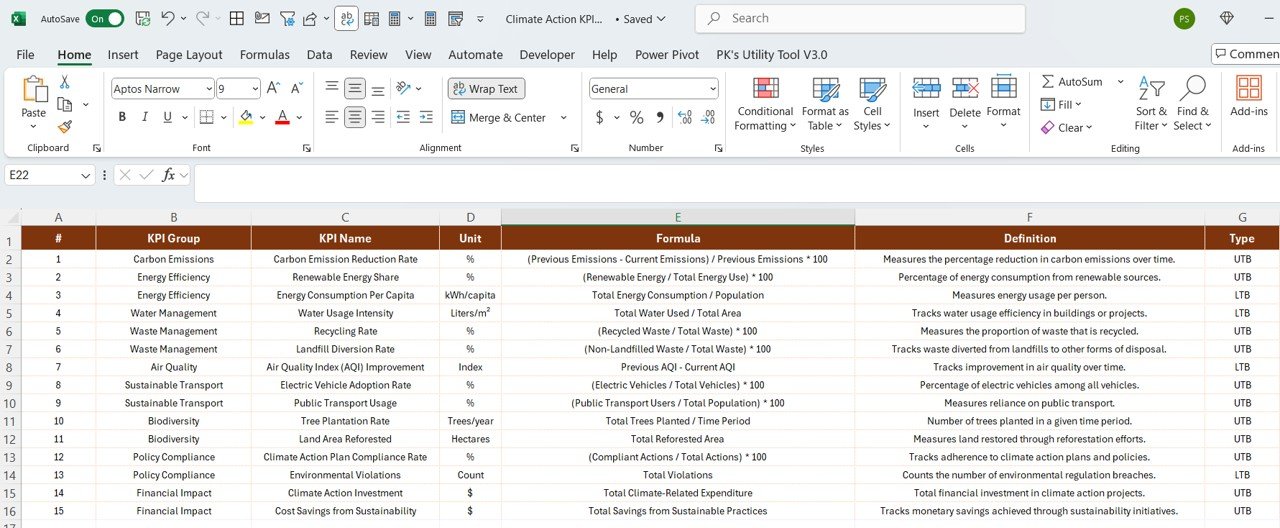
- Customizable KPIs & Metrics: Tailor the dashboard to reflect your organization’s climate action objectives.
- Data Visualization & Reporting: Present your data clearly with charts, graphs, and reports.
How to Use the Climate Action KPI Dashboard in Power BI
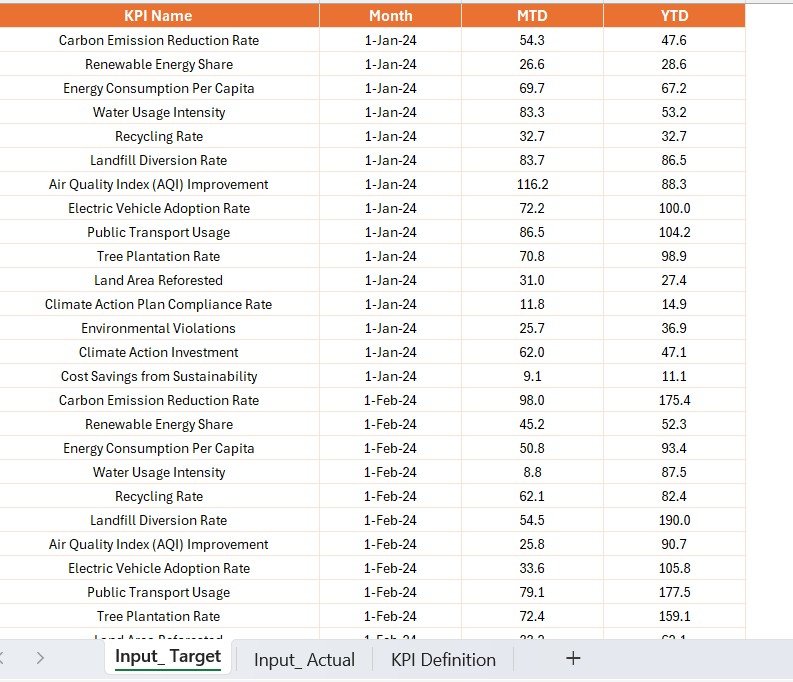
1️⃣ Download the Template: Instantly access the Climate Action KPI Dashboard in Power BI.
2️⃣ Set Up Your Climate Goals: Input your sustainability goals, such as carbon emissions reduction targets and energy-saving objectives.
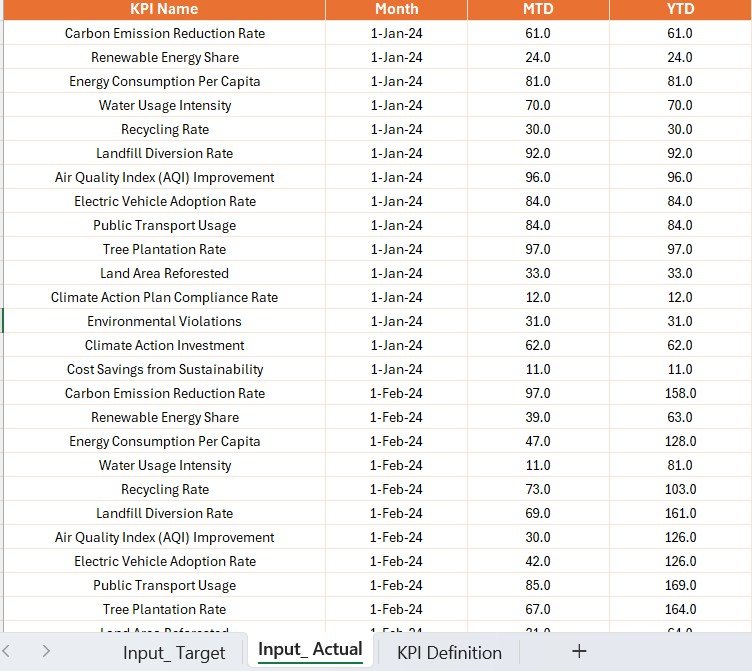
3️⃣ Track Key Metrics: Monitor carbon emissions, energy consumption, and other climate action data.
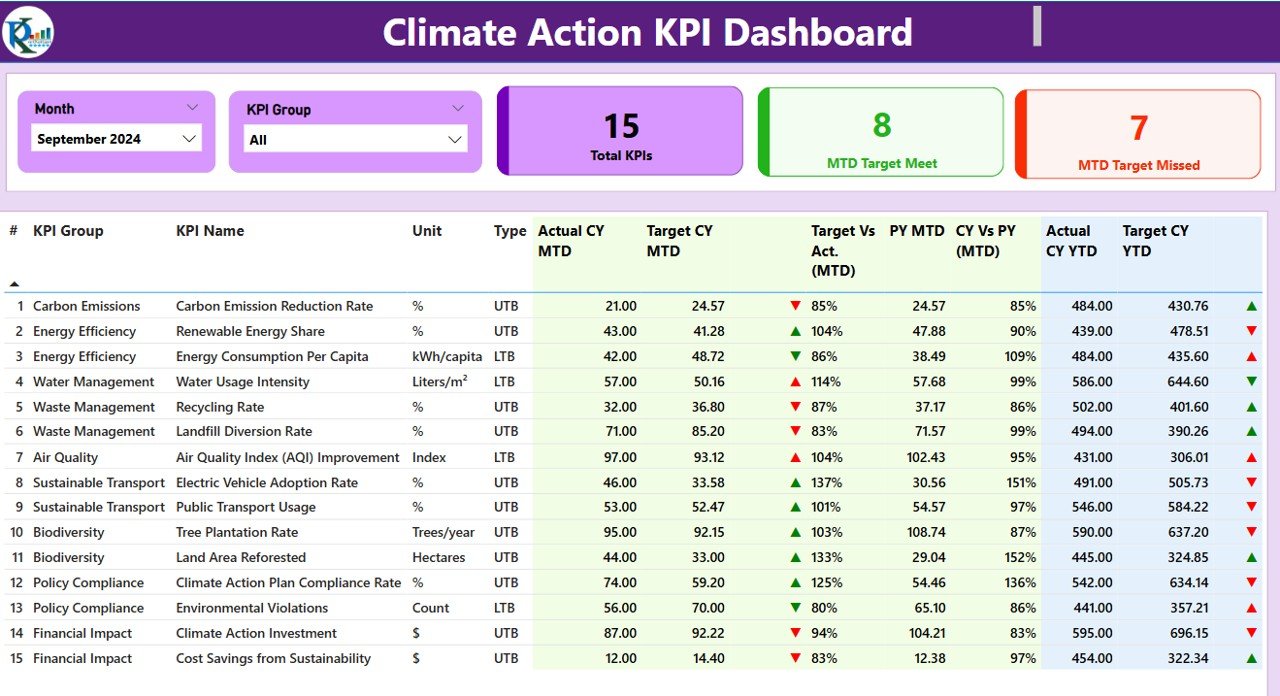
4️⃣ Analyze & Visualize Data: Use the dynamic visuals to analyze performance and track progress.
5️⃣ Generate Reports: Present your findings to stakeholders and use the insights to optimize your climate action strategy.
Who Can Benefit from the Climate Action KPI Dashboard in Power BI?
🔹 Environmental Managers & Sustainability Teams
🔹 Corporations & Enterprises Focused on Sustainability
🔹 Nonprofits & Environmental Organizations
🔹 Energy Efficiency Consultants
🔹 Government & Regulatory Bodies
🔹 Companies with Climate Action Goals
🔹 Data Analysts & Climate Action Advocates
Ensure your organization is on track to meet its climate goals with the Climate Action KPI Dashboard in Power BI. Monitor your environmental impact, track sustainability performance, and optimize strategies for a more sustainable future.
Click here to read the Detailed blog post
Visit our YouTube channel to learn step-by-step video tutorials
Youtube.com/@PKAnExcelExpert


Reviews
There are no reviews yet.