The cannabis industry is growing faster than ever 🌱📈. With legalization expanding and consumer demand rising, businesses face new challenges in compliance, efficiency, and profitability. To stay ahead, cannabis companies need more than spreadsheets—they need real-time visibility and actionable insights. That’s where the Cannabis Industry KPI Dashboard in Power BI comes in.
This ready-to-use dashboard transforms your raw data into powerful, interactive visuals. Built on Excel inputs + Power BI reporting, it consolidates all your KPIs in one place, saving time, improving decision-making, and ensuring compliance. Whether you’re a grower, distributor, or retailer, this tool helps you track performance, reduce risks, and drive growth.
✨ Key Features of Cannabis Industry KPI Dashboard
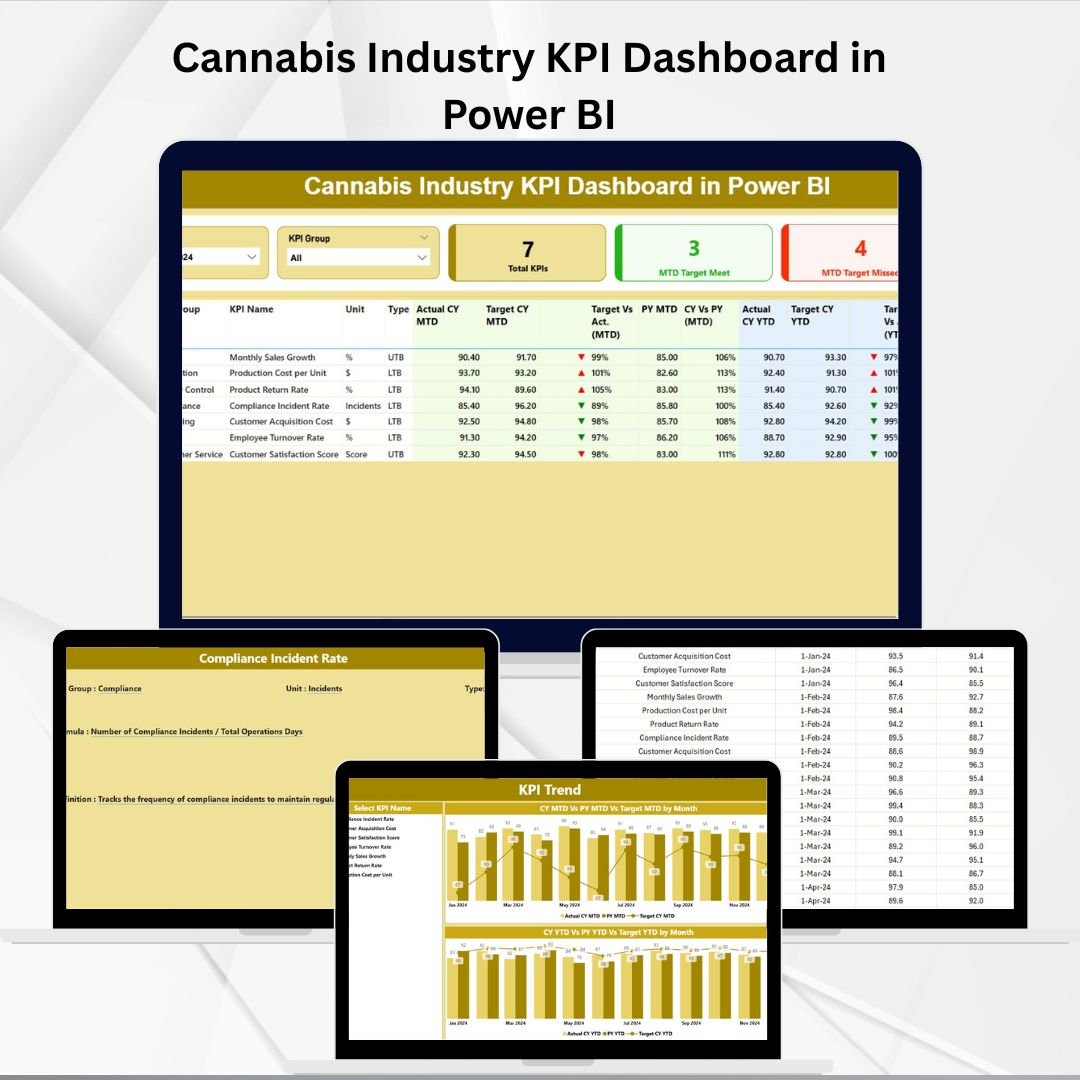
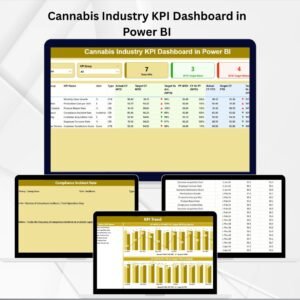
✅ 3 Core Dashboard Pages – Summary, KPI Trend, and KPI Definition.
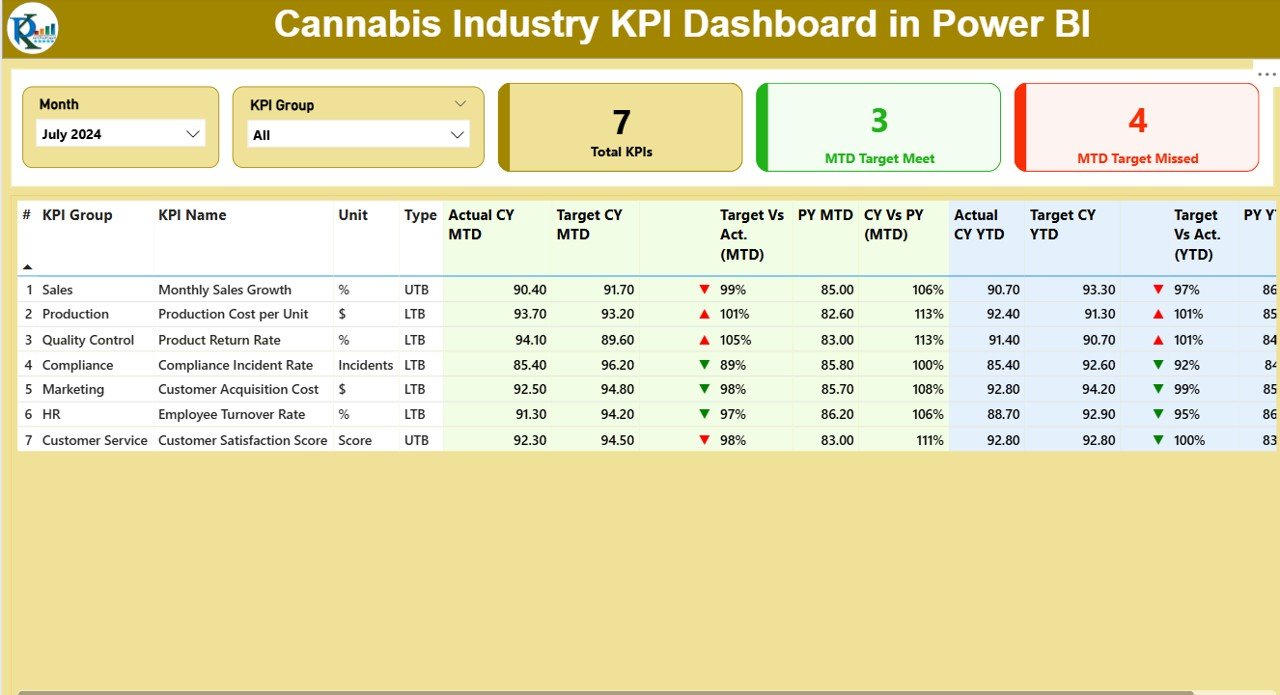
✅ Summary Page – High-level view with slicers (Month, KPI Group), KPI cards, and a detailed table showing MTD & YTD performance.
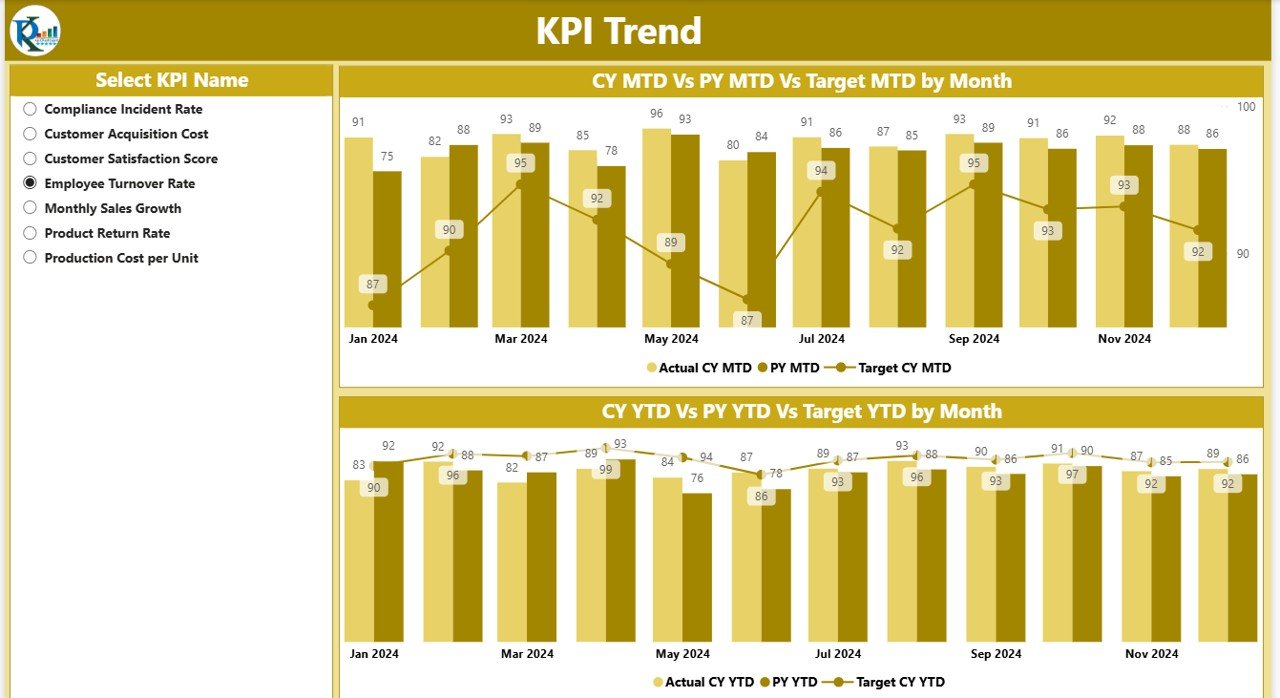
✅ KPI Trend Page – Combo charts comparing Actual vs Target vs Previous Year values. Drill into individual KPIs with slicers.
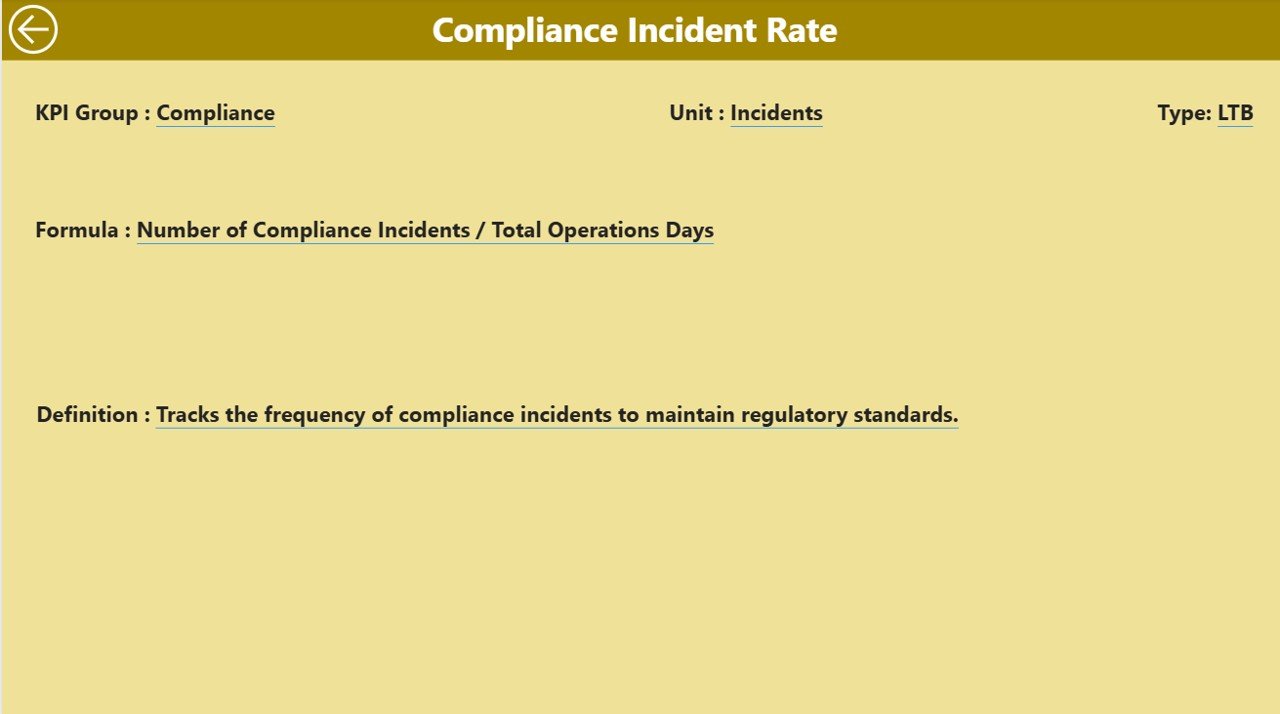
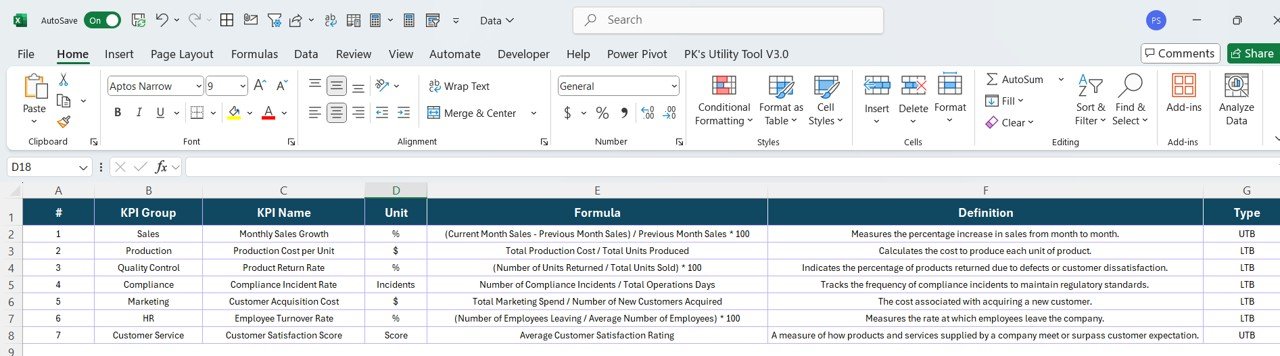
✅ KPI Definition Page – Transparent formulas, definitions, units, and KPI groups for clarity.
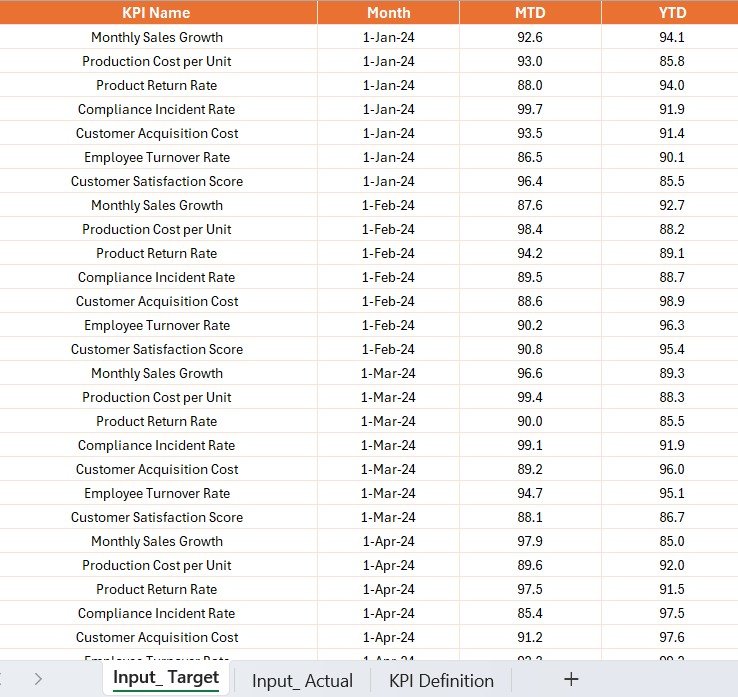
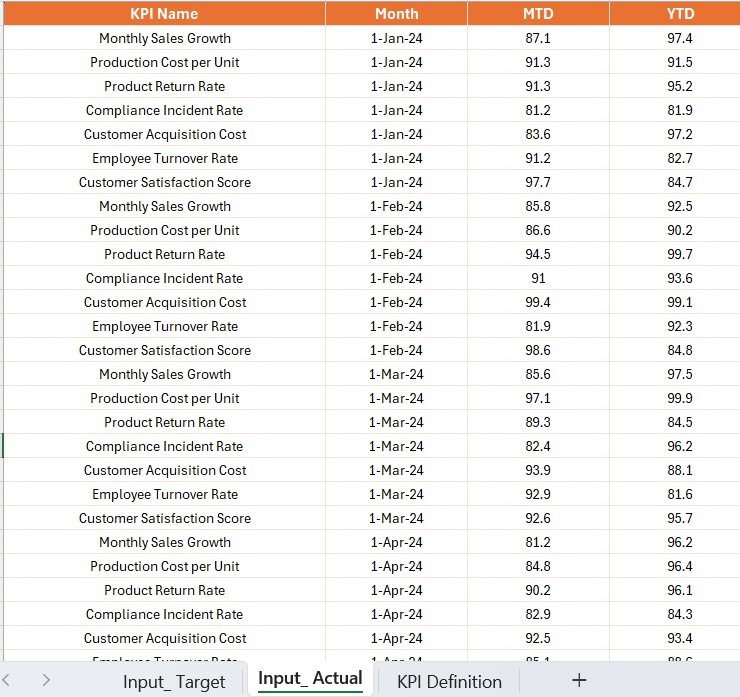
✅ Excel Data Input – Structured sheets for Actual, Target, and KPI Definitions.
✅ Status Indicators – Green ▲ or Red ▼ icons to show performance vs target.
✅ Compliance Ready – Designed to track KPIs critical for regulatory standards.
✅ Customizable – Easily modify KPI definitions or add new ones to match your business.
📊 What’s Inside the Cannabis Industry KPI Dashboard in Power BI
When you download the template, you get a complete reporting system powered by Excel and visualized in Power BI:
-
Summary Page – KPI cards + detailed table with MTD & YTD comparisons vs targets & last year.
-
KPI Trend Page – Visualize performance trends across time with combo charts.
-
KPI Definition Page – Drill-through details on each KPI formula, definition, and unit.
-
Excel Input Sheets:
-
Input_Actual – Enter monthly MTD & YTD actuals.
-
Input_Target – Define your targets.
-
KPI Definition – Record KPI names, groups, units, formulas & types.
-
🛠️ How to Use the Cannabis Industry KPI Dashboard
1️⃣ Update Excel Data – Fill in Actuals, Targets, and KPI definitions.
2️⃣ Refresh Power BI – Load the updated Excel sheets.
3️⃣ Analyze KPIs – Use slicers to drill down by group, KPI, or month.
4️⃣ Compare Trends – Review MTD & YTD progress against targets and previous year.
5️⃣ Take Action – Identify inefficiencies, compliance risks, or growth opportunities.
No advanced technical knowledge needed—basic Excel and Power BI skills are enough ✅.
👥 Who Can Benefit from This Dashboard
🌿 Growers – Track cultivation yield, costs, and efficiency.
🚚 Distributors – Monitor logistics, compliance, and delivery performance.
🏬 Retailers – Measure sales, customer trends, and product returns.
💼 Executives – Get a big-picture view of compliance, profitability, and KPIs.
📊 Finance Teams – Compare operational costs vs revenue and optimize budgets.
🛡️ Regulatory Officers – Track compliance KPIs for audits and approvals.
This dashboard is designed for any cannabis business that values performance, compliance, and growth.
Click here to read the Detailed blog post
Visit our YouTube channel to learn step-by-step video tutorials
👉 PKAnExcelExpert


Reviews
There are no reviews yet.