Report in Excel is a ready-to-use, interactive tool designed to help organizations track continuity performance, minimize downtime, and ensure operational stability during unexpected events.
From cyberattacks to supply chain failures or natural disasters, this Excel-based report gives business leaders complete visibility into critical operations, downtime costs, and test performance — all in one place.
Built with intuitive visuals, slicers, and KPIs, the Business Continuity Report in Excel empowers decision-makers to monitor tests, evaluate recovery speed, and analyze departmental impact — helping businesses strengthen their resilience strategy.
⚙️ Key Features of the Business Continuity Report in Excel
📊 Three Analytical Pages + Support Sheet:
Includes a Summary Page, Report Page, and Data Sheet — supported by a reference Support Sheet for drop-downs and slicers.
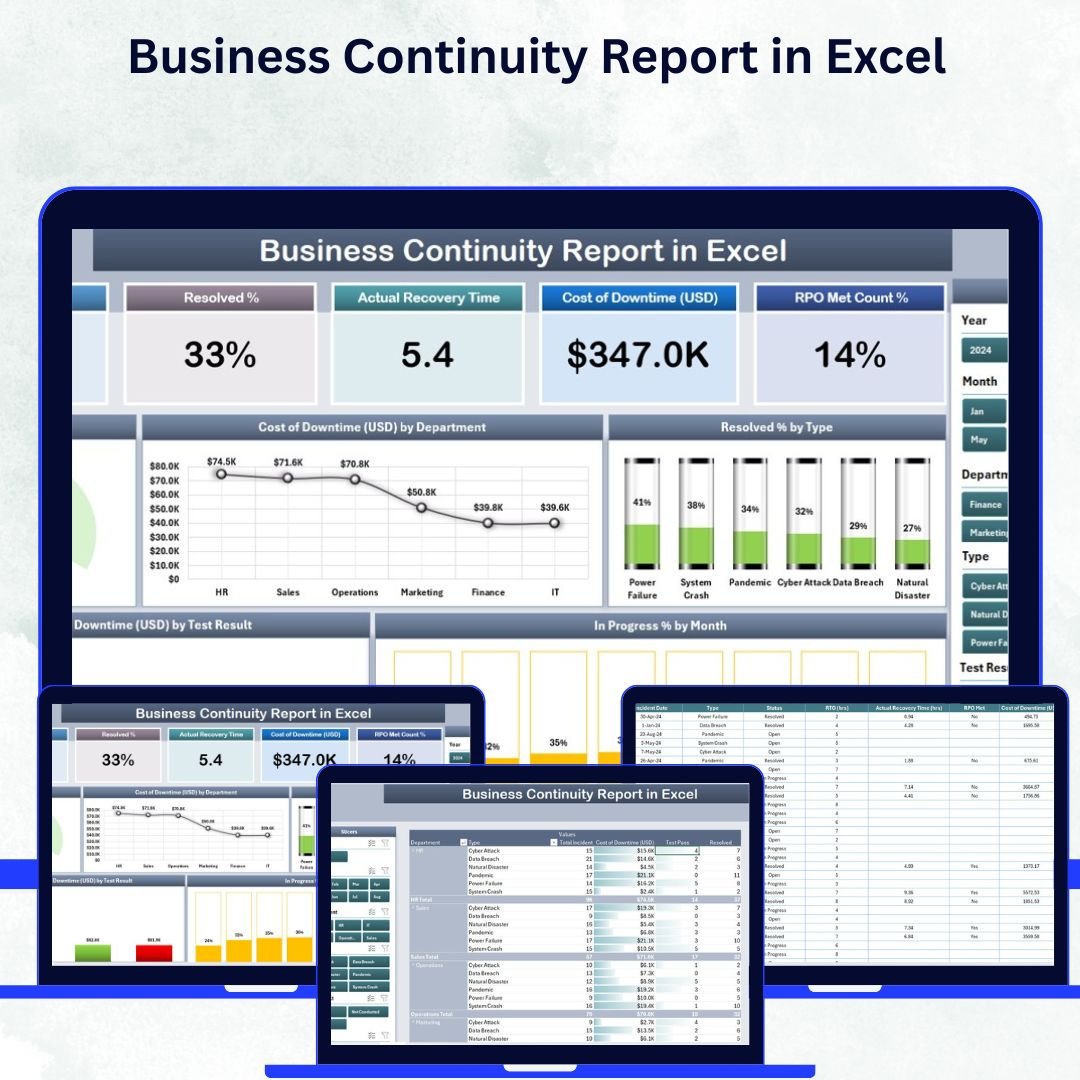
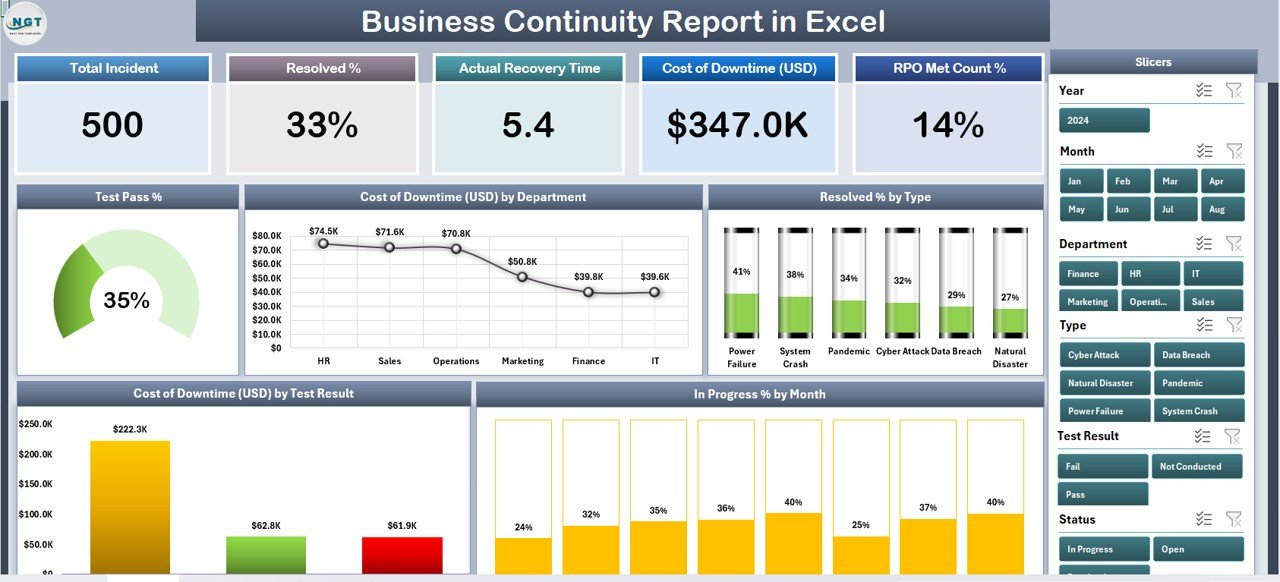
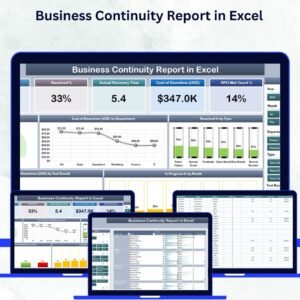
🎯 Comprehensive KPI Cards:
Instantly view top-level metrics like Total Tests, Pass %, Downtime Cost, Incidents Resolved, and In-Progress Tests — giving you a quick pulse of your continuity performance.
📈 Dynamic Charts & Visuals:
Gain deeper insights with visuals such as:
-
Test Pass %
-
Downtime Cost by Department
-
Resolved % by Type
-
Downtime Cost by Test Result
-
In-Progress Tests by Month
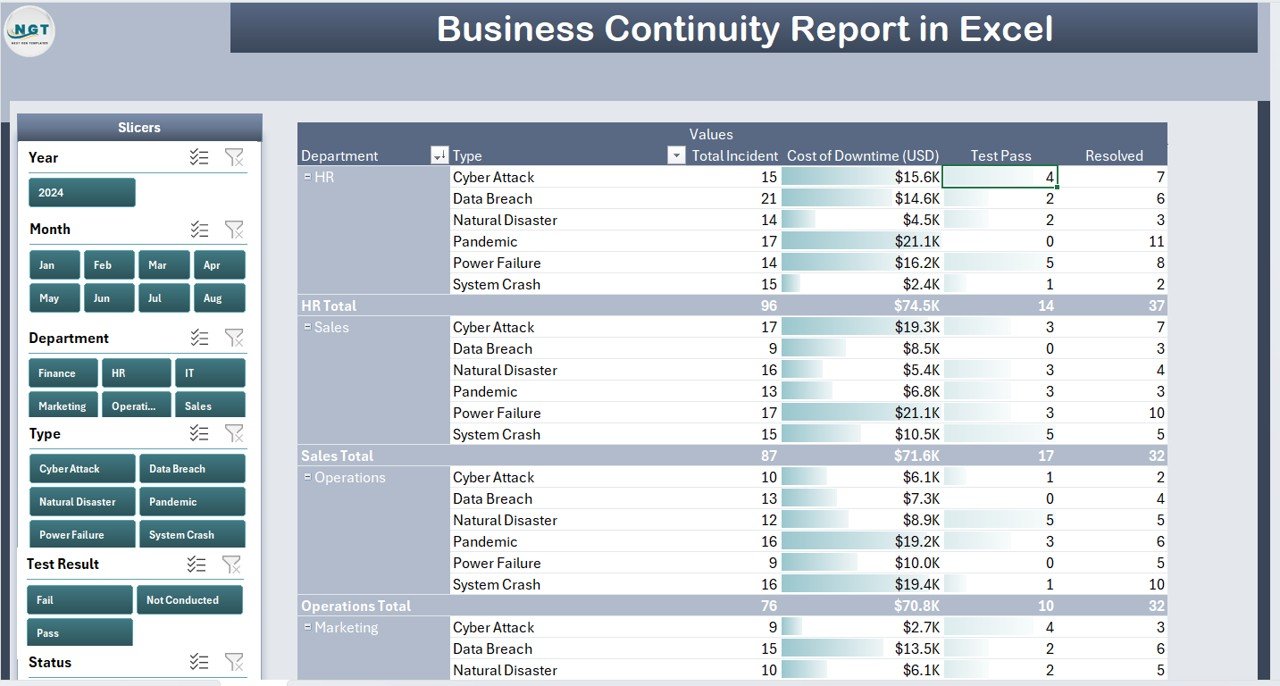
🧮 Interactive Filters & Slicers:
Filter results by Department, Month, or Test Type to customize analysis and uncover hidden trends instantly.
📄 Detailed Report Page:
Explore granular data with a structured table displaying Test ID, Department, Type, Result, Cost, Resolved %, and Responsible Person — ideal for audits, reviews, and presentations.
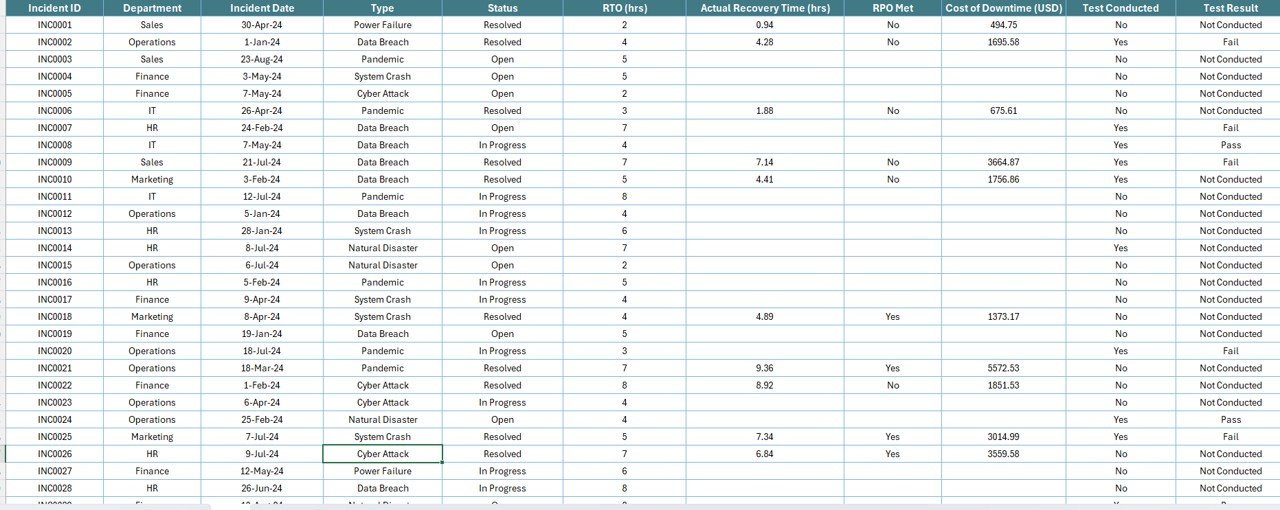
💾 Data Sheet for Raw Records:
Centralized source for all test results, incidents, and recovery data — automatically linked to dashboard visuals for seamless updates.
🔗 Support Sheet for Data Validation:
Maintains clean data entry through predefined lists (Department, Type, Responsible Person), ensuring consistency and accuracy.
💡 Auto-Refresh & Scalability:
Simply add new data and hit Refresh All — the entire report updates automatically. Perfect for both small teams and large enterprises.
🧩 Completely Customizable:
Easily change KPIs, add your company logo, or adjust color themes to match your brand identity.
🗂️ What’s Inside the Business Continuity Report
1️⃣ Summary Page:
Your real-time dashboard with KPIs, trend charts, and slicers for quick performance insights.
2️⃣ Report Page:
A detailed table-driven view where you can analyze test results, downtime costs, and resolutions by department or type.
3️⃣ Data Sheet:
Houses all continuity and recovery data in a pivot-ready format. Every visual and KPI on the dashboard pulls from this sheet.
4️⃣ Support Sheet:
Reference data hub for dropdowns and slicers — making updates fast, structured, and error-free.
🧭 How to Use the Business Continuity Report in Excel
✅ Step 1: Enter your test data, downtime values, and resolutions in the Data Sheet.
✅ Step 2: Update the Support Sheet for dropdowns (if new departments or types are added).
✅ Step 3: Click Refresh All in Excel to update visuals automatically.
✅ Step 4: Use slicers on the Summary Page to filter by department or test type.
✅ Step 5: Share the dashboard as a PDF or Excel file with management teams.
Within minutes, you’ll have a real-time continuity performance report ready to present to executives or auditors.
👥 Who Can Benefit from This Dashboard
🧑💼 Business Continuity Managers: Track resilience KPIs and report test performance.
💻 IT Teams: Monitor recovery efficiency and incident resolution trends.
💰 Finance Managers: Analyze downtime costs and identify cost-saving opportunities.
🏢 Executives: Gain visibility into risk preparedness and business stability.
🧩 Compliance Teams: Maintain audit-ready continuity data for certifications and reviews.
🌟 Advantages of the Business Continuity Report in Excel
✅ Real-Time Monitoring: Instantly visualize critical KPIs like Test Pass % and Downtime Cost.
✅ Centralized Data Hub: Consolidate continuity metrics in one easy-to-manage file.
✅ Cost-Effective Solution: No expensive BI tools — Excel delivers enterprise-grade insights.
✅ Enhanced Decision-Making: Identify weak areas and allocate resources strategically.
✅ Audit-Friendly: Keep complete test history and performance records for compliance.
✅ Scalable & Customizable: Works for small businesses and large corporations alike.
🔗 Click here to read the Detailed Blog Post
🎥 Visit our YouTube channel for step-by-step tutorials
🔗 YouTube.com/@PKAnExcelExpert


Reviews
There are no reviews yet.