Business disruptions can strike without warning. System outages, cyber incidents, natural disasters, supplier failures, or operational breakdowns can instantly impact productivity, revenue, customer trust, and regulatory compliance. In such situations, organizations must respond fast, recover efficiently, and learn from every incident. However, when continuity data is spread across emails, spreadsheets, and incident tools, leaders lose visibility and control.
That is exactly why the Business Continuity Dashboard in Google Sheets becomes an essential resilience management solution.
This ready-to-use dashboard provides a centralized, visual, and data-driven way to monitor business continuity incidents, recovery performance, downtime costs, and test outcomes. It converts raw incident records into meaningful KPIs, charts, and trends—helping organizations identify risks early, improve recovery planning, and strengthen overall resilience. Because it runs entirely in Google Sheets, the dashboard is easy to use, collaborative, and accessible without expensive software.
✨ Key Features of the Business Continuity Dashboard in Google Sheets
🚨 1. Centralized Incident & Recovery Tracking
All continuity-related incidents are tracked in one place, giving teams a single source of truth for analysis and reporting.
⏱️ 2. Recovery Time & RTO/RPO Visibility
Monitor actual recovery time against objectives to understand how effectively incidents are resolved.
💰 3. Downtime Cost Analysis
Track financial impact caused by downtime to prioritize resilience investments and corrective actions.
📊 4. Department, Incident & Test-Based Analysis
Analyze performance across departments, incident types, and test results to identify weak areas.
📈 5. Monthly Trend Monitoring
Track continuity maturity over time and identify whether recovery performance is improving or declining.
📦 What’s Inside the Business Continuity Dashboard in Google Sheets
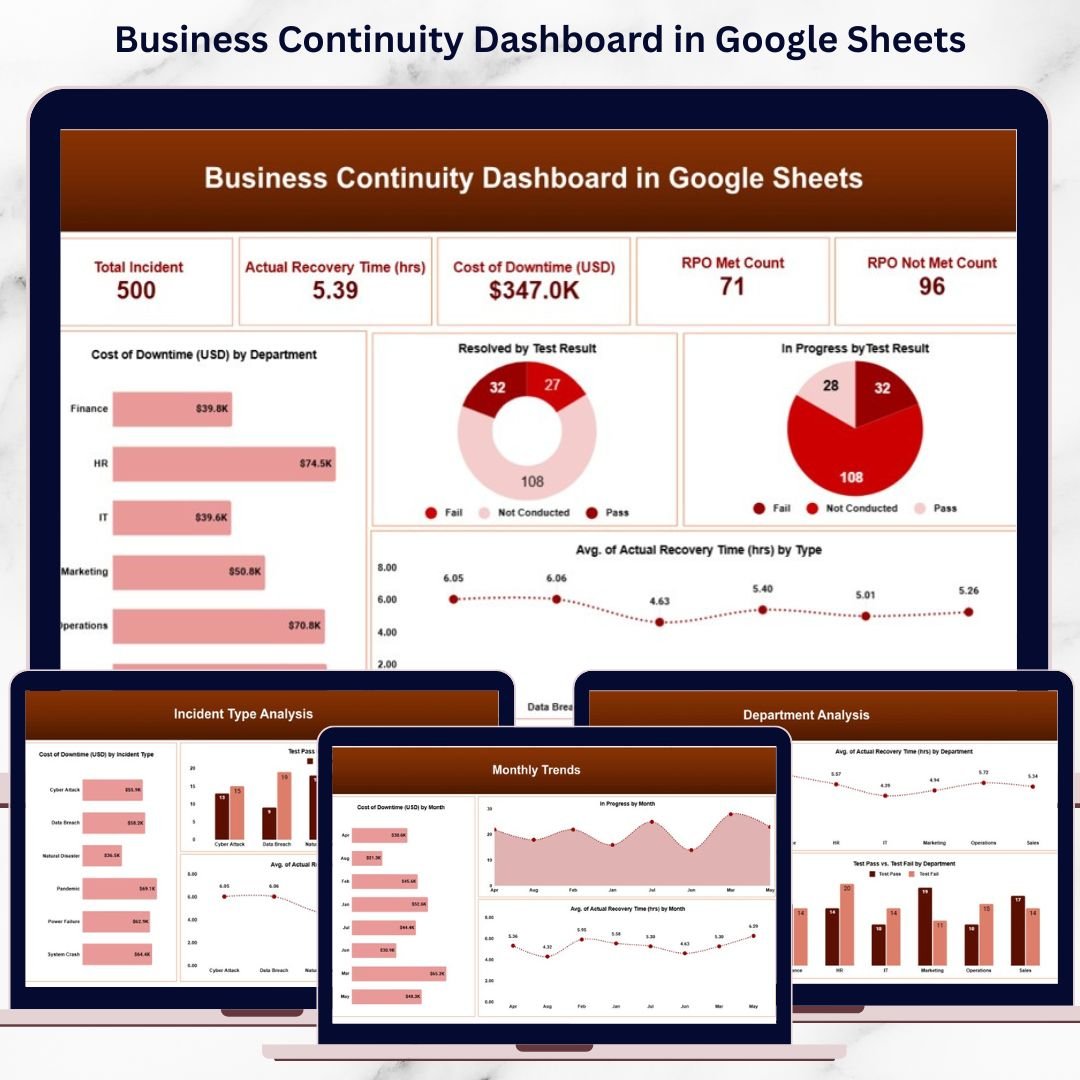
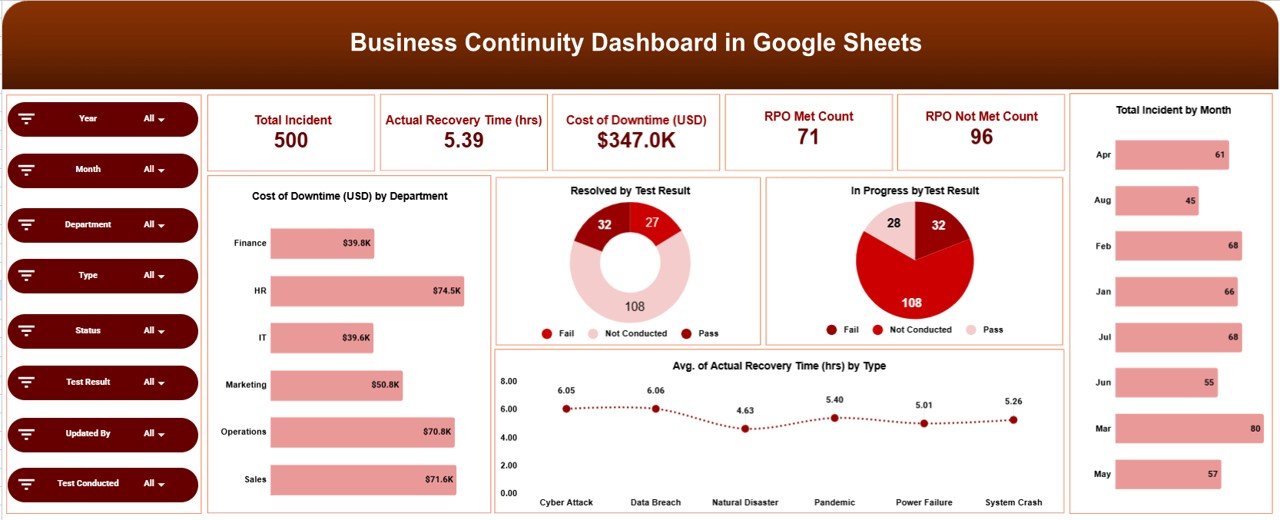
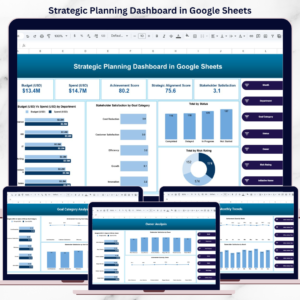
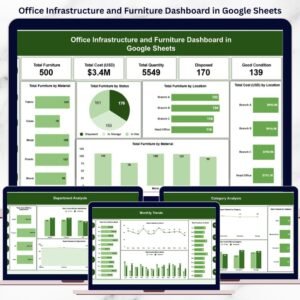
🖥️ Overview Sheet Tab – Executive Snapshot
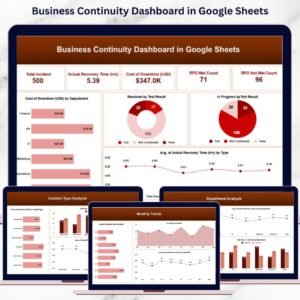
The Overview Sheet provides leadership with an instant view of overall continuity performance.
KPI Cards Included
-
Total Incidents – Total number of continuity incidents logged
-
Actual Recovery Time (hrs) – Average or total recovery duration
-
Cost of Downtime (USD) – Financial impact of disruptions
-
RPO Met Count – Incidents where recovery objectives were met
-
RPO Not Met Count – Incidents where recovery objectives failed
These KPIs help leaders quickly understand organizational resilience.
Overview Charts
-
Cost of Downtime by Department – Identify high-impact areas
-
Resolved by Test Result – Measure test effectiveness
-
In Progress by Test Result – Highlight unresolved issues
-
Average Recovery Time by Incident Type – Compare response effectiveness
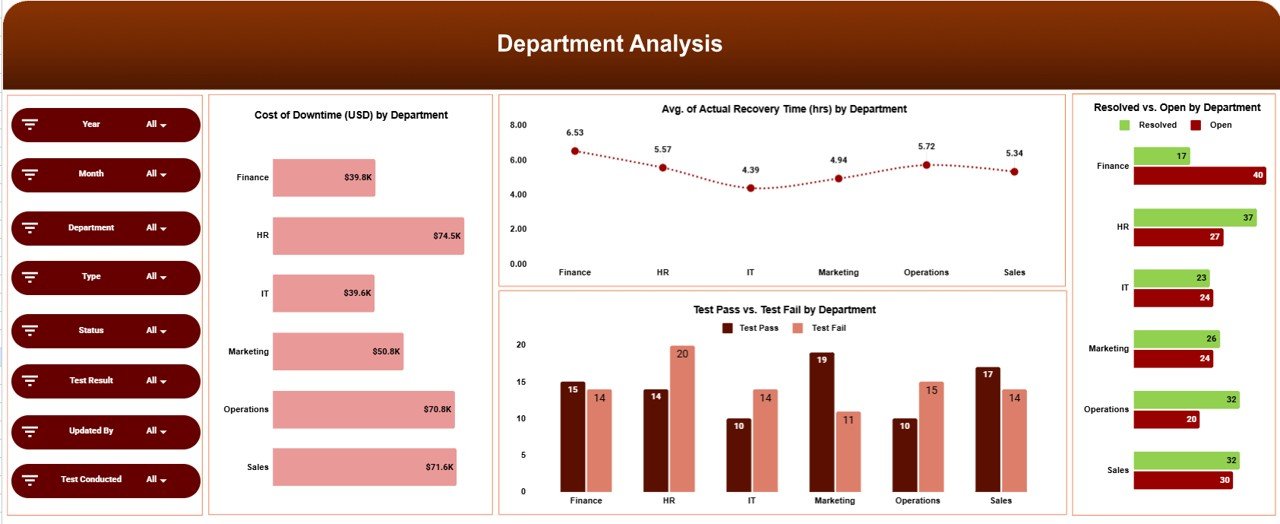
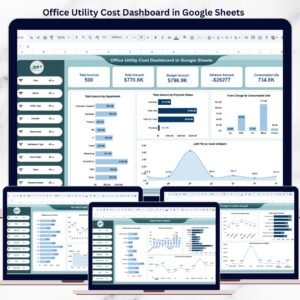
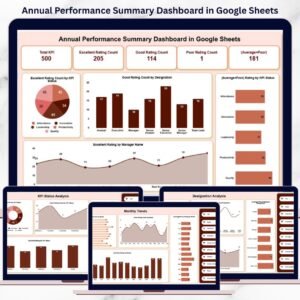
🏢 Department Analysis
This section evaluates continuity performance at the department level.
Charts Included
-
Cost of Downtime (USD) by Department
-
Average Actual Recovery Time (hrs) by Department
-
Test Pass vs Test Fail by Department
These insights help management decide where to improve preparedness, infrastructure, or training.
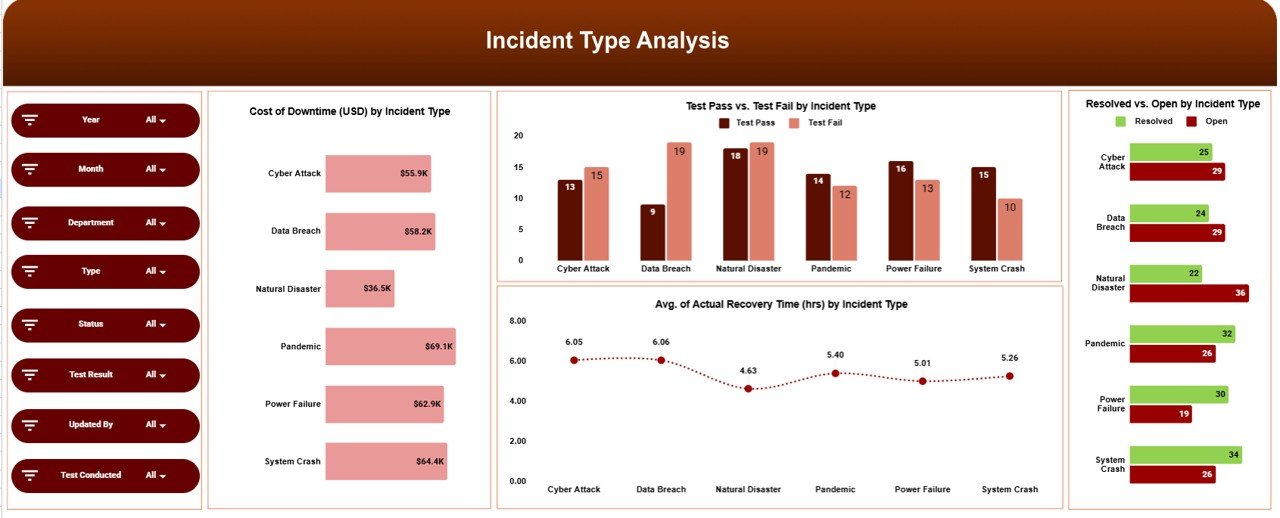
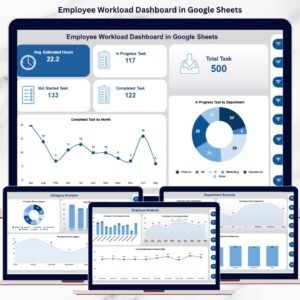
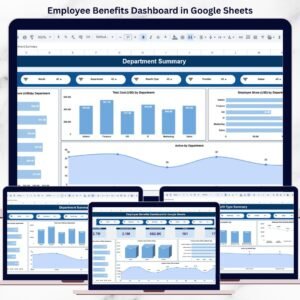
⚠️ Incident Type Analysis
Different incident types carry different risks. This section analyzes performance by incident category.
Charts Included
-
Cost of Downtime (USD) by Incident Type
-
Test Pass vs Test Fail by Incident Type
-
Average Actual Recovery Time (hrs) by Incident Type
-
Resolved vs Open by Incident Type
Teams can identify which incident types cause the most disruption and focus mitigation efforts accordingly.
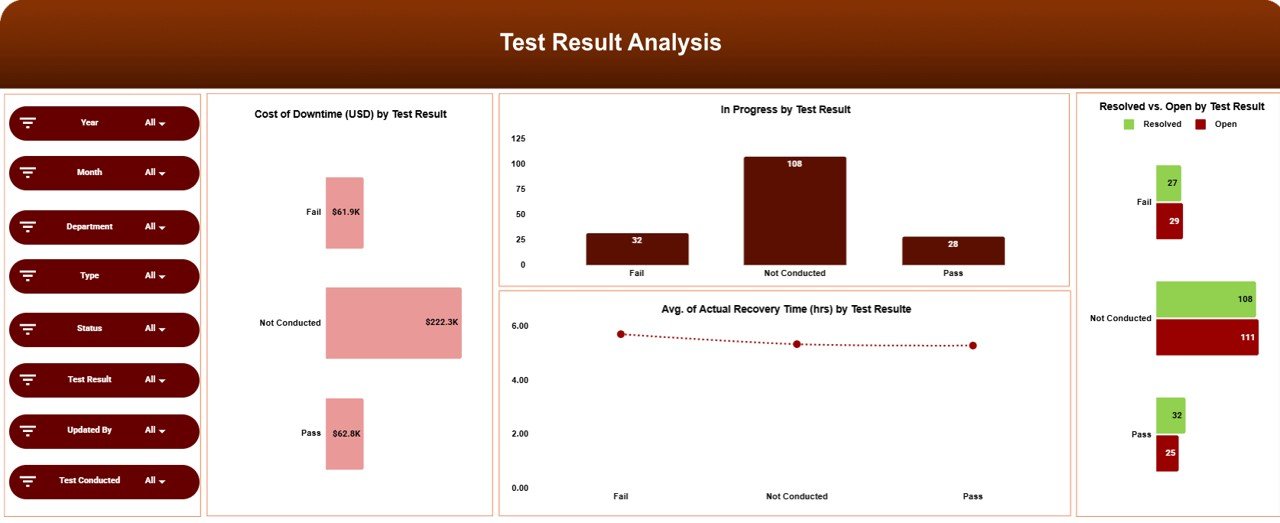
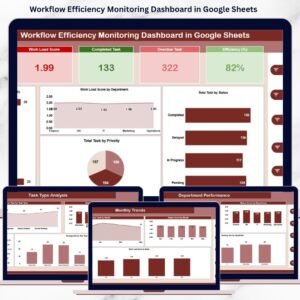
🧪 Test Result Analysis
Testing is a core part of business continuity planning. This section evaluates test outcomes.
Charts Included
-
Cost of Downtime (USD) by Test Result
-
In Progress by Test Result
-
Resolved vs Open by Test Result
-
Average Actual Recovery Time (hrs) by Test Result
These visuals show whether continuity plans work effectively during drills and real events.
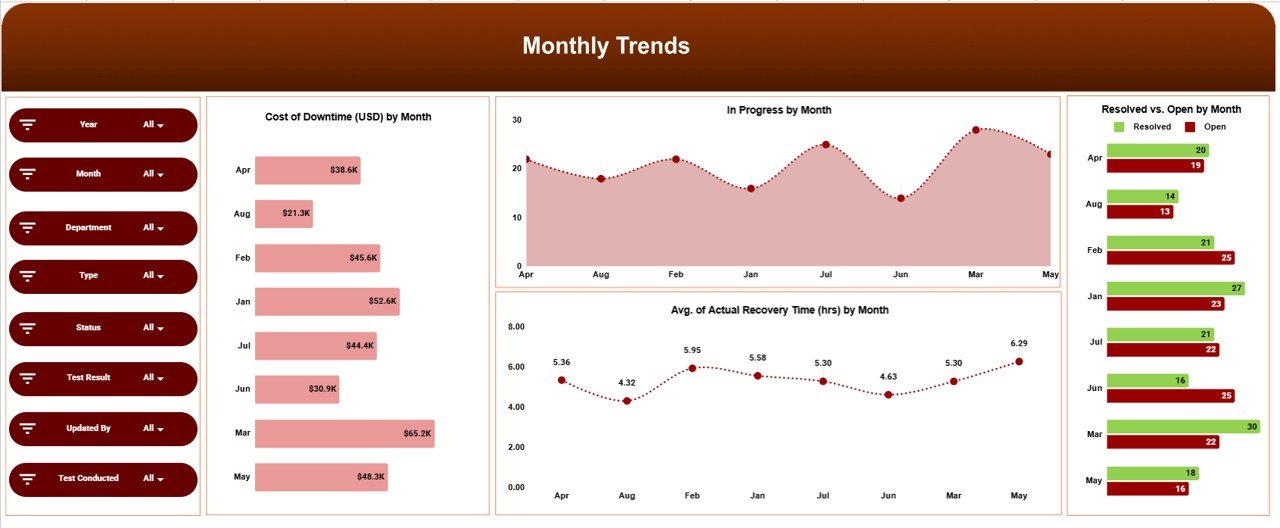
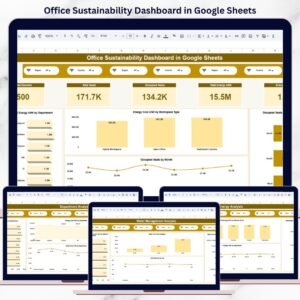
📅 Monthly Trends Analysis
This section tracks continuity performance over time.
Charts Included
-
Cost of Downtime (USD) by Month
-
In Progress by Month
-
Resolved vs Open by Month
-
Average Actual Recovery Time (hrs) by Month
Trend analysis helps leadership measure maturity and spot emerging risks early.
🎯 Who Can Benefit from This Business Continuity Dashboard
🛡️ Risk & Resilience Teams
Monitor incidents, recovery performance, and testing outcomes clearly.
⚙️ IT & Operations Teams
Track outages, response speed, and recovery effectiveness.
📊 Compliance & Audit Teams
Support audits and regulatory reviews with structured continuity data.
🏢 Senior Leadership
Gain real-time visibility into organizational resilience.
🏥 Organizations of Any Size
Strengthen continuity planning without complex tools.
### Click here to read the Detailed blog post
Watch the step-by-step video tutorial:


Reviews
There are no reviews yet.