

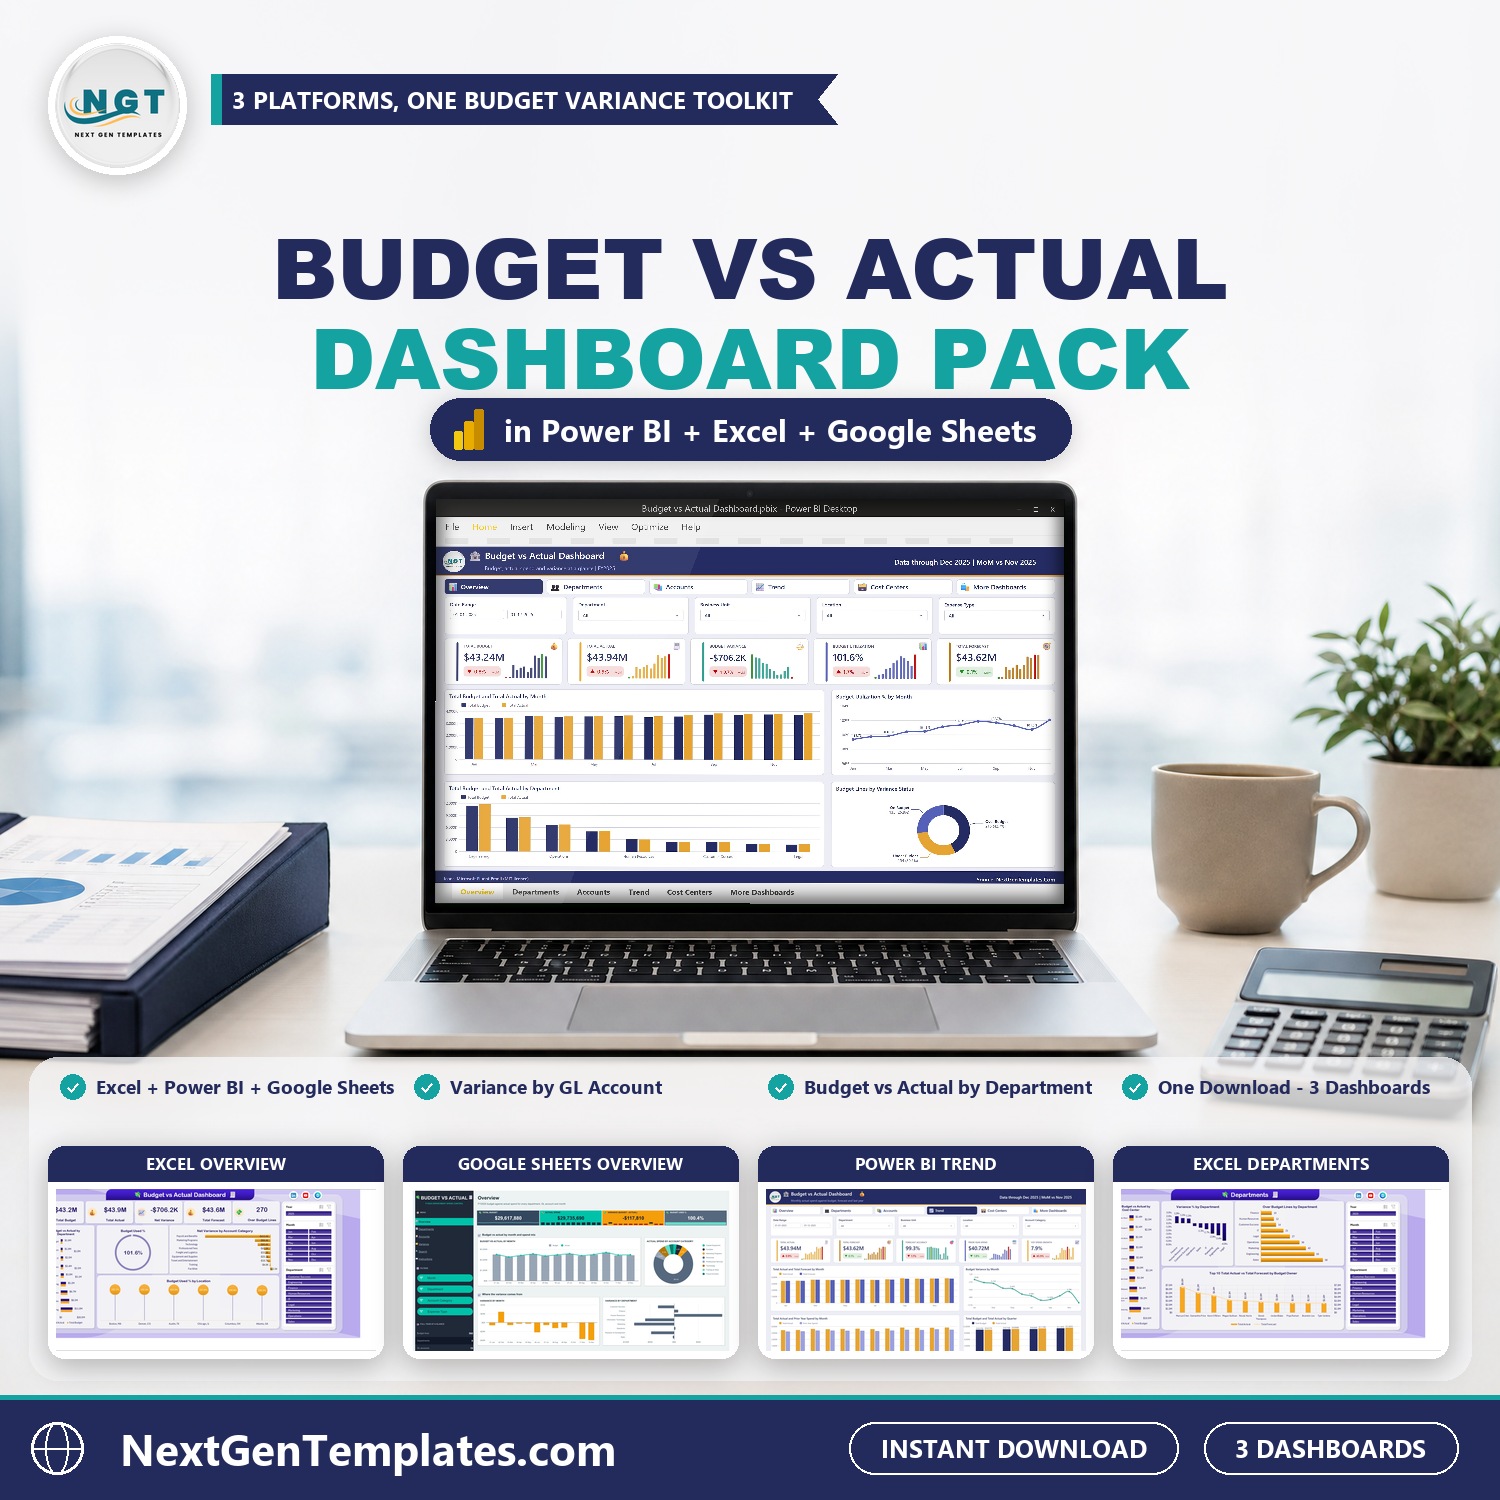
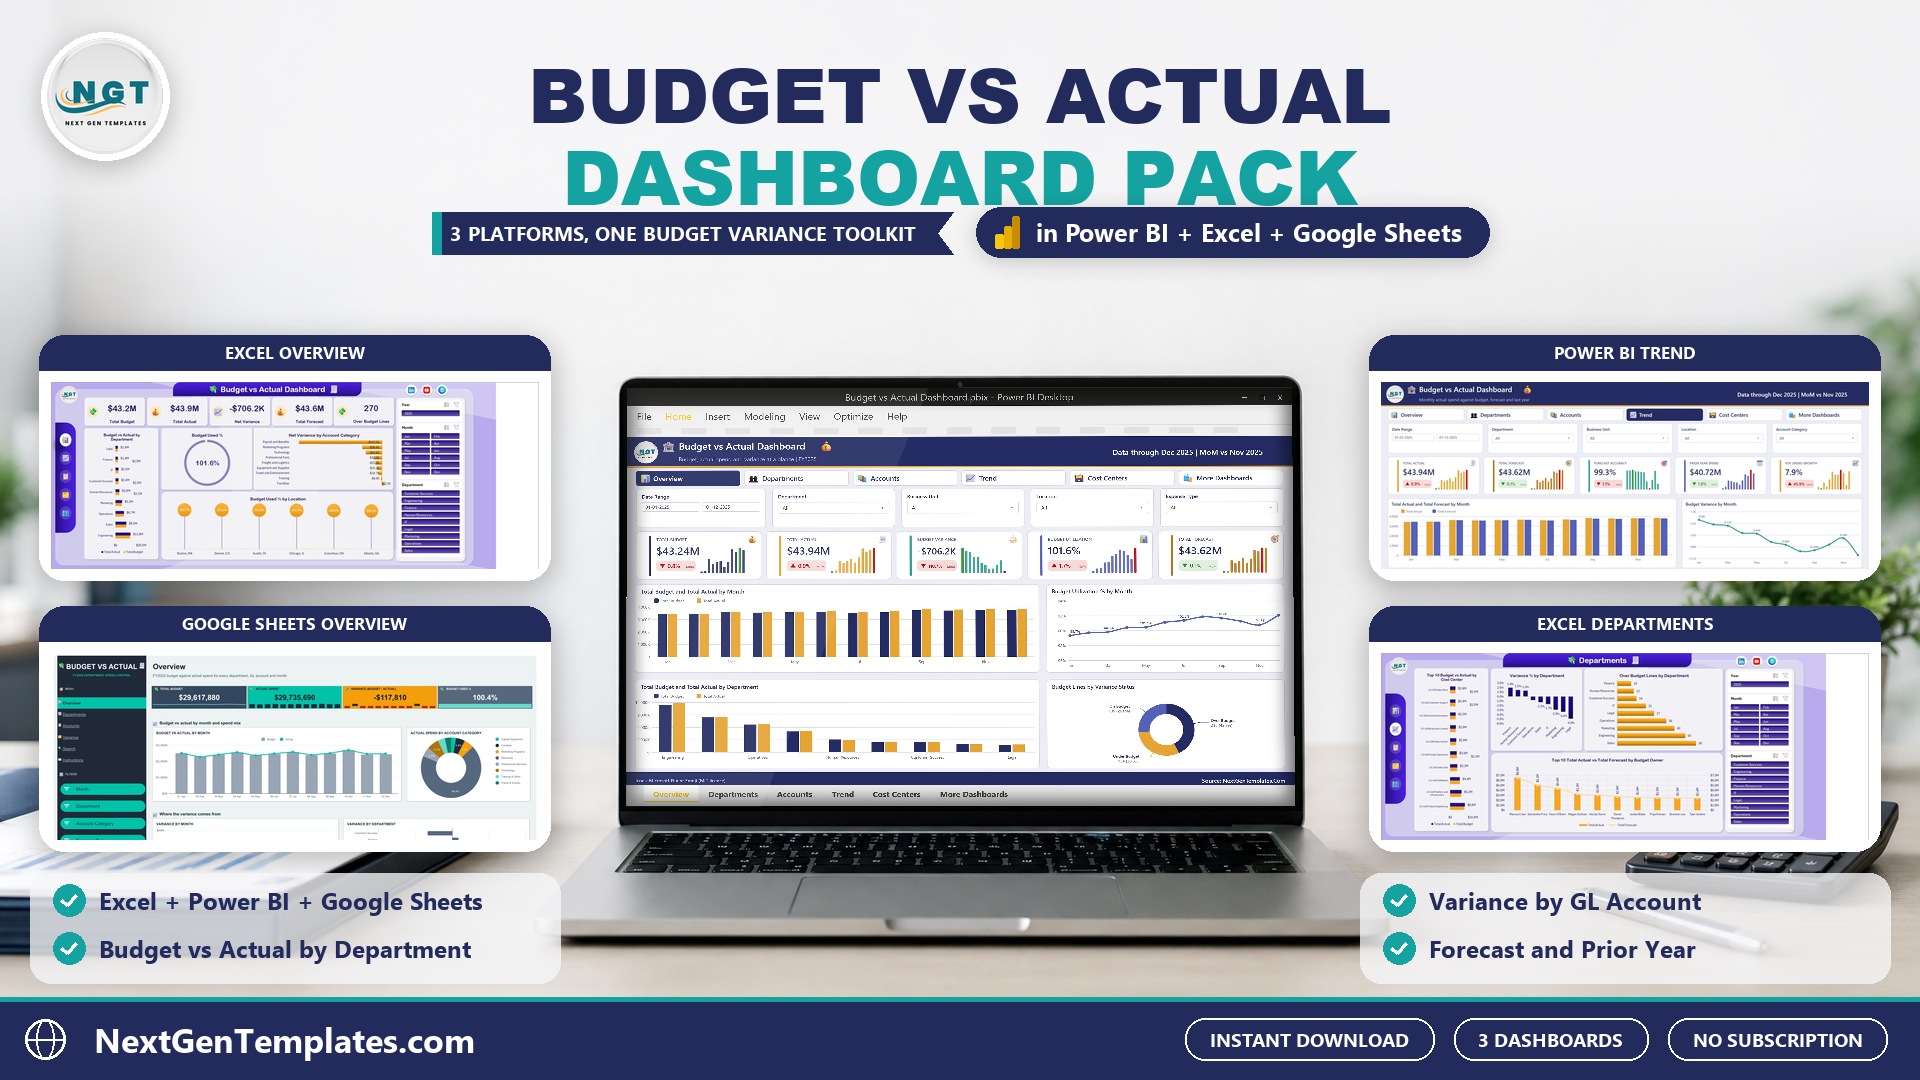

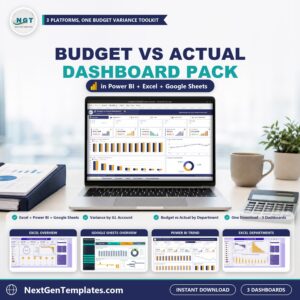
The Budget vs Actual Dashboard Pack gives you the same budget vs actual dashboard in three tools: Microsoft Excel, Power BI and Google Sheets. Each one compares budget against actual spend by department, GL account and month, shows net variance and budget used %, and points to the budget lines that went over. Bought one by one the three dashboards cost $45.97; the pack costs $29.00 – you save $16.97 (37%).
🌍 Join 10,000+ customers in 180+ countries using NextGenTemplates. ✅ Instant download · One-time payment · No subscription · No per-user fees
Watch the Budget vs Actual Dashboard Pack (Excel + Power BI + Google Sheets) walkthrough
🔑 Key Features of the Budget vs Actual Dashboard Pack
- 📊 One budget vs actual dashboard, three tools – use Excel at your desk, Power BI for the management pack and Google Sheets when the budget owners work online.
- 🧾 Budget vs actual report by department – total budget, actual and variance for Sales, Marketing, Engineering, Operations, Finance, HR, IT, Legal and Customer Success in the sample data.
- 📒 Budget variance report by GL account – net variance by account category and by GL account, so you see which cost lines drive the overspend.
- 📈 Monthly trend – budget, actual and forecast month by month, with prior-year actuals in the Excel and Power BI versions.
- 🏢 Locations and cost centers – budget used % by location in Excel and a cost center scorecard in Power BI.
- 🎛️ Slicers and filters – year, month and department slicers in Excel, five synced filters in Power BI and eight native slicers in Google Sheets.
- 🔍 Drill to the budget line – Power BI drill-through and the Google Sheets Search page show the full record behind any number.
- 💰 One-time payment – you own the files and your numbers stay in your own workbook, report or Google account.
📦 What’s Inside the Budget vs Actual Dashboard Pack
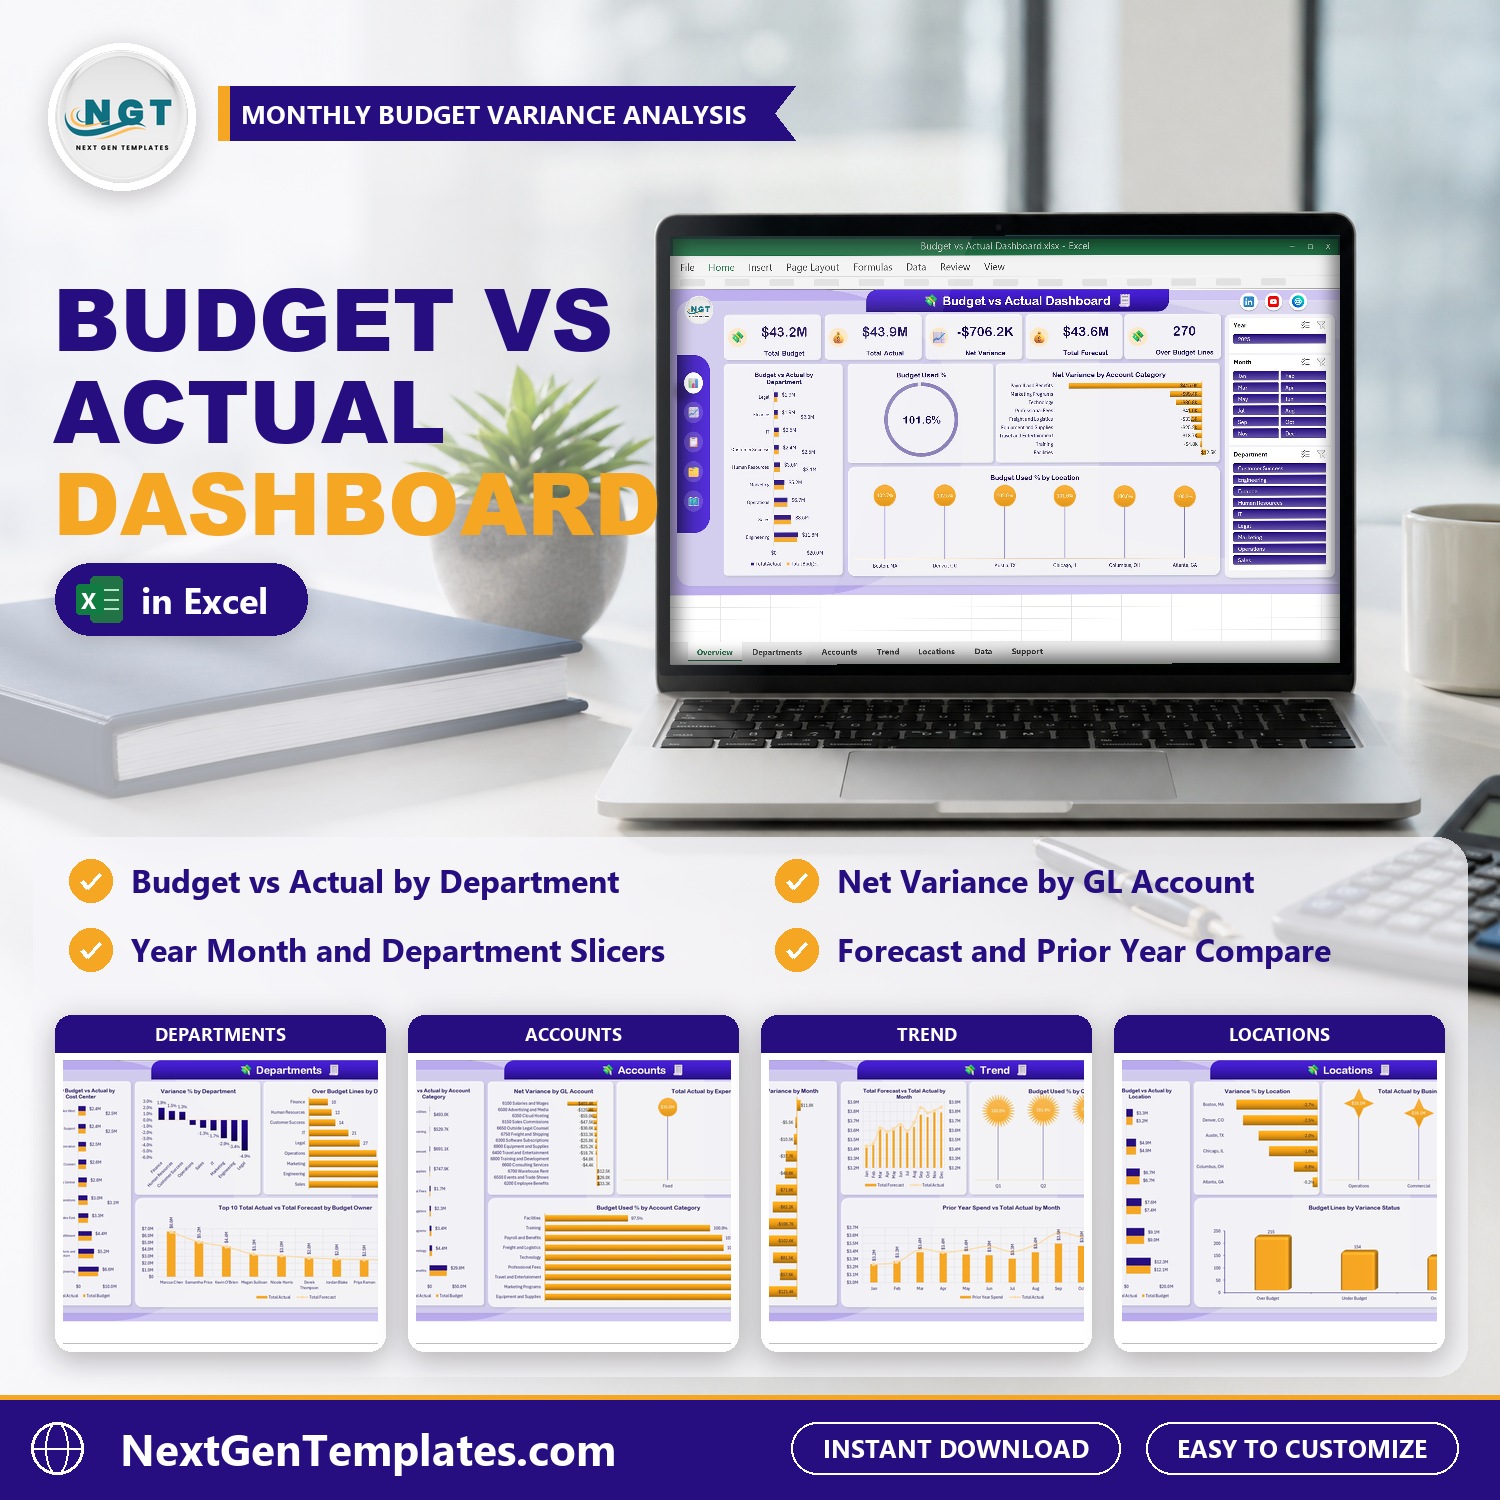
- Budget vs Actual Dashboard in Excel (Excel) – A five-page budget vs actual dashboard in Excel: Overview, Departments, Accounts, Trend and Locations. KPI cards show total budget, total actual, net variance, total forecast and the number of over-budget lines, with Budget Used %, net variance by account category and budget used by location. Year, month and department slicers turn it into a monthly budget vs actual report. Add your budget lines to the Data sheet and click Refresh All. No macros. Includes 500 sample budget lines and a PDF user manual.

Budget vs Actual Dashboard in Excel
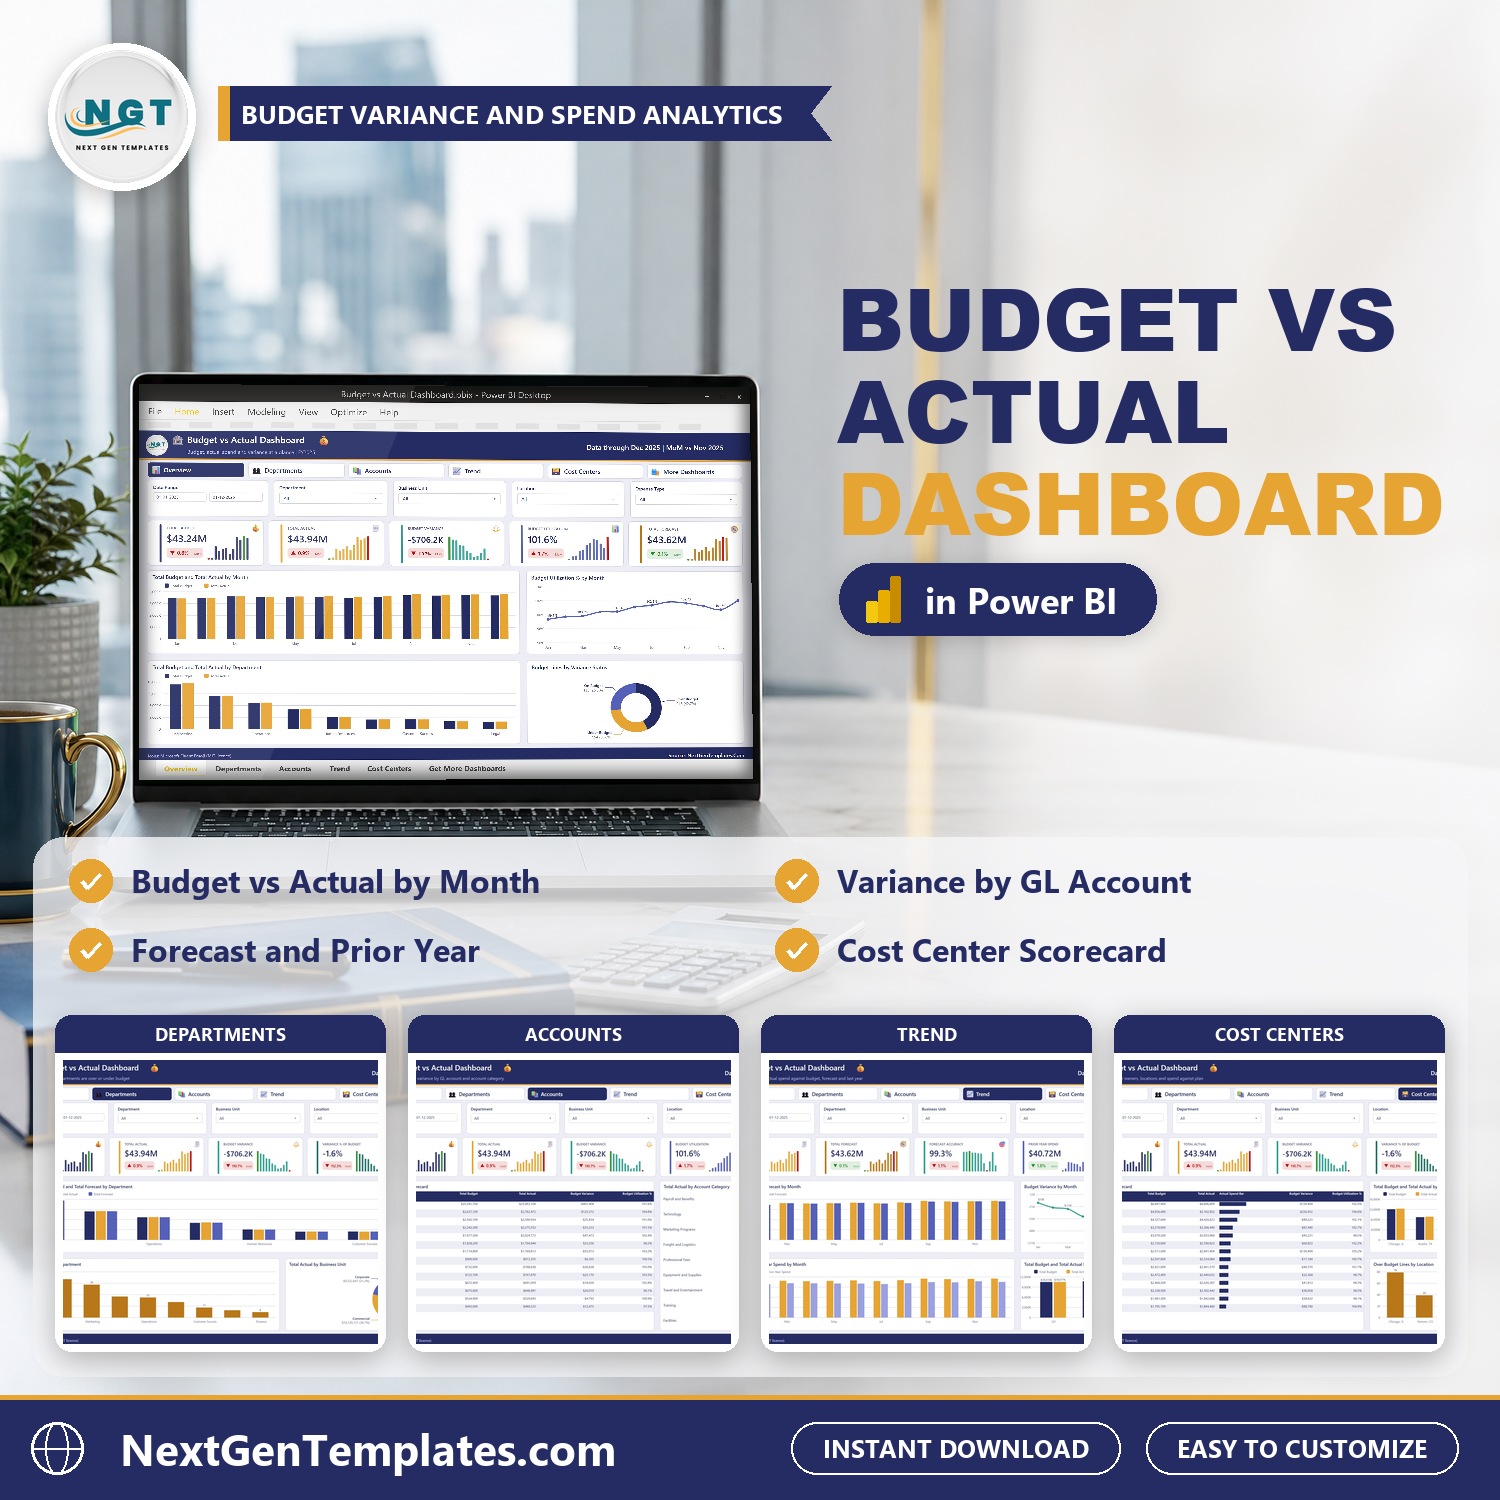
- Budget vs Actual Dashboard in Power BI (Power BI) – A Power BI report (.pbix) with Overview, Departments, Accounts, Trend and Cost Centers pages. Cards with sparklines show budget, actual, budget variance, budget utilization and forecast, with month-over-month change. Right-click drill-through opens the budget lines behind any number, and five synced filters (date range, department, business unit, location, expense type) work across pages. Ships with the Data.xlsx source and a PDF user manual.
Budget vs Actual Dashboard in Power BI
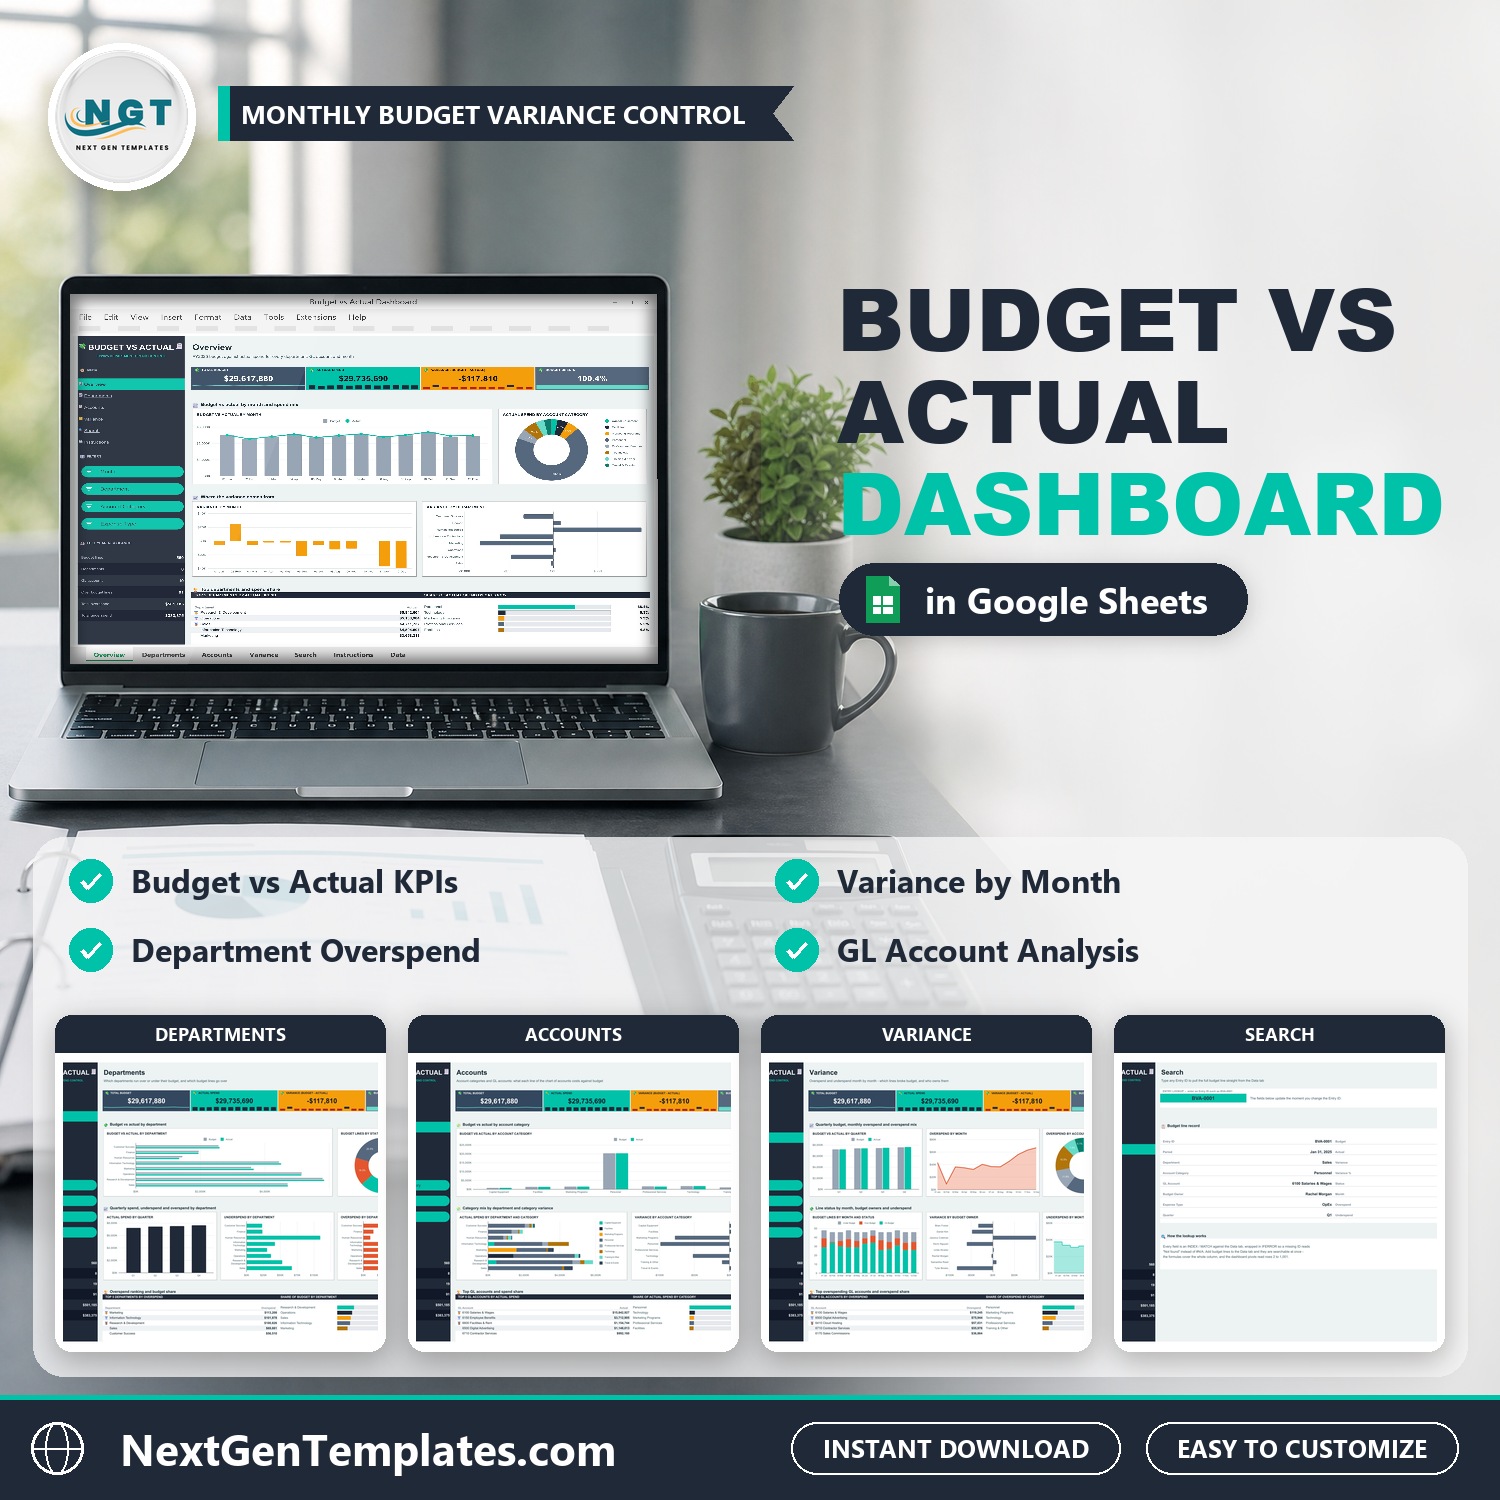
- Budget vs Actual Dashboard in Google Sheets (Google Sheets) – A Google Sheets budget variance report with Overview, Departments, Accounts and Variance pages plus Search and Instructions. KPI cards for total budget, actual spend, variance and budget used %, native slicers for month, department, account category, expense type, budget owner, quarter, GL account and status, and room for 1,000 budget lines. No add-ons, no script. Make a copy from the link in the PDF and it runs in your own Google account.
Budget vs Actual Dashboard in Google Sheets
💡 Smart Comparison – Individual vs Bundle
| Feature | Buy individually | Budget vs Actual Dashboard Pack |
|---|---|---|
| Dashboards | Pick one tool at a time | All 3: Excel, Power BI, Google Sheets |
| Price | $45.97 | $29.00 |
| You save | – | $16.97 (37%) |
| Downloads | 3 separate orders | One ZIP with all three |
| Best value | One tool only | ✅ Teams that use more than one tool |
| # | Product | Platform | Individual price |
|---|---|---|---|
| 1 | Budget vs Actual Dashboard in Excel | Excel | $17.99 |
| 2 | Budget vs Actual Dashboard in Power BI | Power BI | $17.99 |
| 3 | Budget vs Actual Dashboard in Google Sheets | Google Sheets | $9.99 |
| Total if bought separately | $45.97 | ||
| Bundle price | $29.00 | ||
⚙️ How to Use the Budget vs Actual Dashboard Pack
- Download the pack ZIP and unzip it – the Excel and Power BI dashboards each sit in their own ZIP with a PDF user manual, and the Google Sheets version is a PDF with the copy link.
- Excel: paste your budget lines into the Data sheet (period, department, GL account, budget, actual, forecast) and click Data > Refresh All.
- Power BI: replace the rows in Data.xlsx with your own, open the .pbix in Power BI Desktop and click Refresh.
- Google Sheets: open the link in the PDF, choose File > Make a copy, then paste your rows on the Data tab – the pages update on their own.
- Each month, check the departments and GL accounts that went over budget and follow up with the budget owner.
👥 Who Can Benefit from This Budget vs Actual Dashboard Pack
- 💼 Finance managers and FP&A analysts who run the monthly budget review
- 📚 Accountants and controllers who prepare the budget vs actual report for management
- 🏢 Department heads and budget owners who track their own spend
- 🧑💻 Teams that work across Excel, Power BI and Google Sheets
- 🎓 Students learning dashboards who want the same report built three ways
🎓 Want to build dashboards like these yourself? Next Gen Templates Academy has a course for each tool: Excel Pivot Tables & Dashboards: Basic to Advanced, Power BI: Raw Data to Professional Business Dashboards and Google Sheets Complete Course: Beginner to Advanced.
Get all 3 budget vs actual dashboards for $29.00
Individual total $45.97 – you save $16.97 (37%). One-time payment, instant download.
Explore more template bundles and subscribe to our YouTube channel for template walkthroughs.










Reviews
There are no reviews yet.