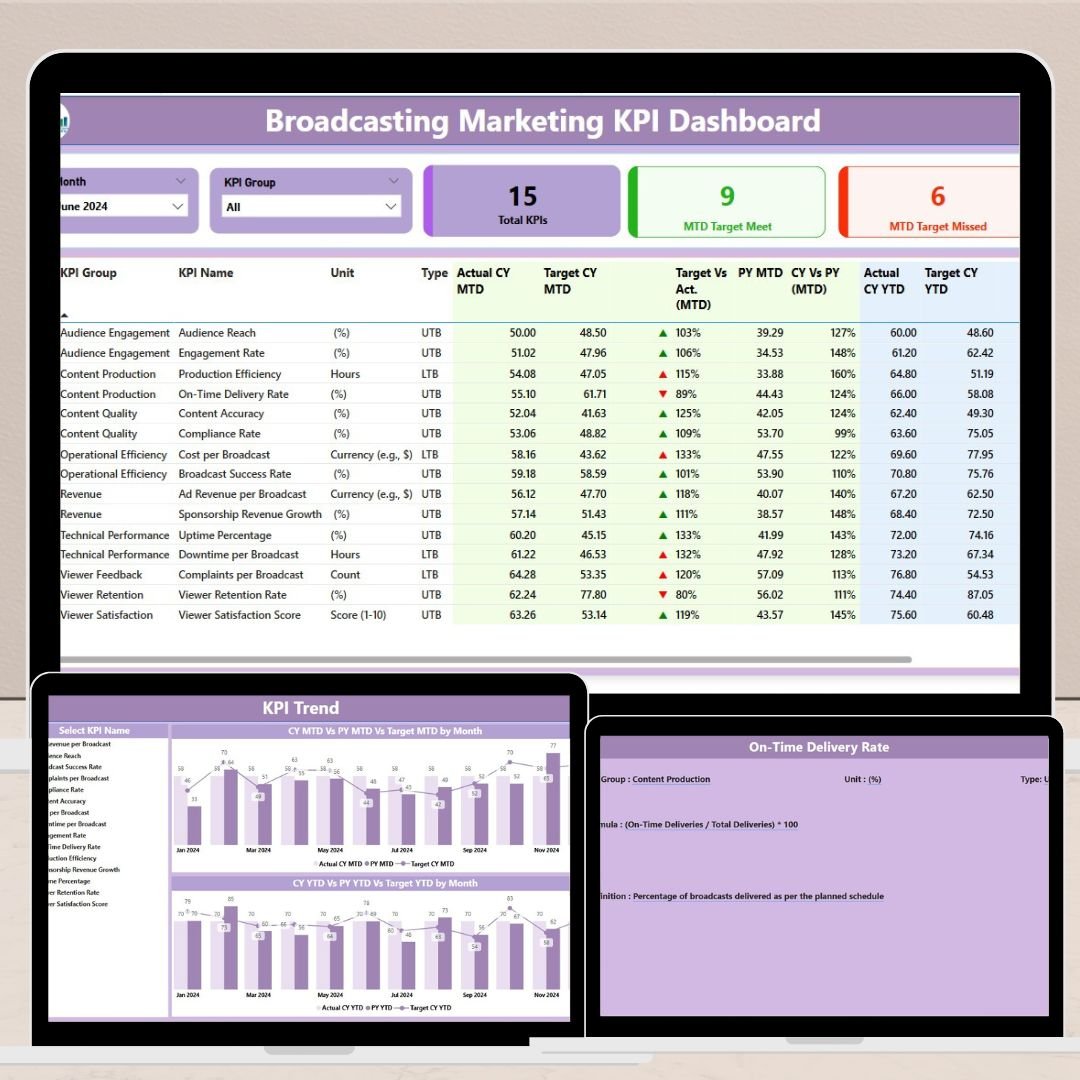
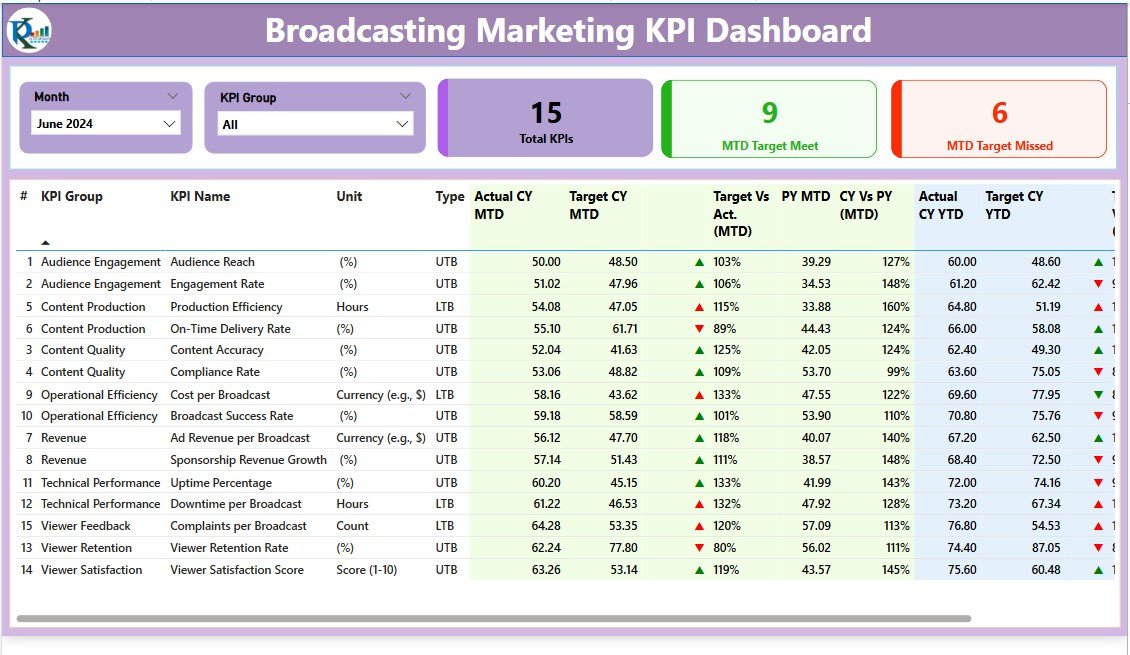
The Broadcasting KPI Dashboard in Power BI is an essential tool designed for broadcasting companies, media agencies, and content creators to track and monitor key performance indicators (KPIs) related to their broadcasting operations. This Power BI-based dashboard provides actionable insights into various metrics such as viewership, audience engagement, ad revenue, and content performance, helping businesses make data-driven decisions that optimize their broadcasting strategies.
With this powerful dashboard, you can easily visualize audience data, track content performance, and analyze the impact of advertising revenue, all in one place. Whether you’re a TV network, streaming service, or online media platform, this dashboard enables you to evaluate the effectiveness of your content, optimize ad placements, and enhance audience engagement.
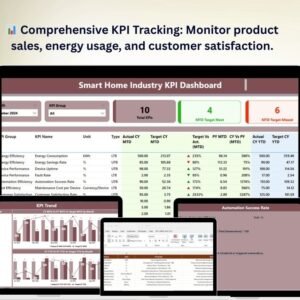
Key Features of the Broadcasting KPI Dashboard in Power BI
📊 Viewership Tracking & Analytics
Monitor audience viewership across various channels and platforms. Track key metrics such as unique viewers, total views, and audience growth to assess content popularity and engagement.
📈 Audience Demographics Analysis
Gain insights into your audience’s demographics, including age, gender, and location. Use this data to create targeted content that resonates with your audience.
💰 Ad Revenue Monitoring
Track advertising revenue and analyze its performance. Monitor the impact of different ad placements, sponsors, and campaigns to optimize ad strategies and maximize revenue.
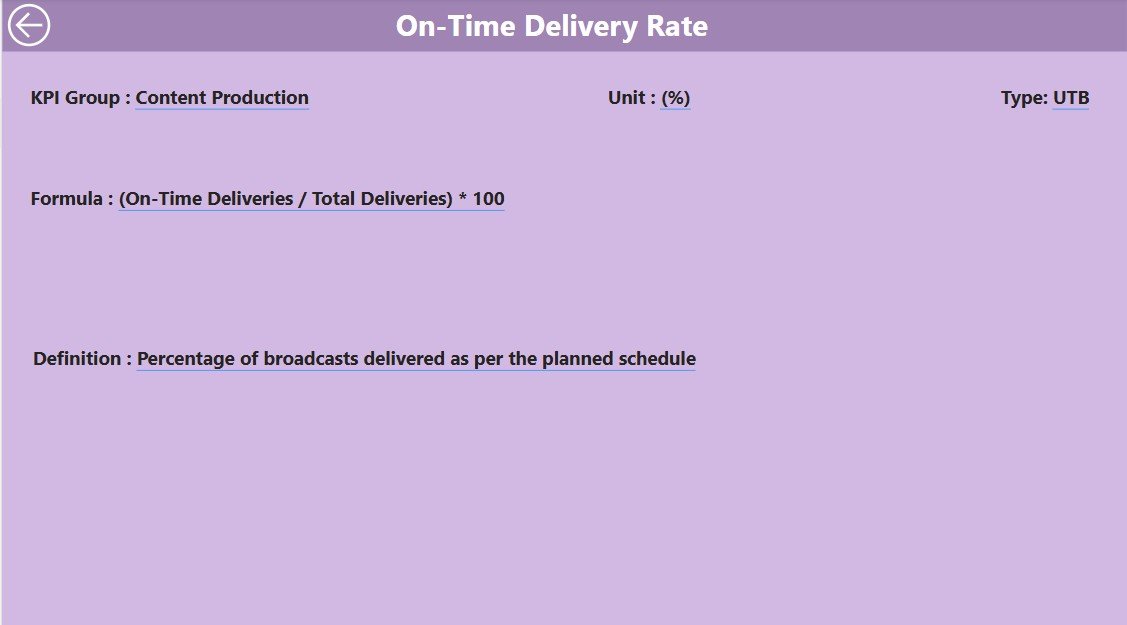
📅 Content Performance & Scheduling
Track the performance of your broadcast content. Measure ratings, viewer retention, and the success of different genres or shows. Schedule content and monitor its effectiveness over time.
📉 Engagement Metrics
Track audience engagement through metrics such as comments, shares, likes, and social media mentions. Analyze how engaged your audience is with specific content and identify areas to improve.
⚙️ Customizable Dashboard
Tailor the dashboard to suit your broadcasting business’s unique needs. Add custom KPIs, modify visuals, and adjust reporting periods to match your goals.
Why You’ll Love the Broadcasting KPI Dashboard in Power BI
✅ All-in-One Media Performance Tracker
Monitor and analyze your broadcasting performance with a single dashboard. Track viewership, engagement, ad revenue, and content performance in real time.
✅ Maximize Advertising Revenue
By tracking ad revenue and evaluating ad placements, you can optimize your advertising strategy and increase your revenue.
✅ Optimize Content Strategy
Evaluate the performance of your content based on audience retention, ratings, and engagement. Use these insights to refine your content strategy and increase viewership.
✅ Data-Driven Decisions for Better Engagement
Leverage audience demographics and engagement metrics to create content that appeals to your target audience, improving their experience and loyalty.
✅ Scalable & Customizable
Whether you’re managing a small broadcasting operation or a large media network, the dashboard can scale and be customized to meet your specific needs.
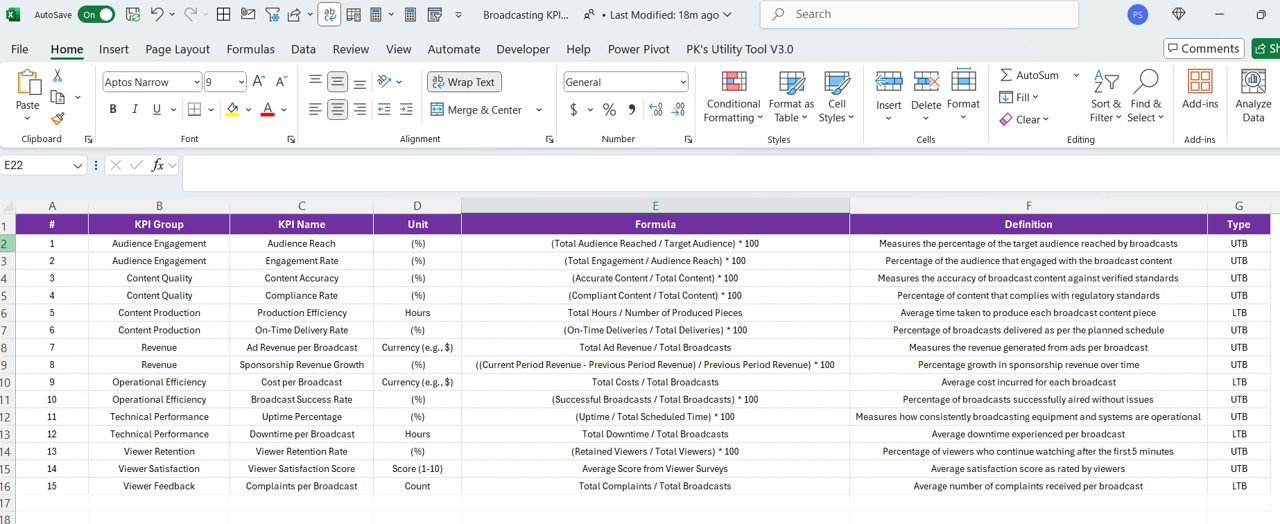
What’s Inside the Broadcasting KPI Dashboard in Power BI?
-
Viewership Tracking & Analytics: Monitor audience data such as unique viewers and views over time.
-
Audience Demographics Analysis: Gain insights into the age, gender, and location of your audience.
-
Ad Revenue Monitoring: Track and analyze advertising performance and revenue.
-
Content Performance Tracking: Measure ratings, viewer retention, and success of shows.
-
Engagement Metrics: Analyze social media interactions, likes, shares, and comments.
-
Customizable Features: Adapt the dashboard to your unique broadcasting needs.
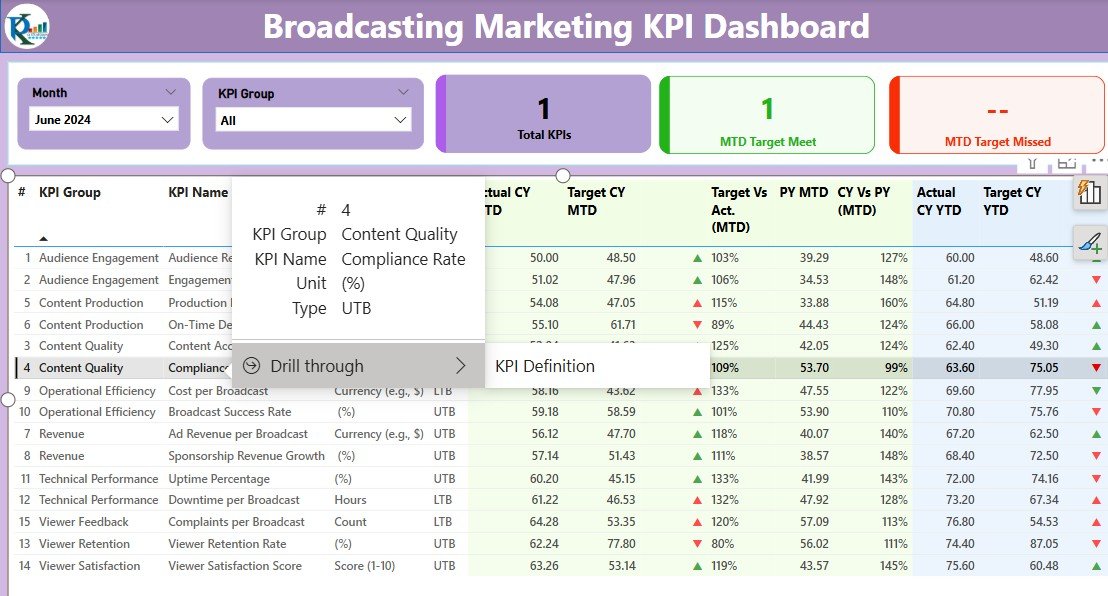
How to Use the Broadcasting KPI Dashboard in Power BI
1️⃣ Download the Template: Instantly access the Broadcasting KPI Dashboard in Power BI.
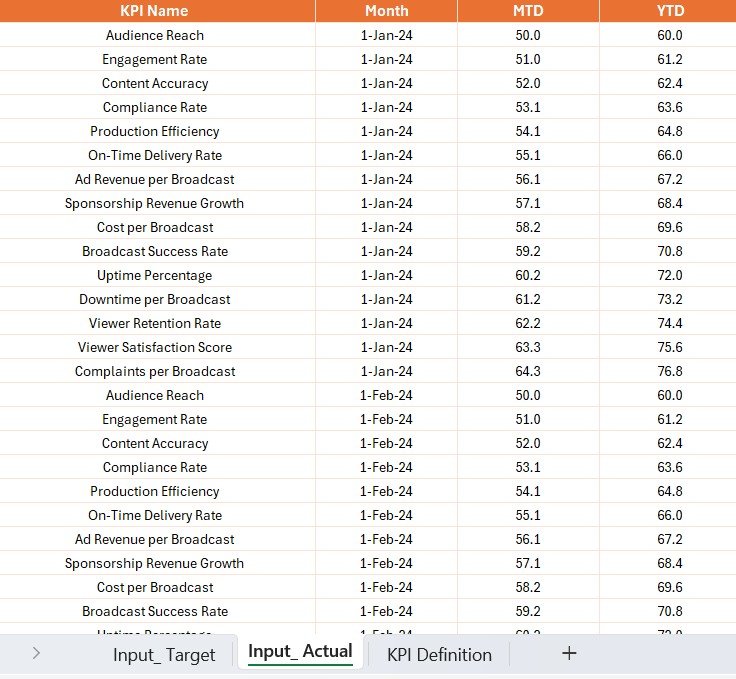
2️⃣ Integrate Your Data Sources: Link your viewership, content, and ad revenue data to the dashboard.
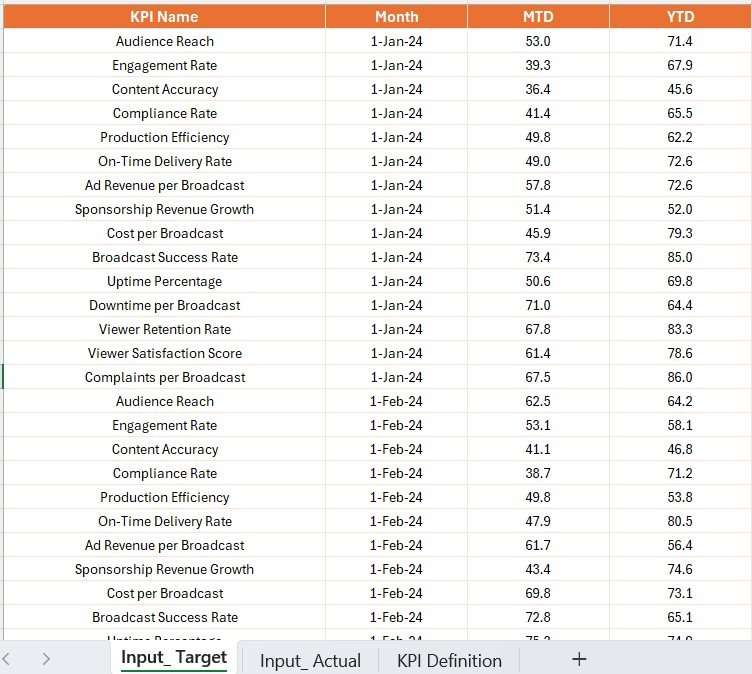
3️⃣ Track KPIs & Performance: Monitor critical broadcasting metrics, including audience engagement and content success.
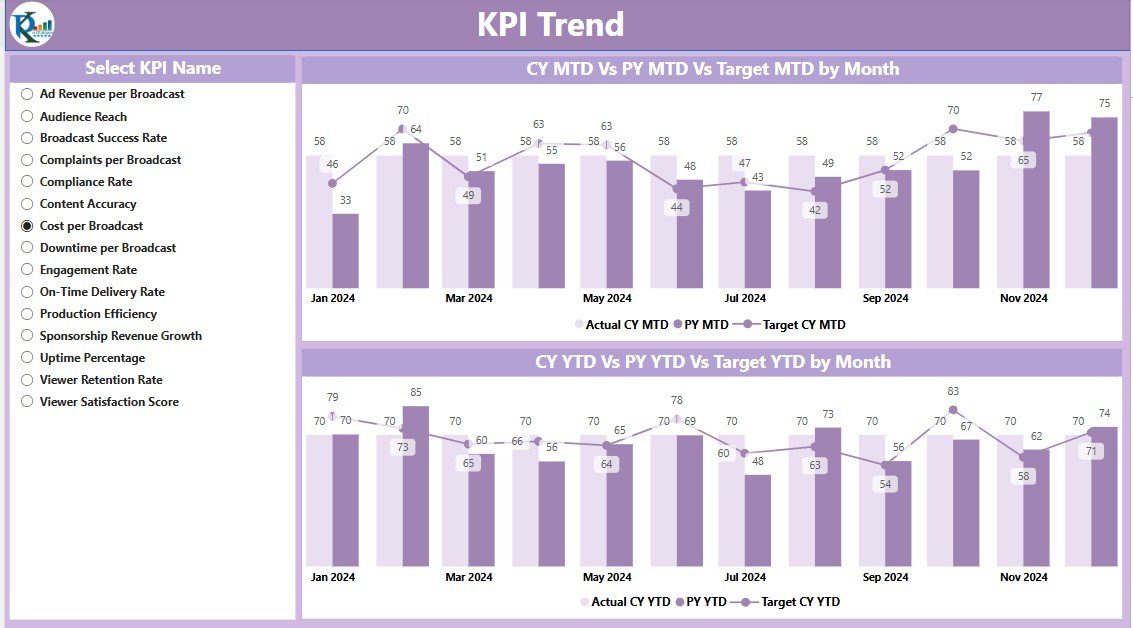
4️⃣ Analyze Trends & Data: Use time-based analysis to identify trends and areas for improvement.
5️⃣ Optimize Your Broadcasting Strategy: Use insights to refine content creation, ad strategies, and audience engagement.
Who Can Benefit from the Broadcasting KPI Dashboard in Power BI?
🔹 Broadcasting Networks & Media Agencies
🔹 Content Creators & Streaming Platforms
🔹 Marketing Teams & Ad Sales Departments
🔹 Audience Analysts & Data Scientists
🔹 Business Owners in the Media Industry
🔹 TV & Radio Stations, Digital Media Providers
🔹 Media Planners & Campaign Managers
Ensure that your broadcasting strategies are optimized with the Broadcasting KPI Dashboard in Power BI. Track viewership, analyze audience engagement, and optimize advertising revenue with this powerful tool.
Click here to read the Detailed blog post
Visit our YouTube channel to learn step-by-step video tutorials
Youtube.com/@PKAnExcelExpert


Reviews
There are no reviews yet.