In the fast-moving world of biotechnology, data drives discovery 🔬. From research and development to production quality and compliance, every metric matters — and managing it efficiently is critical. That’s why the Biotechnology KPI Scorecard in Excel is the perfect tool for biotech professionals who want clarity, control, and insight in one place.
This ready-to-use, fully editable Excel template helps you track, analyze, and visualize KPIs (Key Performance Indicators) across your biotech operations. It turns scattered data into easy-to-read visuals, helping you make informed, evidence-based decisions that accelerate innovation and growth 🚀.
⚙️ Key Features of the Biotechnology KPI Scorecard in Excel
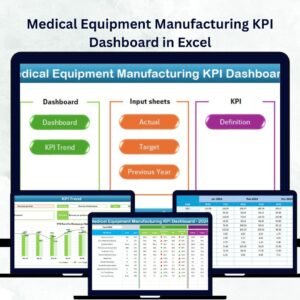
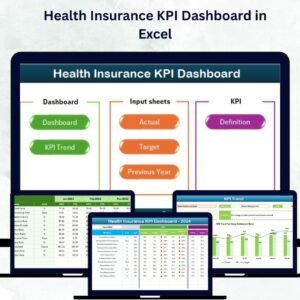
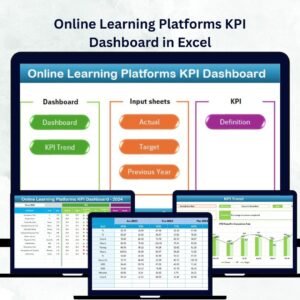
📊 4 Powerful Sheets – Scorecard, KPI Trend, Input Data, and KPI Definition for complete visibility.
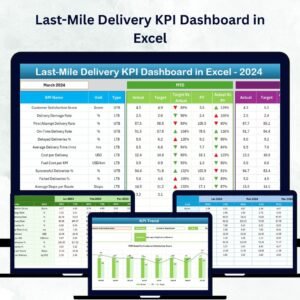
🎯 MTD & YTD Performance – Switch between Month-to-Date and Year-to-Date analysis instantly.
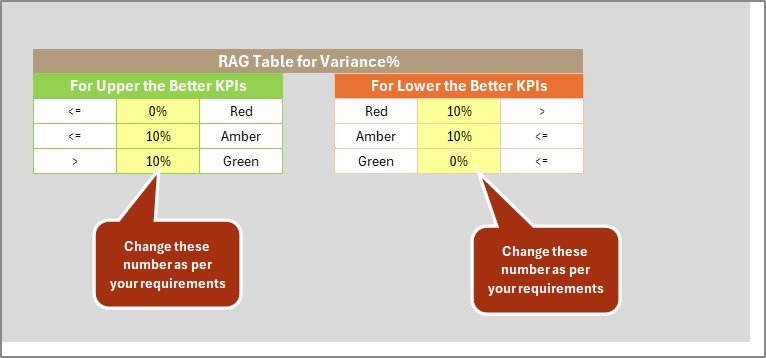
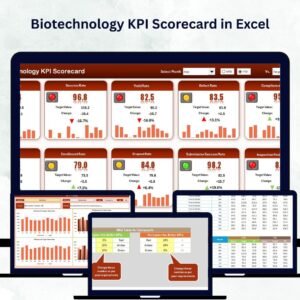
🟢 Color-Coded Indicators – Green = On Track ✅ | Yellow = Needs Attention ⚠️ | Red = Action Required ⛔
📈 Dynamic Charts – Visualize Actual vs Target vs Previous Year trends.
🧠 Automated Calculations – Excel formulas handle all comparisons for you.
💾 Centralized Data Entry – One Input Data sheet to update and refresh everything.
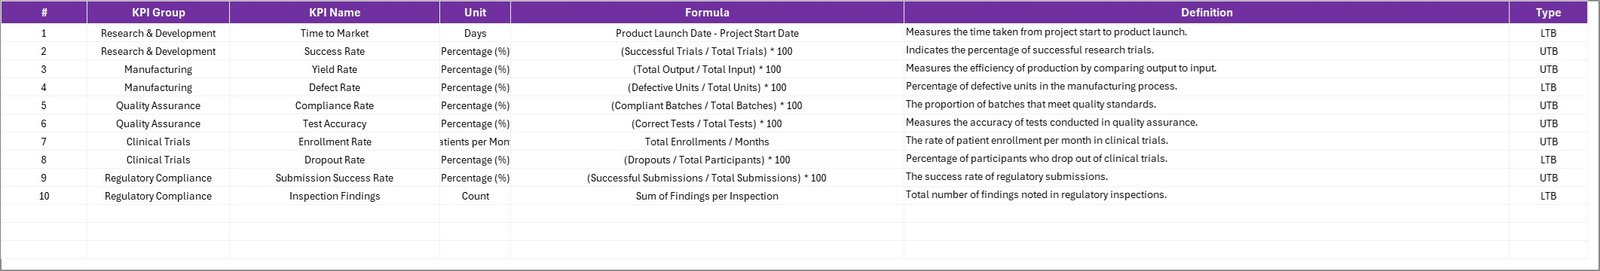
🔍 Transparent Definitions – Every KPI includes its group, unit, formula, and definition.
💰 No Expensive Software – 100 % Excel-based, no coding required.
📦 What’s Inside the Scorecard
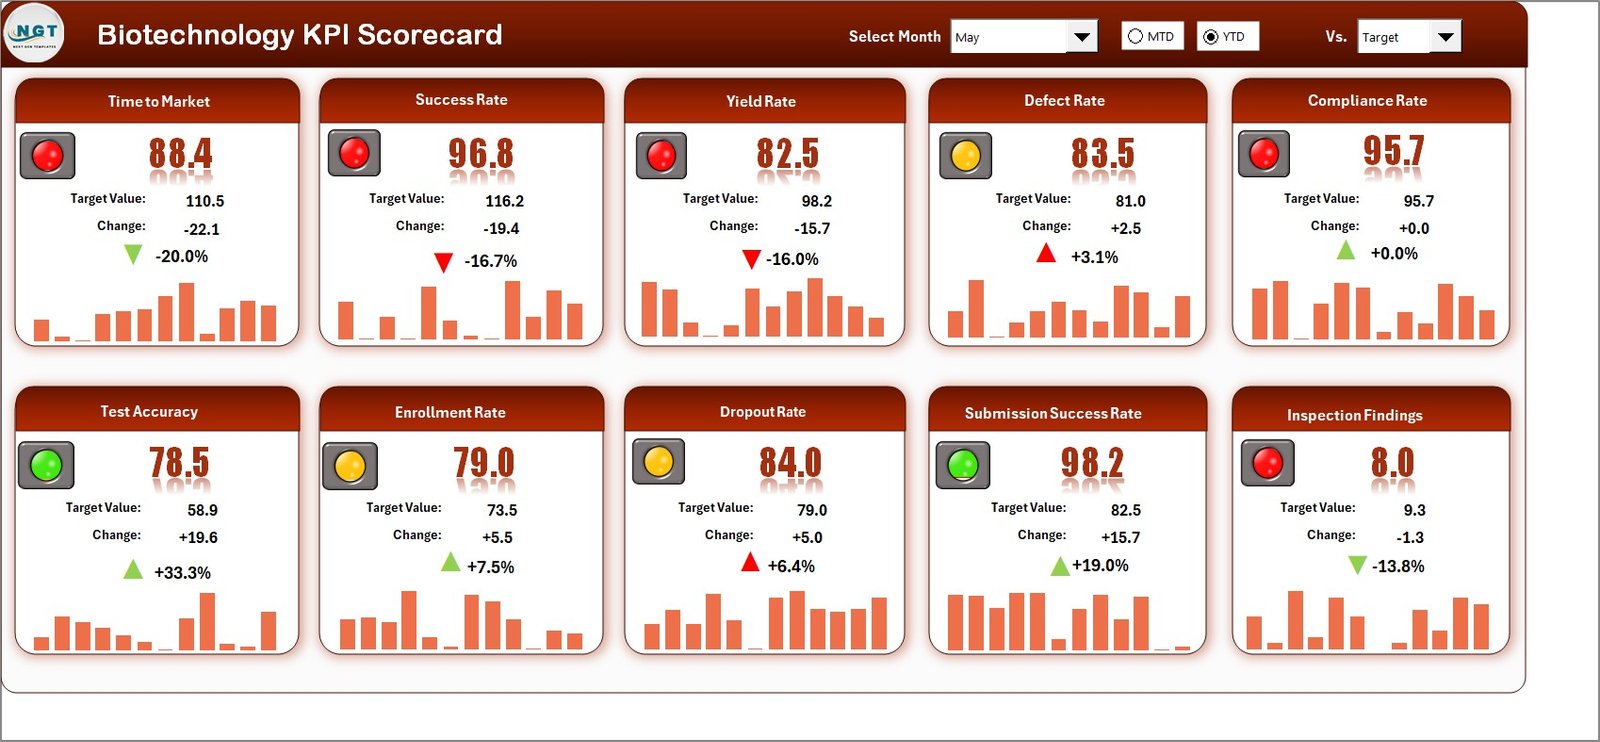
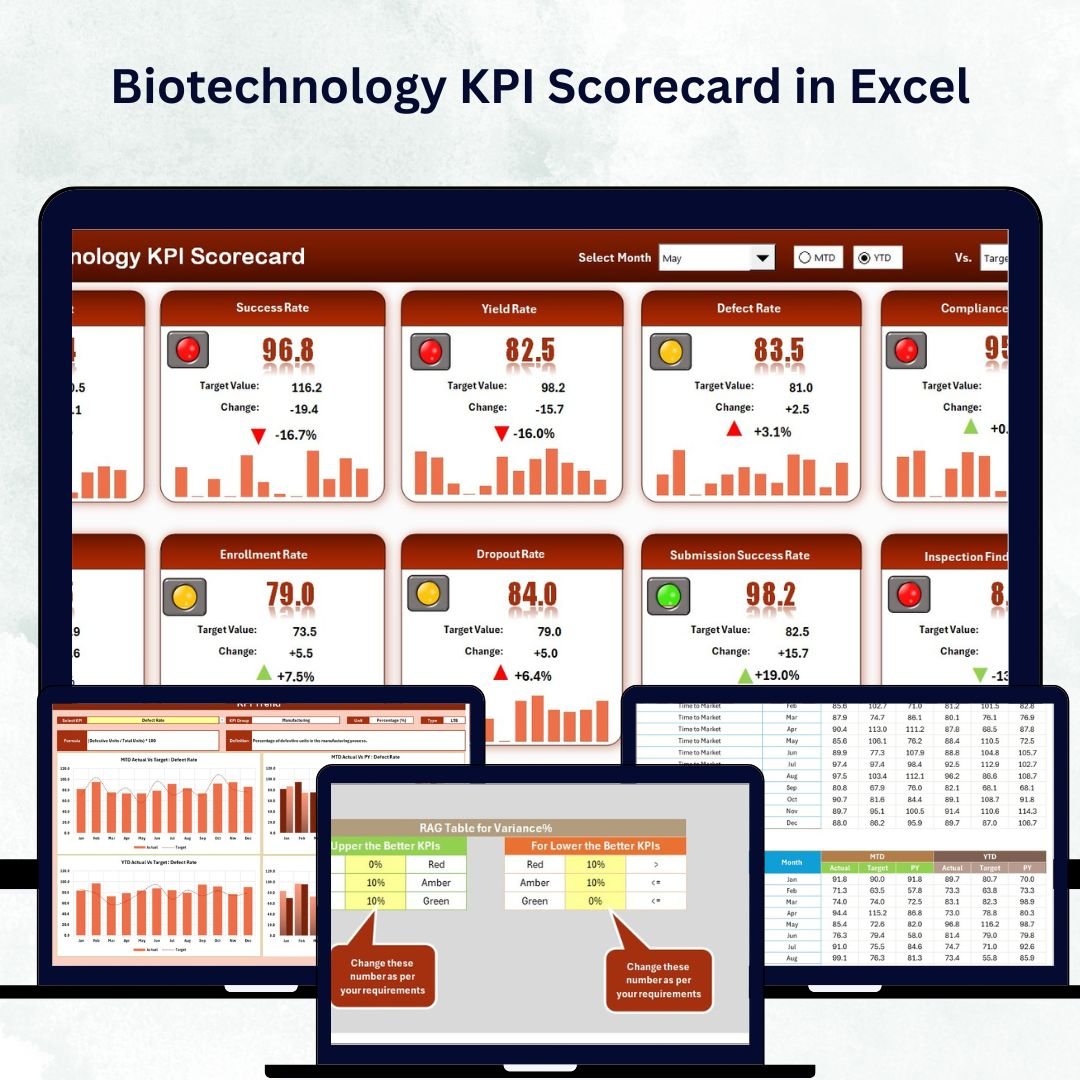
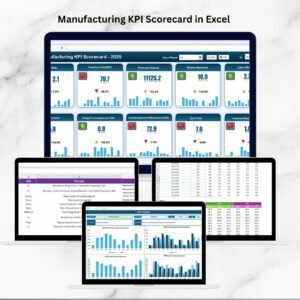
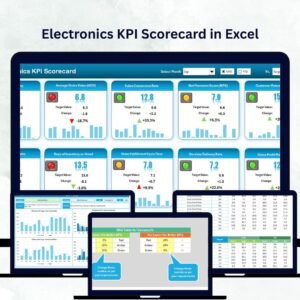
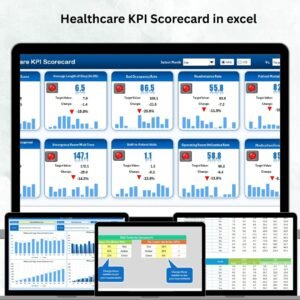
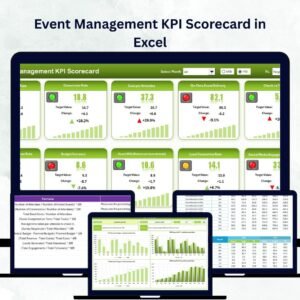
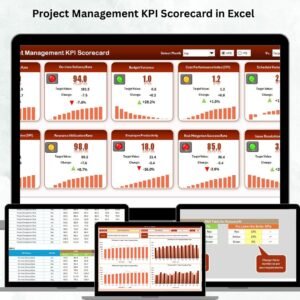
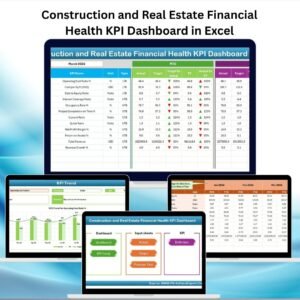
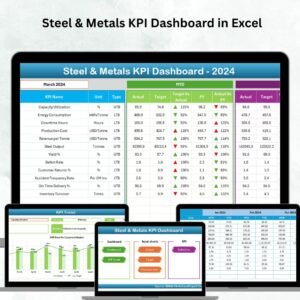
1️⃣ Scorecard Sheet – Your Performance Dashboard
This is your main control panel. Choose any month or toggle between MTD and YTD views to see how your biotech organization is performing.
-
Instant Overview: Compare Actual vs Target for each KPI.
-
Smart Visuals: Conditional formatting makes good or poor performance obvious.
-
Executive Snapshot: Perfect for monthly review meetings.
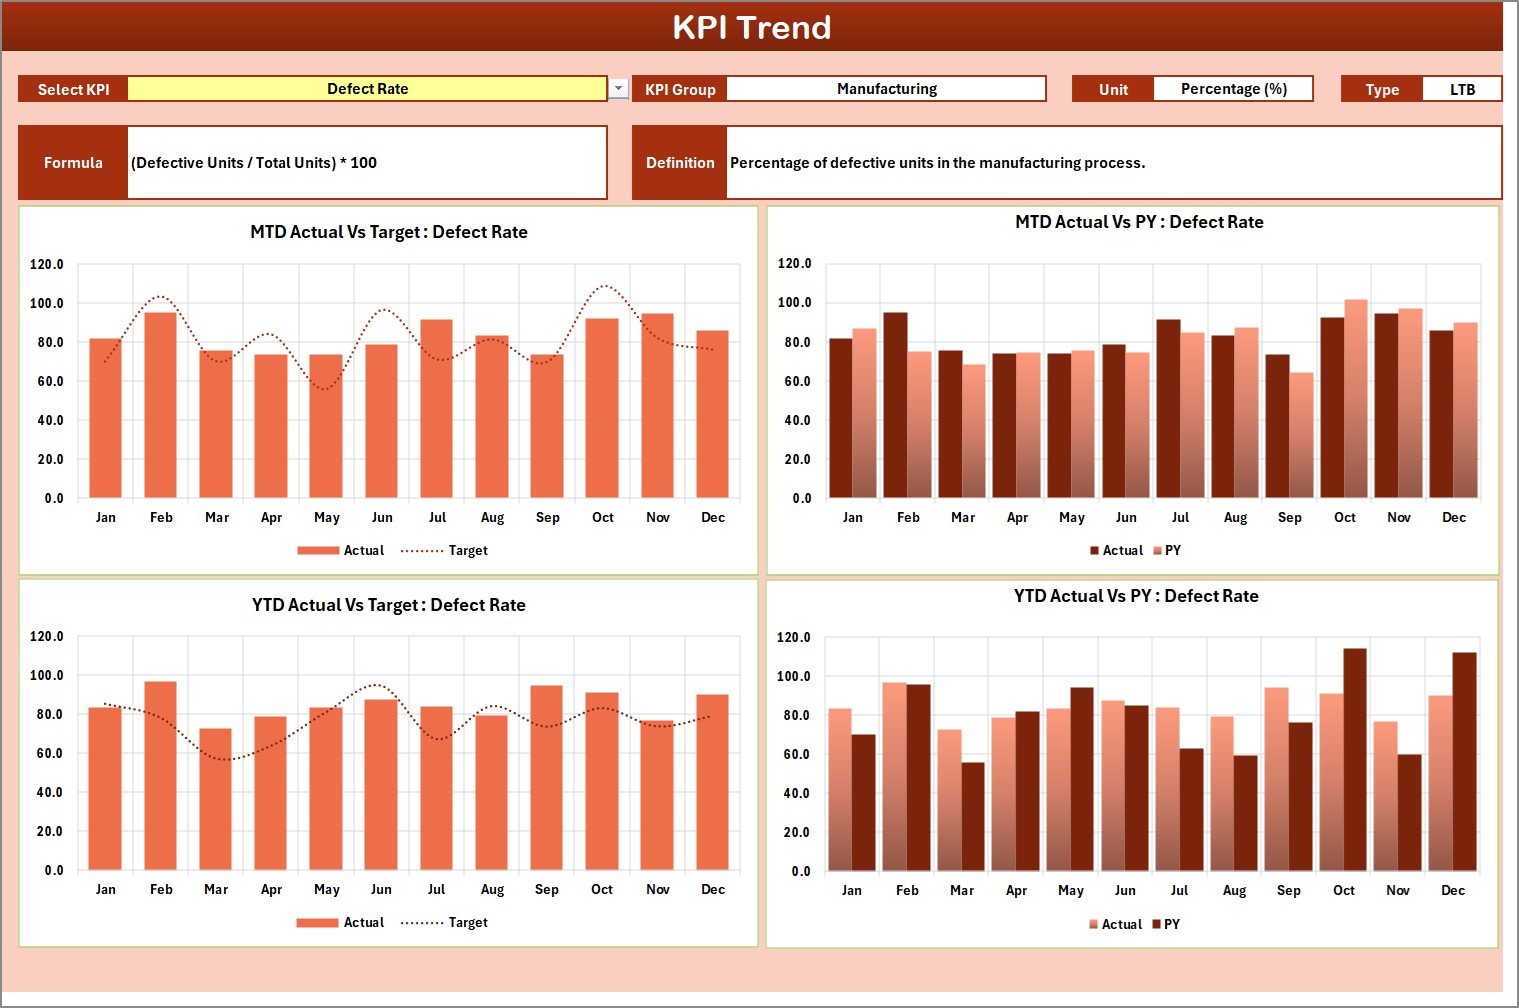
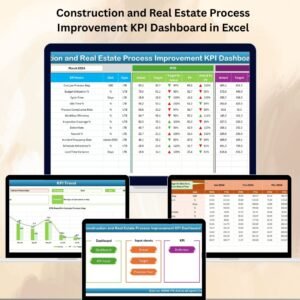
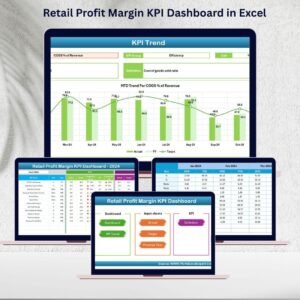
2️⃣ KPI Trend Sheet – Analyze Progress Like a Scientist
Select any KPI (cell C3) to reveal its full analytical profile: group, unit, formula, type (LTB or UTB), and definition.
Line and bar charts show how Actual and Target values evolve month by month, allowing you to pinpoint performance peaks and dips 📉📈.
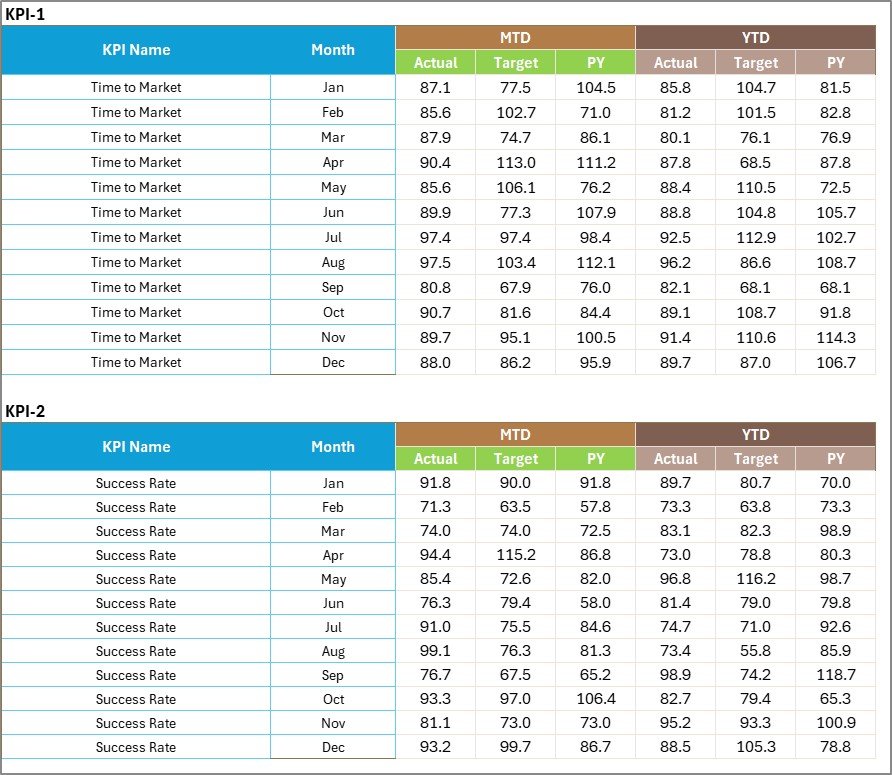
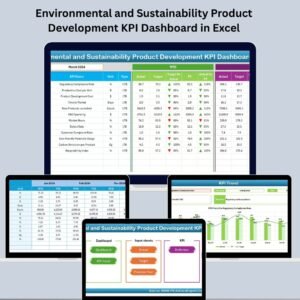
3️⃣ Input Data Sheet – The Data Engine
Record all Actual, Target, and Previous Year values in one place.
Excel automatically refreshes every calculation and chart, ensuring your reports are always up to date.
4️⃣ KPI Definition Sheet – Clarity for Everyone
Each KPI is defined with its category, unit, formula, and meaning so every team member interprets the data consistently — vital for regulated industries like biotech 💡.
🧬 Typical KPIs Tracked in Biotechnology
🔬 Research & Development – Experiment Success Rate (%), New Molecules Developed, Average Testing Time (Days), R&D Cost per Project.
🏭 Production – Batch Yield (%), Downtime Hours, Equipment Utilization Rate, On-Time Batch Completion (%).
🧪 Quality Control – Compliance Error Rate, Defect Rate per Batch, Lab Test Accuracy (%), Quality Audit Score.
🚚 Supply Chain – Supplier On-Time Delivery (%), Inventory Turnover, Material Availability Rate.
💵 Corporate & Finance – Revenue Growth (%), R&D Spend as % of Revenue, Profit Margin (%).
Together, these KPIs offer a 360° view of your biotech operations, ensuring every department is aligned toward excellence.
🧭 How to Use the Scorecard Effectively
1️⃣ Set clear monthly or annual targets for each KPI.
2️⃣ Update the Input Data sheet regularly to keep figures accurate.
3️⃣ Use the KPI Trend sheet to spot patterns or anomalies.
4️⃣ Review performance monthly and adjust strategies as needed.
5️⃣ Share the Scorecard sheet with teams for transparent performance communication.
No complex setup is needed — everything runs through built-in Excel formulas ⚙️.
🌟 Advantages of Using the Biotechnology KPI Scorecard in Excel
✅ Simplifies Complex Data – Turns hundreds of data points into clear, actionable visuals.
✅ Encourages Data-Driven Culture – Empowers teams to base decisions on facts, not assumptions.
✅ Improves Efficiency – Spot gaps and bottlenecks quickly.
✅ Ensures Regulatory Readiness – Track compliance and quality metrics easily.
✅ Enables Continuous Improvement – Measure → Review → Refine for ongoing success.
✅ Budget-Friendly – No licensing fees or IT dependencies.
💡 Best Practices for Maximum Impact
-
🎯 Align KPIs with strategic objectives.
-
📐 Keep definitions and formulas consistent across departments.
-
🔁 Automate calculations with SUMIFS, AVERAGEIFS & IFERROR.
-
🕒 Update data monthly for accurate MTD/YTD results.
-
🧩 Use color-coding and charts for fast insights.
-
🧑🤝🧑 Engage stakeholders to own their KPIs.
Follow these tips to turn your scorecard into a continuous-improvement system rather than a static report 📈.


Reviews
There are no reviews yet.