In today’s fast-moving financial industry, banks must continuously monitor operational efficiency, financial performance, customer satisfaction, and regulatory compliance. However, many banking institutions still depend on manual reports and disconnected spreadsheets, making performance tracking slow, complex, and error-prone.
The Banking KPI Scorecard in Google Sheets is a smart, ready-to-use performance management solution designed to simplify banking analytics. This professionally structured scorecard helps financial institutions track key performance indicators (KPIs), compare targets with actual performance, analyze trends, and make data-driven decisions — all within an easy and collaborative Google Sheets environment.
Instead of reviewing lengthy financial reports, managers can instantly evaluate performance using visual indicators, automated calculations, and centralized data tracking. Whether you want to improve operational efficiency, monitor financial health, or strengthen strategic planning, this scorecard converts complex banking data into clear and actionable insights.
Because the template is built in Google Sheets, teams benefit from cloud accessibility, real-time collaboration, and seamless sharing without investing in expensive analytics software.
🏦 Key Features of Banking KPI Scorecard in Google Sheets
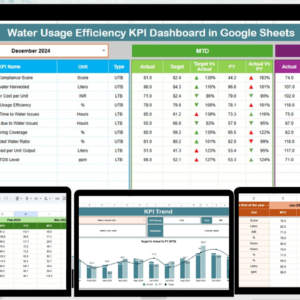
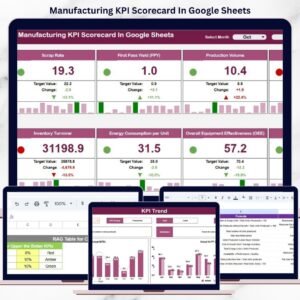
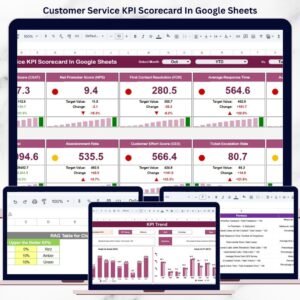
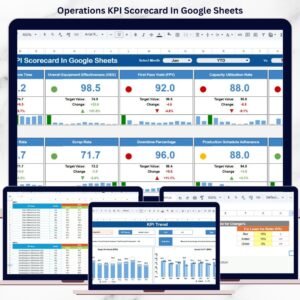
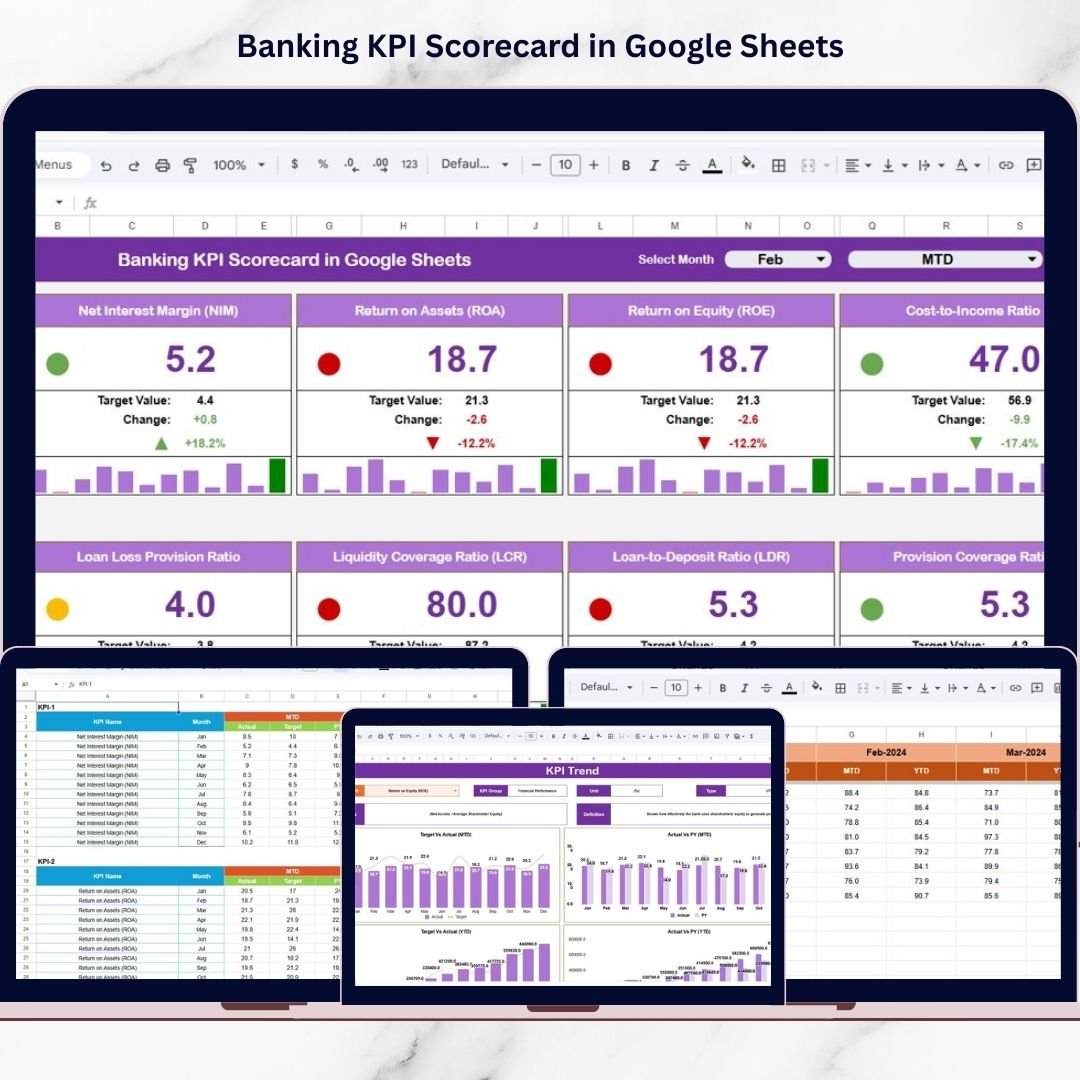
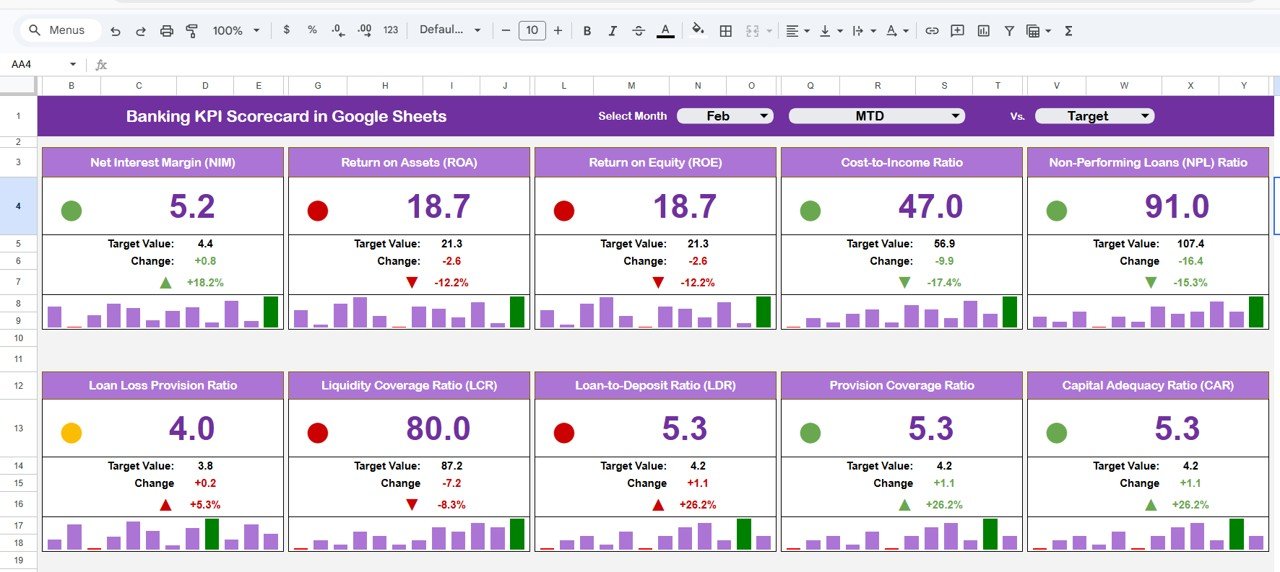
✅ Interactive KPI Scorecard Dashboard – Monitor banking performance through a centralized executive-level view.
✅ MTD & YTD Performance Analysis – Switch between Month-To-Date and Year-To-Date performance instantly.
✅ Automatic KPI Updates – Dashboard numbers refresh automatically based on selected month.
✅ Visual Traffic Light Indicators – Performance status displayed using color signals and arrows for quick interpretation.
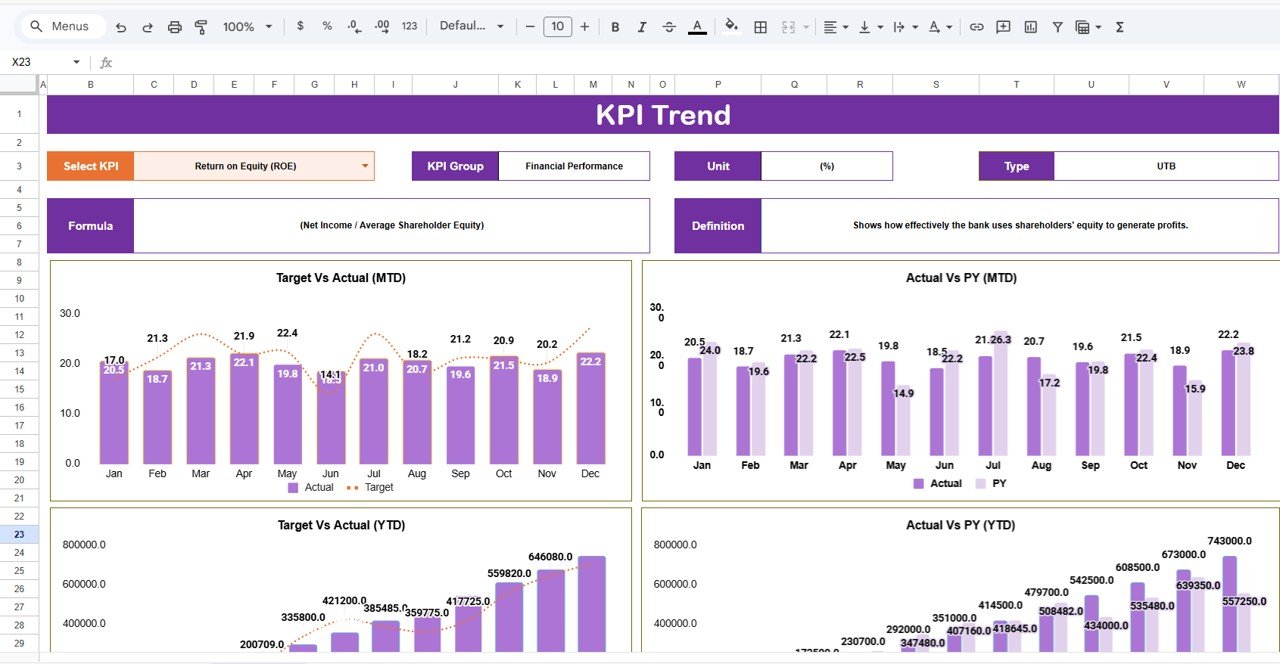
✅ Dynamic KPI Trend Analysis – Track KPI progress over time using automated trend visuals.
✅ Standardized KPI Definitions – Maintain consistent KPI understanding with formulas and definitions.
✅ Cloud Collaboration – Multiple team members can update and review data simultaneously.
✅ Fully Customizable Structure – Modify KPIs, targets, and performance metrics based on banking requirements.
📊 What’s Inside the Banking KPI Scorecard in Google Sheets
This ready-to-use template includes structured worksheets designed for complete banking performance monitoring:
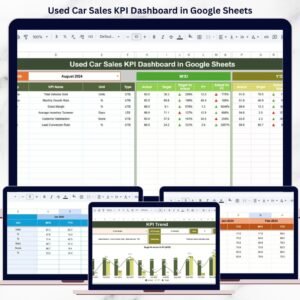
📈 Scorecard Dashboard Sheet
The main performance overview displaying KPI comparisons, visual indicators, and automated analysis.
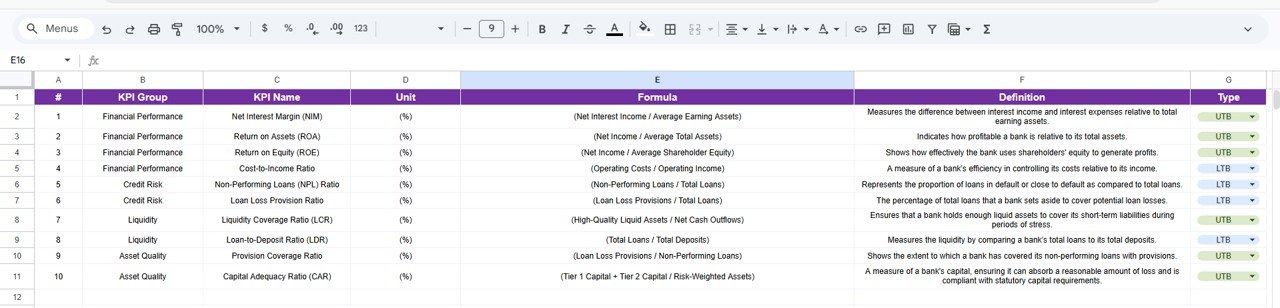
📉 KPI Trend Sheet
Provides detailed KPI trend monitoring along with KPI group, unit, formula, and definition.
📘 KPI Definition Sheet
Standardizes KPI structure by storing KPI names, formulas, and definitions.
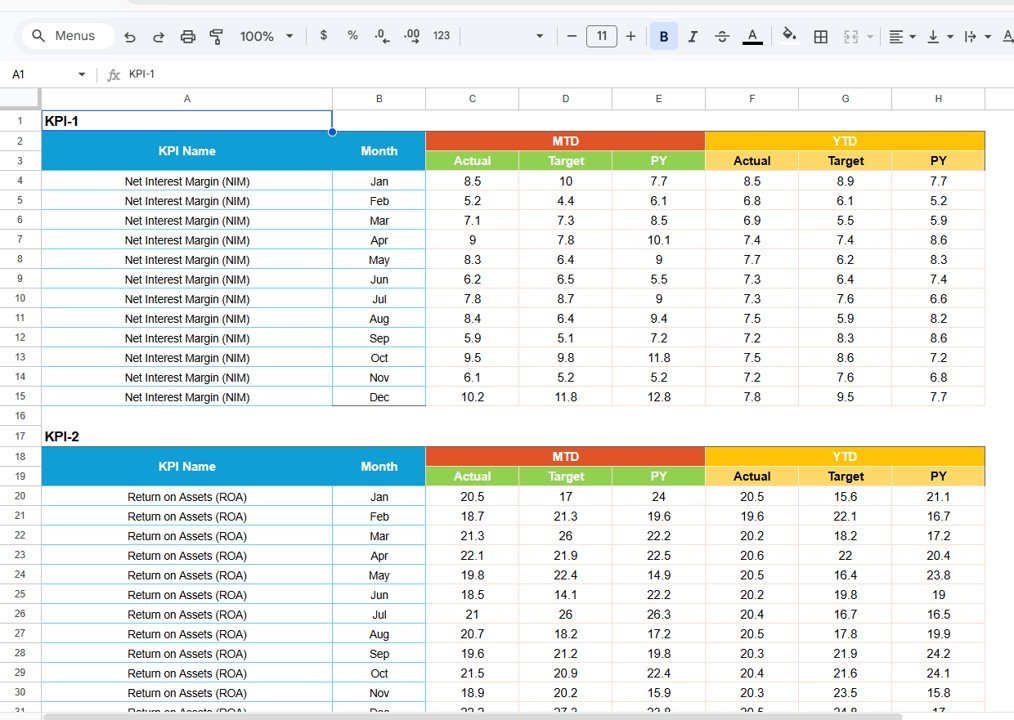
🧾 Data Input Sheet
Centralized location for entering monthly operational and financial performance data.
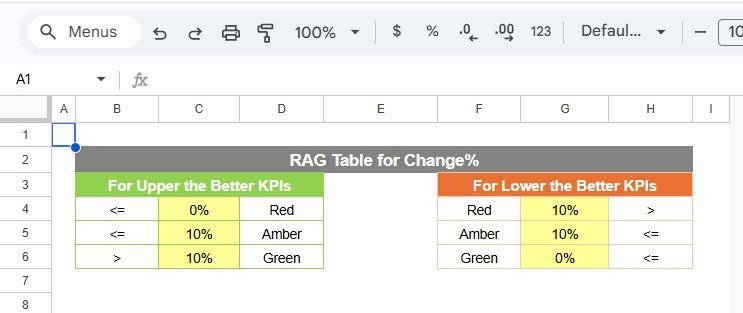
🎨 Colour Settings Sheet
Controls traffic light indicators and performance thresholds for visual analysis.
Together, these sheets create a comprehensive banking performance monitoring system.
⚙️ How to Use the Banking KPI Scorecard in Google Sheets
Using the scorecard is simple and efficient:
1️⃣ Define KPIs in the KPI Definition sheet.
2️⃣ Enter monthly performance data in the Data Input sheet.
3️⃣ Configure performance thresholds in Colour Settings.
4️⃣ Select the reporting month from the dashboard dropdown.
5️⃣ Review KPI performance instantly in the Scorecard dashboard.
6️⃣ Analyze long-term trends using the KPI Trend sheet.
Within minutes, banking teams can transform raw financial data into meaningful performance insights.
👥 Who Can Benefit from This Banking KPI Scorecard
This template is ideal for financial institutions and professionals responsible for performance monitoring.
🏦 Industries & Organizations
-
Commercial Banks
-
Cooperative Banks
-
Financial Institutions
-
Credit Unions
-
Lending Organizations
👨💼 Professionals
-
Banking Managers
-
Financial Analysts
-
Operations Managers
-
Risk & Compliance Teams
-
Strategy & Performance Teams
Whether managing branch performance or overall banking operations, this scorecard provides clarity and control.
By implementing this Banking KPI Scorecard, organizations gain:
✔ Centralized performance monitoring
✔ Faster reporting and analysis
✔ Improved operational visibility
✔ Better strategic decision-making
✔ Enhanced regulatory readiness
Google Sheets combines flexibility, automation, and collaboration — enabling banks to build a data-driven performance culture without technical complexity or high costs.
Organizations that adopt structured KPI tracking move toward smarter, more efficient, and insight-driven banking operations.
### Click here to read the Detailed blog post
Watch the step-by-step video tutorial: