


Aquaculture, also known as fish farming, has become one of the fastest-growing food production industries worldwide. With rising global demand, businesses in aquaculture must carefully monitor production efficiency, sustainability, and profitability. However, managing performance metrics manually can be overwhelming, error-prone, and time-consuming.
That’s why we created the Aquaculture KPI Dashboard in Power BI—a ready-to-use, interactive, and visually appealing solution designed to transform aquaculture data into actionable insights. By connecting your Excel data file to Power BI, you can analyze KPIs in real-time, compare performance across months and years, and ensure better decision-making.
Whether you manage a small fish farm or a large aquaculture enterprise, this dashboard provides everything you need to track operational success with precision.
✨ Key Features of the Aquaculture KPI Dashboard
📊 Summary Page – Your Central Overview
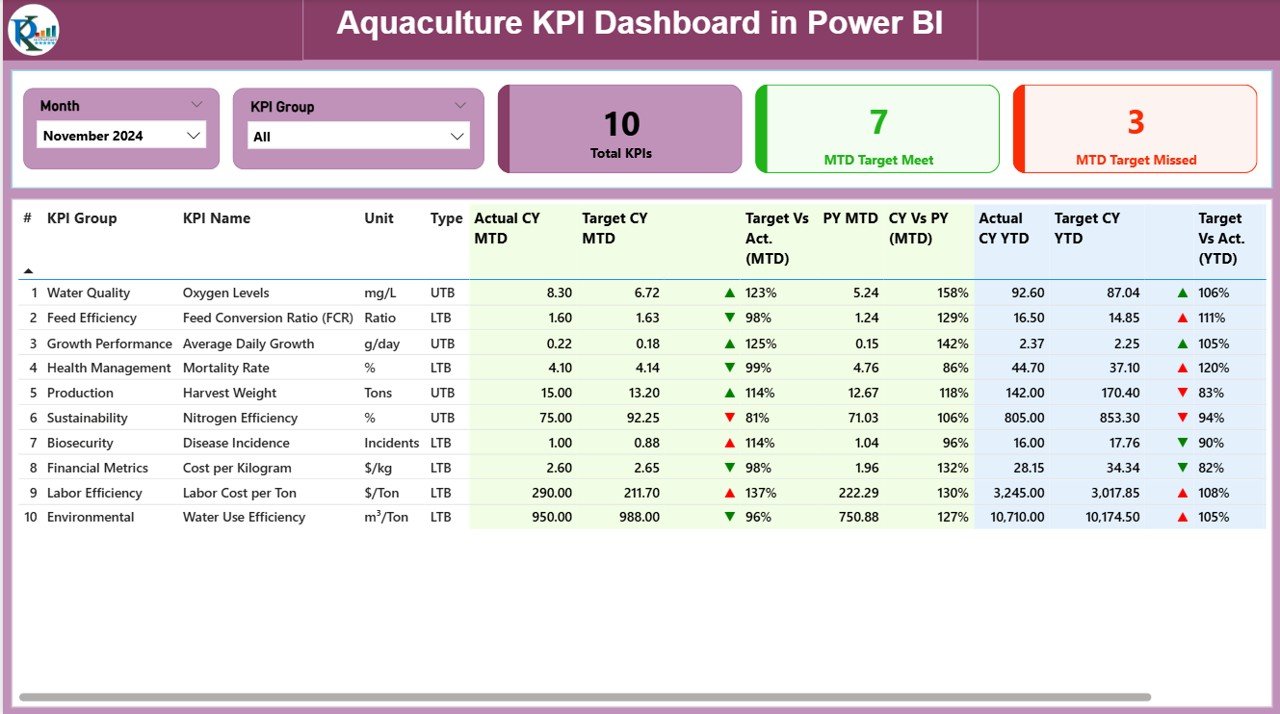
The Summary Page is the heart of the dashboard. It gives a complete snapshot of your KPIs at a glance.
-
Slicers: Quickly filter by Month and KPI Group.
-
Cards: Instantly view Total KPIs Count, MTD (Month-to-Date) Target Met, and MTD Target Missed.
-
Detailed KPI Table: Displays essential metrics including:
-
KPI Number, Group, and Name
-
Unit of Measurement
-
KPI Type (UTB = Upper the Better / LTB = Lower the Better)
-
Actual CY MTD & Target CY MTD
-
Percentage comparison for Target vs Actual (MTD)
-
Previous Year MTD (PY MTD) vs Current Year MTD (CY MTD)
-
Actual CY YTD & Target CY YTD
-
Percentage comparison for Target vs Actual (YTD)
-
Previous Year YTD (PY YTD) vs Current Year YTD (CY YTD)
-
Icons (▲ ▼) in green or red to indicate KPI status visually
-
This page helps managers instantly identify strengths and weaknesses in aquaculture operations.
📈 KPI Trend Page – Visual Performance Tracking
The KPI Trend Page focuses on long-term analysis.
-
Combo Charts: Compare Actual Numbers (Current Year, Previous Year, and Targets) for both MTD and YTD.
-
Slicer: Select a specific KPI to see detailed historical trends.
This page is essential for identifying whether your aquaculture initiatives are improving, stable, or declining over time.
📑 KPI Definition Page – Transparent KPI Logic
The KPI Definition Page ensures clarity and consistency.
-
Contains Formula, Unit, Definition, and KPI Type for each metric.
-
Designed as a drill-through page (hidden by default).
-
Users can click from the Summary Page to understand the logic behind each KPI.
This feature ensures that everyone in your organization speaks the same language when it comes to performance tracking.
📂 Excel Data Source – Easy to Manage
The dashboard is powered by a simple Excel file that you can update easily. It includes three worksheets:
-
Input_Actual Sheet – Enter Actual numbers for each KPI, along with Month (first date), MTD, and YTD.
-
Input_Target Sheet – Enter Target numbers for each KPI, with Month, MTD, and YTD.
-
KPI Definition Sheet – Fill in KPI Number, Group, Name, Unit, Formula, Definition, and Type (UTB or LTB).
This structure ensures accuracy, consistency, and easy updates without advanced technical knowledge.
✅ Advantages of the Aquaculture KPI Dashboard
-
Centralized Data – Track all aquaculture KPIs in one place.
-
Real-Time Insights – Automatically updates when Excel data is refreshed.
-
Better Decision-Making – Compare Actual vs Target vs Previous Year for smarter planning.
-
Cost-Effective – Built in Power BI, avoiding expensive software costs.
-
User-Friendly – No coding required; just plug in your Excel file.
-
Transparency – KPI definitions ensure clear understanding across teams.
-
Scalability – Works for small fish farms or large-scale aquaculture enterprises.
🔧 Opportunities for Improvement
-
Integration with IoT devices (water quality sensors, feeding systems).
-
Mobile Optimization for managers in the field.
-
Predictive Analytics to forecast fish growth and yield.
-
Mapping Features to monitor aquaculture sites visually.
-
Collaboration Tools for multi-stakeholder decision-making.
📌 Best Practices for Using the Dashboard
-
Update the Excel sheets regularly for accurate reporting.
-
Define KPIs clearly to match your aquaculture goals.
-
Use slicers to drill down into specific KPI groups or months.
-
Compare YTD vs PY YTD trends to identify seasonal variations.
-
Train staff on Power BI basics for smoother adoption.
-
Store Excel data in a secure shared location for collaborative access.
👥 Who Can Benefit?
-
Fish Farm Owners & Managers – Track daily efficiency.
-
Aquaculture Corporations – Monitor multiple farms in one dashboard.
-
NGOs & Researchers – Analyze sustainability and fish population growth.
-
Government Agencies – Ensure compliance and monitor aquaculture impact.
-
Investors – Review cost, production, and performance data before funding.
🚀 Conclusion
The Aquaculture KPI Dashboard in Power BI transforms raw aquaculture data into actionable insights. With dynamic charts, interactive filters, and automated updates, it empowers organizations to improve decision-making, boost efficiency, and achieve sustainable growth.
By combining Excel’s simplicity with Power BI’s visualization power, this tool is a must-have for anyone serious about aquaculture management.


Reviews
There are no reviews yet.