If you don’t track service performance properly, response times increase, complaints pile up, and customer loyalty starts fading.
That’s where the After-Sales Service KPI Dashboard in Google Sheets becomes your secret weapon.
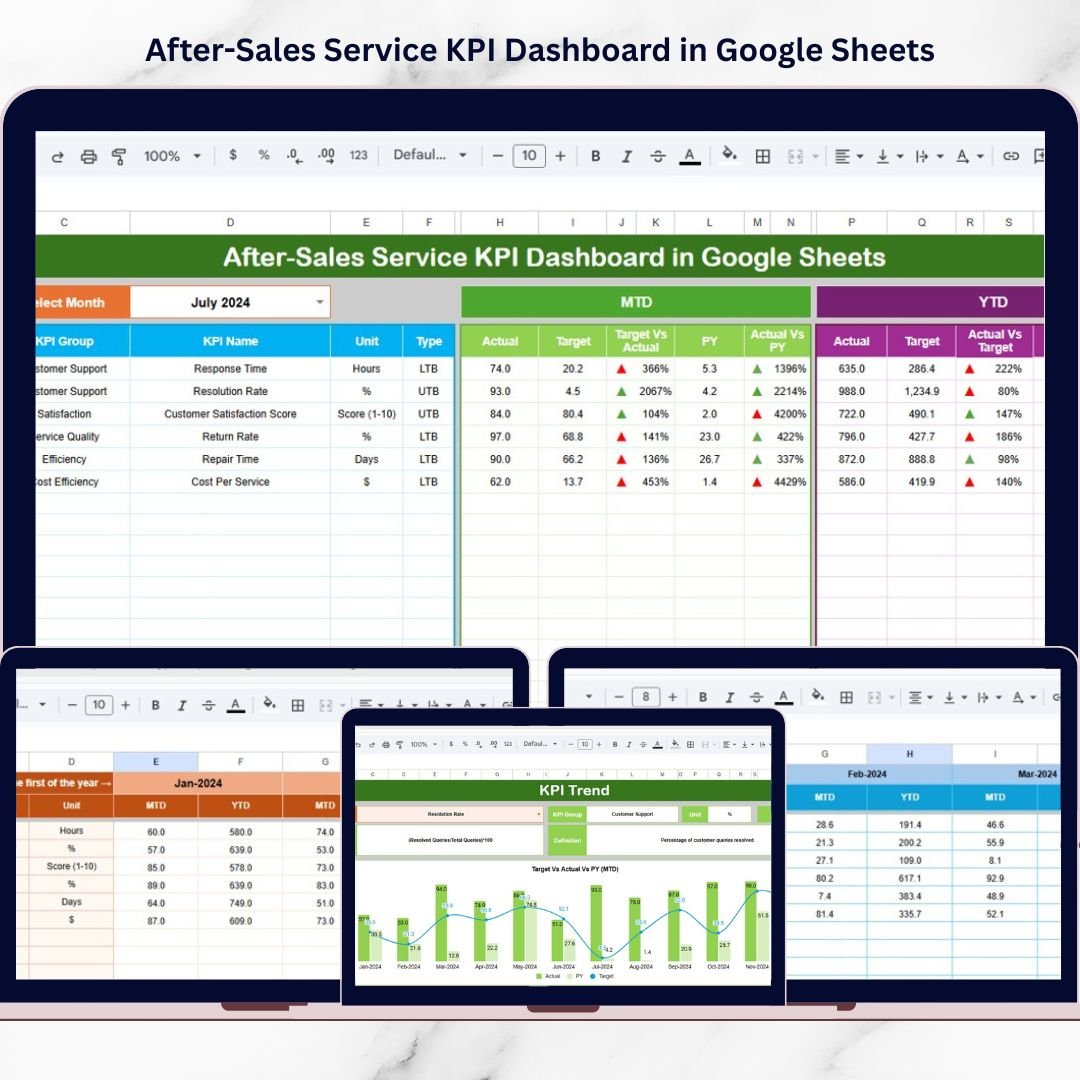
This ready-to-use, cloud-based dashboard is designed to help you monitor service quality, response time, resolution rate, team productivity, and performance trends — all inside one structured Google Sheets system.
No expensive software.
No complex setup.
No scattered reports.
Just clean, automated, real-time performance tracking.
Because it works in Google Sheets, your team can collaborate from anywhere. Whether you’re managing support teams, service engineers, or customer care agents, this dashboard gives you complete visibility over your after-sales operations.
Key Feature of After-Sales Service KPI Dashboard in Google Sheets
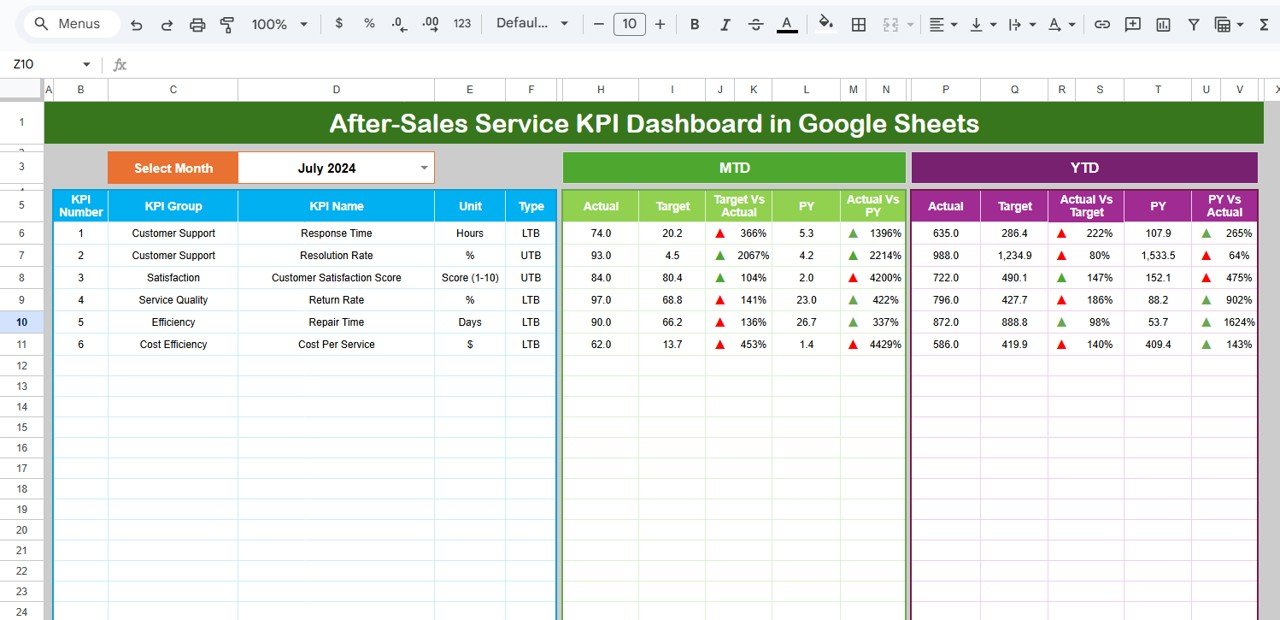
📊 Dynamic Dashboard View – Select any month from Cell D3 and instantly update all KPI values across the dashboard.
🎯 MTD & YTD Performance Tracking – Compare Month-to-Date and Year-to-Date performance with targets and previous year data.
📈 Target vs Actual Analysis – Instantly identify performance gaps using automated comparisons.
🔄 Previous Year Benchmarking – Measure improvement trends and service growth clearly.
📉 Conditional Formatting Indicators – Up/down arrows visually highlight performance direction.
📂 6 Structured Worksheets – Organized sheets for dashboard, trends, targets, actual data, previous year, and KPI definitions.
☁️ Cloud-Based Collaboration – Access from anywhere and collaborate with your team in real time.
What’s Inside the After-Sales Service KPI Dashboard in Google Sheets
This professional dashboard includes 6 well-structured worksheets:
1️⃣ Dashboard Sheet
The main performance control center. Displays MTD and YTD Actual, Target, and Previous Year data with automated comparisons and visual indicators.
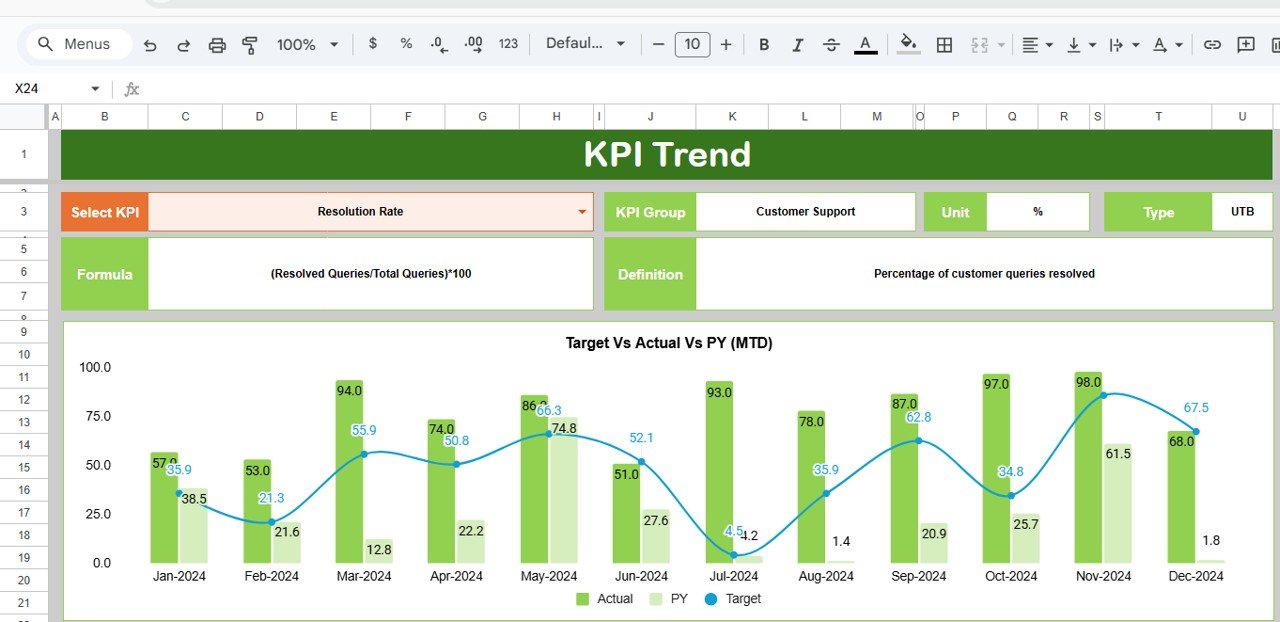
2️⃣ KPI Trend Sheet
Select any KPI in Cell C3 and analyze detailed trend charts for MTD and YTD performance. View KPI group, unit, formula, type (Lower the Better or Upper the Better), and definition.
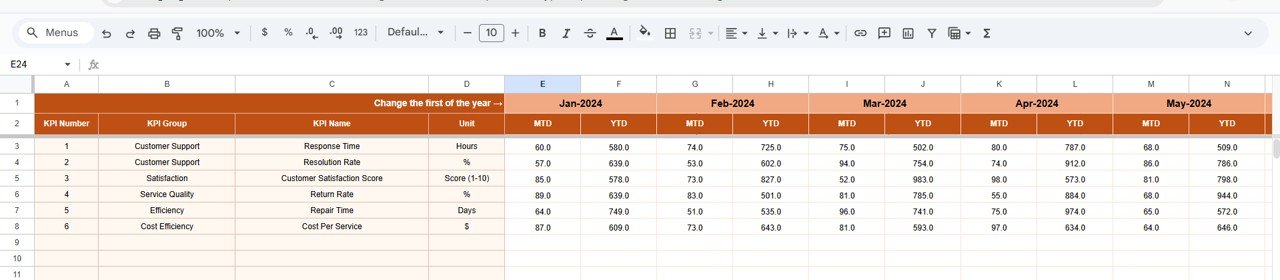
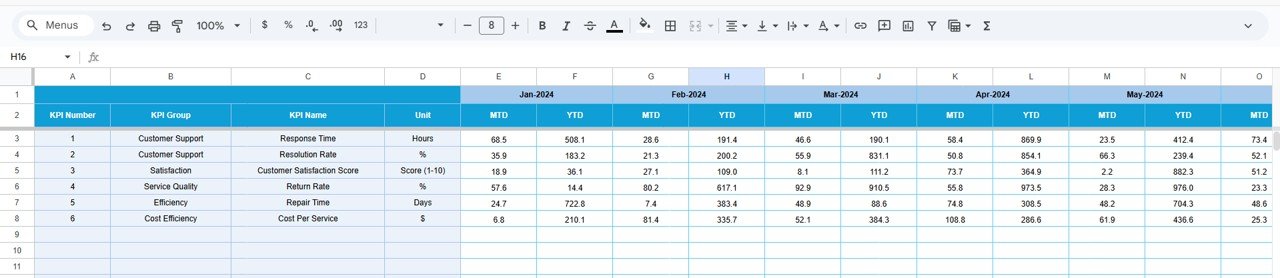
3️⃣ Actual Number Sheet
Enter monthly service performance data. Once updated, the dashboard refreshes automatically.
4️⃣ Target Sheet
Define MTD and YTD targets clearly to benchmark performance.
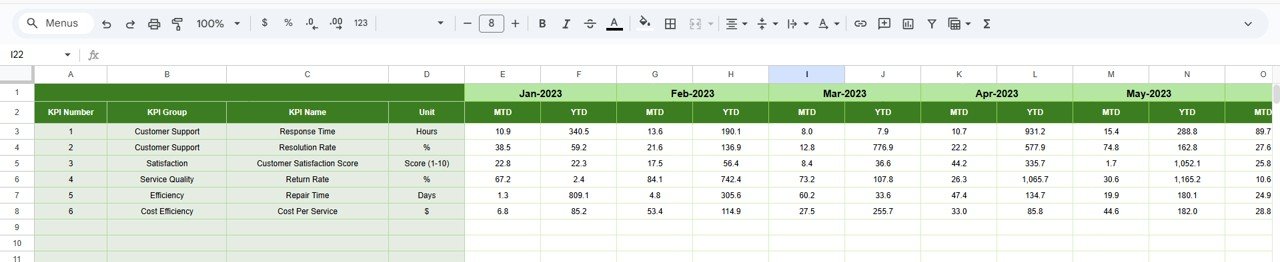
5️⃣ Previous Year Sheet
Input last year’s data to measure improvement and growth trends.
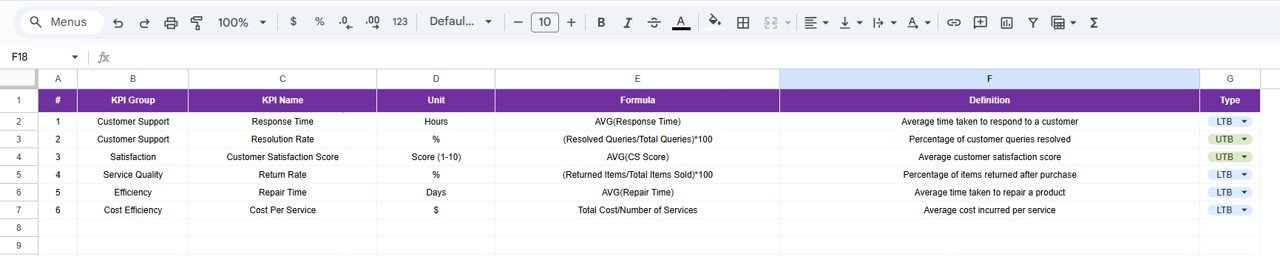
6️⃣ KPI Definition Sheet
Standardize KPI names, units, formulas, and definitions to align your entire team.
This structure ensures clarity, consistency, and accountability.
How to Use the After-Sales Service KPI Dashboard in Google Sheets
Using this dashboard is simple and efficient:
1️⃣ Enter your first month in Cell E1 of the Actual Sheet.
2️⃣ Update MTD and YTD values monthly.
3️⃣ Input KPI targets in the Target Sheet.
4️⃣ Add previous year data for benchmarking.
5️⃣ Use Cell D3 in the Dashboard to select a month.
6️⃣ Review KPI trends using the Trend Sheet.
Within minutes, your service performance insights become clear and actionable.
Who Can Benefit from This After-Sales Service KPI Dashboard in Google Sheets
This dashboard is ideal for:
🏢 Customer Service Managers
📞 Call Center Supervisors
🔧 Field Service Teams
🛒 Retail & E-commerce Businesses
🏭 Manufacturing Companies
📊 Operations Managers
📈 Business Owners
If your business handles customer service requests, support tickets, maintenance calls, or after-sales queries, this dashboard will transform the way you track performance.
Why This Dashboard Drives Customer Loyalty
When you monitor service metrics consistently:
✔ Response times reduce
✔ Resolution rates improve
✔ SLA breaches decrease
✔ Customer complaints drop
✔ Satisfaction scores rise
And when service improves, customer trust increases.
That means higher retention, repeat purchases, and long-term revenue growth.
This isn’t just a dashboard.
It’s your customer loyalty engine.
Click here to read the Detailed blog post
Watch the step-by-step video tutorial: