

ESG KPIs are the measurable environmental, social and governance metrics that prove a company’s sustainability performance to investors, regulators and customers. The 15 that matter most in 2026 are greenhouse-gas emissions, carbon intensity, renewable-energy share, energy and water intensity, waste diversion, Scope 3 coverage, safety (TRIR), turnover, leadership diversity, the pay gap, training hours, engagement, board independence and ethics-training completion.
Last updated: September 2026
Key takeaways
- The single most material ESG KPI is total greenhouse-gas emissions (Scope 1 + 2 + 3, in tCO₂e) — Scope 3 alone is usually 70–90% of the footprint, yet most reports still omit it.
- Every credible ESG KPI needs three things: an agreed formula, a benchmark range, and a normalisation (per revenue or per unit) so growth does not hide the trend.
- ESG splits into Environmental, Social and Governance — you need at least four to six live metrics in each pillar, not ten in one and none in the others.
- You do not need consultancy software to start: the ESG Dashboard in Excel tracks all three pillars for $17.99.
- The best value is the Energy & ESG Sustainability Bundle — 8 premium Excel and Power BI templates for $59.99 (50% off buying them separately).
ESG KPI dashboard templates compared
| Template | Format | Best for | Price |
|---|---|---|---|
| ESG Dashboard in Excel | Excel | Best overall — all three pillars in one file | $17.99 |
| Energy & ESG Sustainability Bundle | Excel + Power BI | Best value — 8 templates, save 50% | $59.99 |
| ESG KPI Dashboard in Power BI | Power BI | Board-ready interactive reporting | $11.99 |
| ESG Dashboard in Google Sheets | Google Sheets | Cloud teams, no Excel licence | $9.99 |
| ESG KPI Dashboard in Google Sheets | Google Sheets | Lightweight MTD/YTD KPI scorecard | $9.99 |
| Sustainability Operations KPI Dashboard | Excel | Plant and facility operations teams | $12.99 |
| Sustainability Compliance KPI Dashboard | Excel | Audit, permits and regulatory tracking | $12.99 |
| Sustainability Product Development KPI Dashboard | Excel | Eco-design and product R&D teams | $14.99 |
How we picked these ESG KPIs
We started from the disclosure metrics that the major frameworks — the GHG Protocol, GRI, SASB and the ISSB’s IFRS S1/S2 standards — treat as material, then cross-checked them against what CDP A-list companies actually report. We kept only KPIs that have a defensible formula and a public benchmark, dropped vanity metrics that cannot be audited, and made sure all three pillars were covered so no single dimension dominates the scorecard. Each metric below maps to a field you can populate in the NGT dashboards further down the page.
What are the 15 ESG KPIs to track in 2026?
The list is ranked by materiality — how heavily investors, rating agencies and regulators weight each metric. For every ESG KPI you get a one-sentence definition, the exact formula, a realistic benchmark range and the mistake teams make most often.
1. Total greenhouse-gas emissions (Scope 1 + 2 + 3)
Definition: The total greenhouse gases your organisation is responsible for, in tonnes of CO₂ equivalent, across direct operations, purchased energy and the value chain.
Formula: Scope 1 + Scope 2 + Scope 3 (tCO₂e) = Σ (activity data × emission factor).
Benchmark: Absolute footprint varies by sector; the signal that matters is year-on-year reduction. A science-based 1.5°C pathway needs roughly a 4.2% absolute cut every year.
Common mistake: Reporting only Scope 1 and 2 and quietly dropping Scope 3, which is typically 70–90% of the real footprint.
2. Carbon intensity
Definition: Emissions normalised against a business metric so performance is comparable as the company grows.
Formula: Total tCO₂e ÷ revenue (USD million), or ÷ units produced.
Benchmark: Leaders cut intensity 5–8% a year; always compare within your own GICS sub-industry, not across sectors.
Common mistake: Celebrating falling intensity while absolute emissions rise because output grew faster than efficiency.
3. Renewable energy percentage
Definition: The share of total energy consumption sourced from renewables.
Formula: (Renewable energy consumed ÷ total energy consumed) × 100.
Benchmark: RE100 members target 100% by 2030; the current global corporate average sits around 30–40%.
Common mistake: Counting unbundled renewable energy certificates as equivalent to on-site generation or a real power-purchase agreement.
4. Energy intensity
Definition: Energy consumed per unit of output or revenue.
Formula: Total energy consumed (MWh or GJ) ÷ revenue or production volume.
Benchmark: A 1–3% annual efficiency improvement is a common and achievable corporate target.
Common mistake: Mixing on-site fuel and grid electricity without converting both to a common energy unit, which makes the trend meaningless.
5. Water withdrawal intensity
Definition: Freshwater withdrawn per unit of revenue or production, weighted toward water-stressed regions.
Formula: Total water withdrawn (m³) ÷ revenue (USD million).
Benchmark: Highly sector-specific; the key flag is any facility sitting in a “high” or “extremely high” WRI Aqueduct water-stress basin.
Common mistake: Reporting total withdrawal but never the share drawn from stressed basins, which is exactly what investors weight.
6. Waste diversion (recycling) rate
Definition: The proportion of waste kept out of landfill and incineration through recycling, reuse or composting.
Formula: (Waste diverted ÷ total waste generated) × 100.
Benchmark: 50% is a baseline; zero-waste-to-landfill leaders reach 90% or more.
Common mistake: Counting waste-to-energy incineration as “diverted” when several frameworks explicitly do not.
7. Scope 3 category coverage
Definition: The share of the 15 Scope 3 categories you actually measure rather than estimate or omit.
Formula: (Scope 3 categories quantified ÷ relevant categories) × 100.
Benchmark: CDP A-list companies typically report six or more material categories using primary supplier data.
Common mistake: Staying on spend-based estimates forever instead of moving material categories to supplier-specific data.
8. Total Recordable Incident Rate (TRIR)
Definition: A workplace-safety rate counting recordable injuries and illnesses per 100 full-time employees per year.
Formula: (Recordable incidents × 200,000) ÷ total hours worked.
Benchmark: The US private-industry average is roughly 2.7; world-class operations run below 1.0.
Common mistake: Under-recording near-misses and first-aid cases, which hides the leading indicators of a serious event.
9. Employee turnover rate
Definition: The rate at which employees leave and must be replaced over a period.
Formula: (Separations during period ÷ average headcount) × 100.
Benchmark: Around 13% voluntary annual turnover is healthy; above 20% signals a pay or culture problem.
Common mistake: Blending voluntary and involuntary turnover into one figure that hides the real story.
10. Gender diversity in leadership
Definition: The share of women or under-represented groups in management and board roles.
Formula: (Women in leadership roles ÷ total leadership roles) × 100.
Benchmark: 30% is the widely cited “critical mass” threshold; parity is 50%.
Common mistake: Reporting a healthy overall-workforce diversity number while leadership stays homogeneous.
11. Gender pay gap
Definition: The difference in average pay between men and women across the organisation.
Formula: ((Median male pay − median female pay) ÷ median male pay) × 100.
Benchmark: 0% is the goal; the OECD average is about 12%.
Common mistake: Confusing the raw (unadjusted) gap with the like-for-like adjusted gap and publishing only whichever looks better.
12. Training hours per employee
Definition: Average formal learning and development hours delivered per employee per year.
Formula: Total training hours ÷ total employees (FTE).
Benchmark: The ATD industry benchmark is roughly 30–40 hours a year.
Common mistake: Logging attendance hours with no measure of completion or competency gained.
13. Employee engagement score
Definition: A composite survey score of how committed and motivated employees feel.
Formula: (Favourable responses ÷ total responses) × 100, or eNPS = %promoters − %detractors.
Benchmark: 70%+ favourable is strong; Gallup’s global engagement average sits near 23%.
Common mistake: Surveying once a year and never closing the loop on what the results said.
14. Board independence
Definition: The proportion of directors who are genuinely independent — non-executive with no material ties.
Formula: (Independent directors ÷ total directors) × 100.
Benchmark: Governance codes expect a majority; 50%+ independent with an independent chair is the norm investors look for.
Common mistake: Classifying long-tenured directors (10+ years) as independent when many codes no longer accept that.
15. Ethics and compliance training completion
Definition: The share of employees who have completed mandatory code-of-conduct and anti-corruption training.
Formula: (Employees completing training ÷ total required) × 100.
Benchmark: Best practice is 95–100% completion every year.
Common mistake: Tracking completion but ignoring whistleblower reports, their resolution time and substantiation rate.
The 15 ESG KPIs at a glance
| Metric | Formula | Benchmark | Where to see it |
|---|---|---|---|
| GHG emissions (S1+2+3) | Σ activity × emission factor | −4.2%/yr (1.5°C) | ESG Dashboard (Excel/Power BI) |
| Carbon intensity | tCO₂e ÷ revenue | −5 to −8%/yr | ESG KPI Dashboard |
| Renewable energy % | Renewable ÷ total energy | 30–40% avg; 100% target | Sustainability Operations KPI |
| Energy intensity | MWh ÷ output | −1 to −3%/yr | Sustainability Operations KPI |
| Water intensity | m³ ÷ revenue | Sector-specific | ESG Dashboard (Excel) |
| Waste diversion rate | Diverted ÷ total waste | 50% base; 90%+ leaders | Sustainability Operations KPI |
| Scope 3 coverage | Categories measured ÷ 15 | 6+ categories (A-list) | ESG KPI Dashboard (Power BI) |
| TRIR (safety) | (Incidents × 200,000) ÷ hours | <1.0 world-class | Sustainability Compliance KPI |
| Employee turnover | Separations ÷ avg headcount | ~13% healthy | ESG Dashboard (Social pillar) |
| Leadership diversity | Women in leadership ÷ total | 30% critical mass | ESG Dashboard (Social pillar) |
| Gender pay gap | (M − F median) ÷ M | ~12% OECD avg | ESG KPI Dashboard |
| Training hours/employee | Total hours ÷ FTE | 30–40 hrs/yr | ESG Dashboard (Social pillar) |
| Engagement score | Favourable ÷ responses | 70%+ strong | ESG KPI Dashboard |
| Board independence | Independent ÷ total directors | 50%+ majority | Sustainability Compliance KPI |
| Ethics training completion | Completed ÷ required | 95–100% | Sustainability Compliance KPI |
8 ready-made dashboards that already calculate these ESG KPIs
You do not have to build the formulas above from scratch. These eight NextGenTemplates dashboards ship with the metrics, benchmarks and traffic-light logic already wired in — drop in your numbers and the ESG KPIs calculate themselves. They are ranked from best all-round pick to most specialised.
1. ESG Dashboard in Excel — best overall
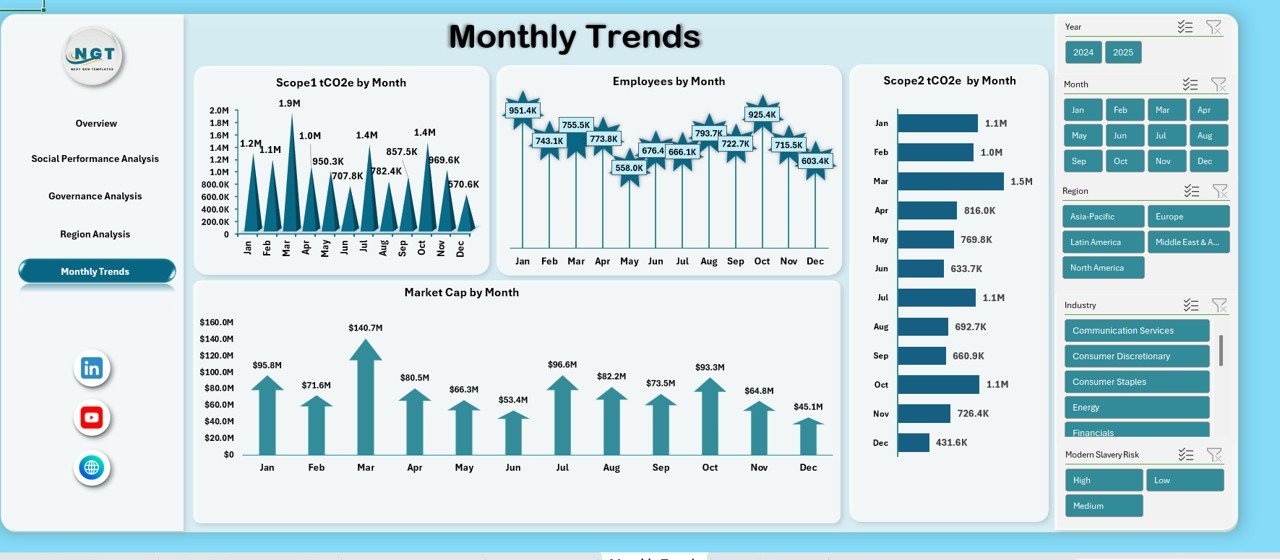
What it is: A single Excel file that tracks all three ESG pillars with monthly trends and target-vs-actual scoring.
Who it is for: Sustainability leads and finance teams who want one auditable file, not a consultant subscription.
- Environmental, Social and Governance sections in one workbook
- Monthly trend charts and a rolled-up ESG score
- Editable KPI targets with conditional-format traffic lights
- Print-ready layout for board packs
Use it to track GHG emissions, water intensity, turnover and leadership diversity side by side; a mid-market manufacturer can report all 15 ESG KPIs from this one file each month. Price: $17.99. Get the ESG Dashboard in Excel →
Best for: teams that want every pillar in one place without touching Power BI.
2. Energy & ESG Sustainability Bundle — best value
What it is: Eight premium Excel and Power BI templates covering energy, emissions and the full ESG stack, bundled at 50% off.
Who it is for: Organisations that need coverage across operations, compliance and reporting rather than a single view.
- 8 templates spanning Excel and Power BI
- Energy, emissions, operations and compliance dashboards together
- Saves 50% versus buying each template separately
- One purchase for the whole sustainability team
If you expect to track more than a handful of ESG KPIs across departments, the bundle pays for itself against two standalone dashboards. Price: $59.99 (save 50%). Get the Energy & ESG Sustainability Bundle →
Best for: buyers who want the widest coverage for the lowest per-template cost.
3. ESG KPI Dashboard in Power BI
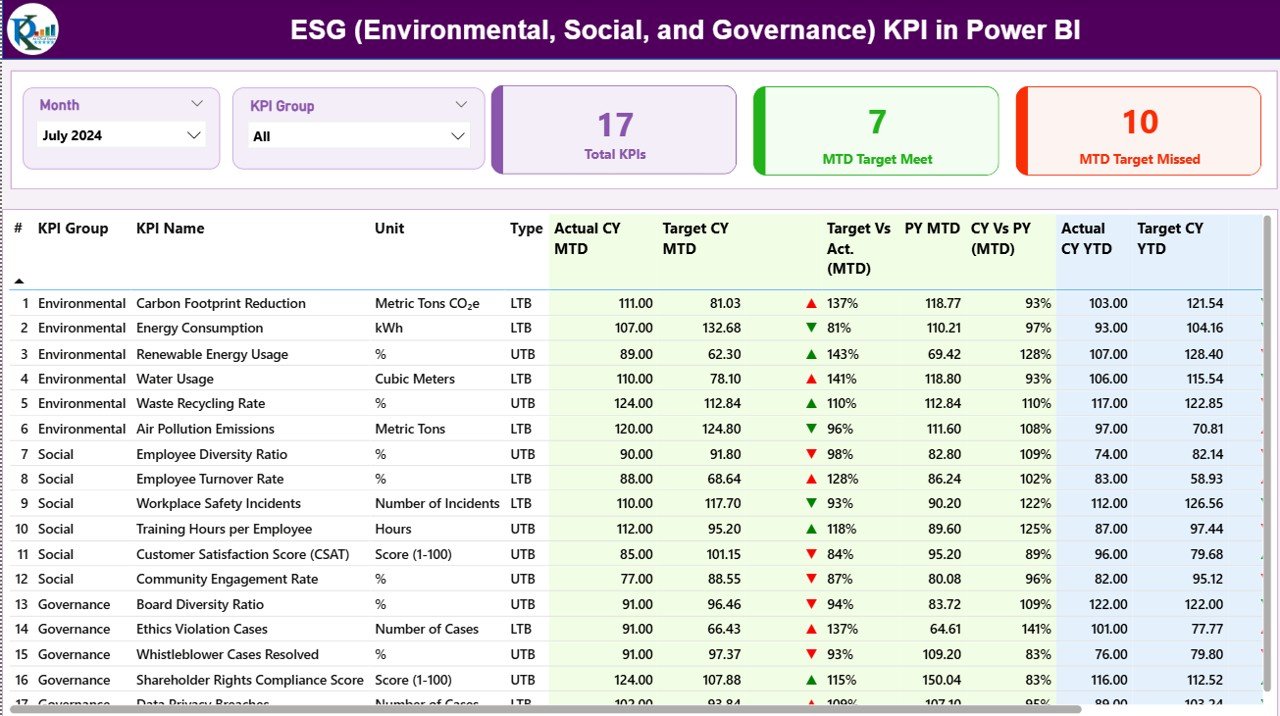
What it is: An interactive Power BI scorecard with MTD/YTD ESG KPIs, slicers and a KPI-trend page.
Who it is for: Teams already in the Microsoft stack that need board-ready, filterable reporting.
- Month picker with MTD and YTD comparisons
- Traffic-light KPI tiles across all three pillars
- Drill-down by pillar, region or business unit
Ideal for carbon intensity, Scope 3 coverage and engagement, where investors expect an interactive view they can filter. Price: $11.99. Get the ESG KPI Dashboard in Power BI →
Best for: interactive, filterable board reporting.
4. ESG Dashboard in Google Sheets
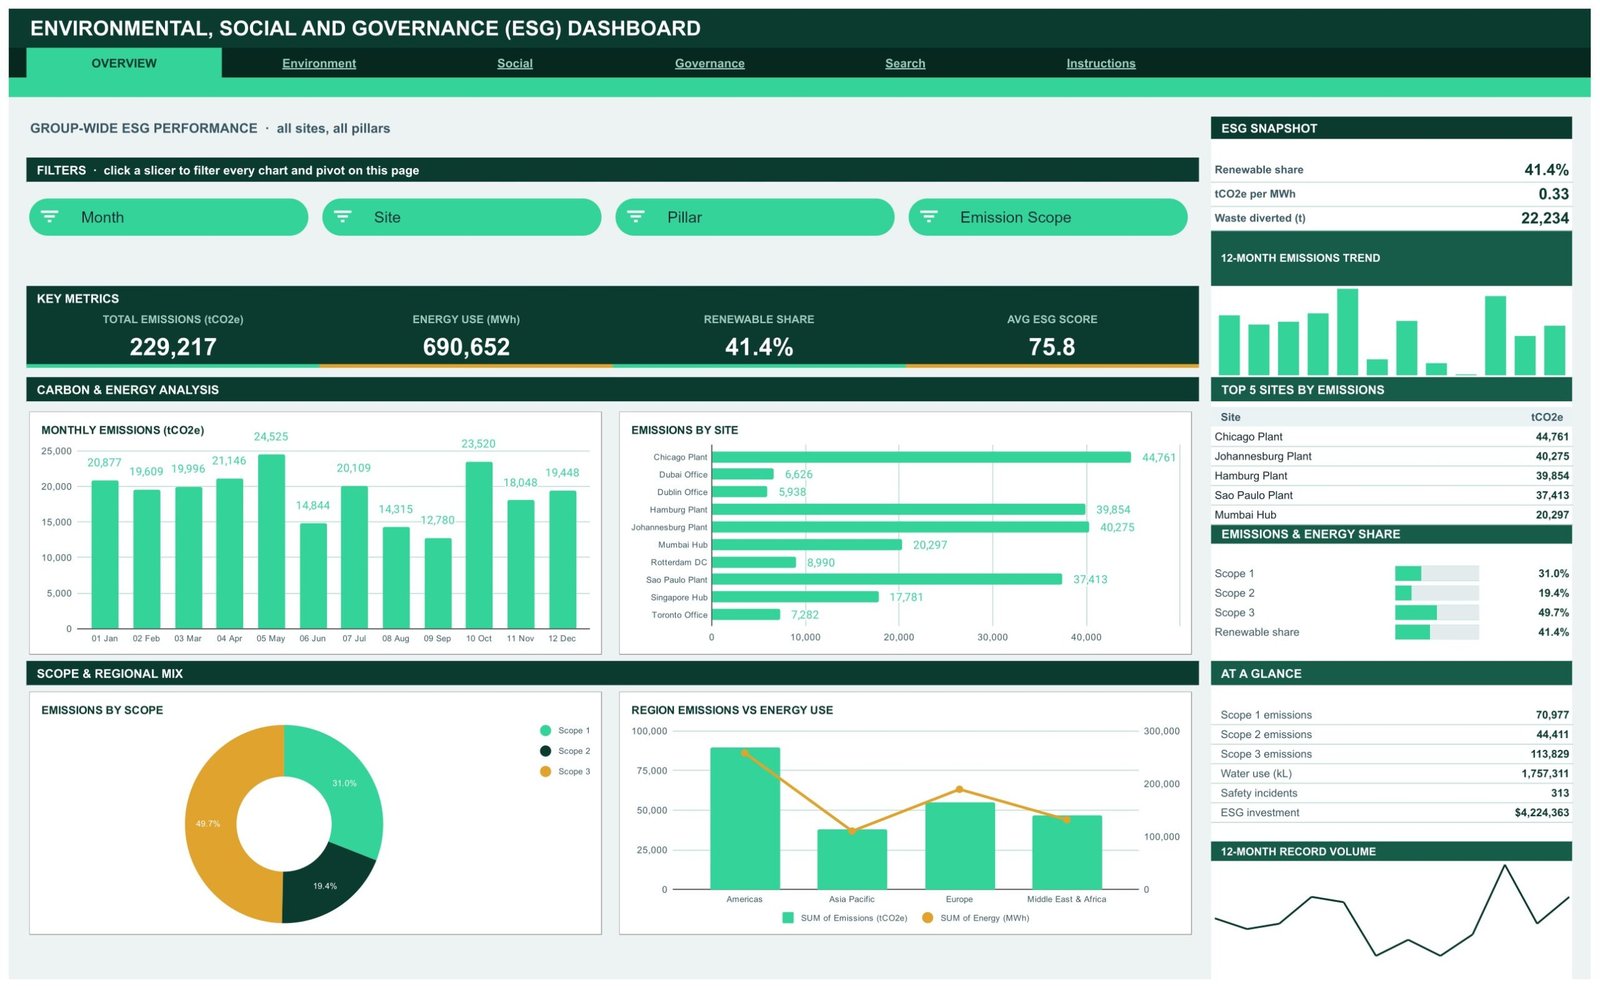
What it is: The full three-pillar ESG dashboard rebuilt natively in Google Sheets.
Who it is for: Cloud-first teams without an Excel licence who want to collaborate live.
- Shareable, real-time collaboration in Google Workspace
- All three ESG pillars with editable targets
- No add-ons or scripts required to run
Price: $9.99. Get the ESG Dashboard in Google Sheets →
Best for: distributed teams living in Google Workspace.
5. ESG KPI Dashboard in Google Sheets
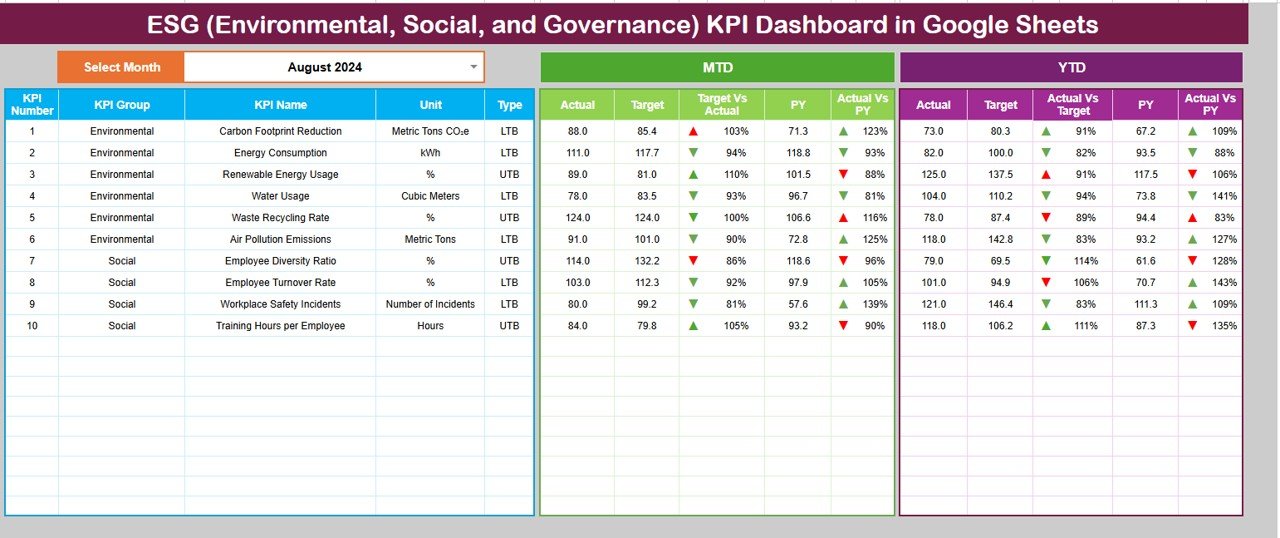
What it is: A lighter MTD/YTD KPI scorecard for ESG metrics in Google Sheets.
Who it is for: Smaller teams that want a fast monthly scorecard rather than a full dashboard.
- Month-picker scorecard with target vs actual
- Traffic-light status on every KPI
- Trend and analysis tabs built in
Price: $9.99. Get the ESG KPI Dashboard in Google Sheets →
Best for: a quick monthly ESG scorecard on a budget.
6. Sustainability Operations KPI Dashboard in Excel
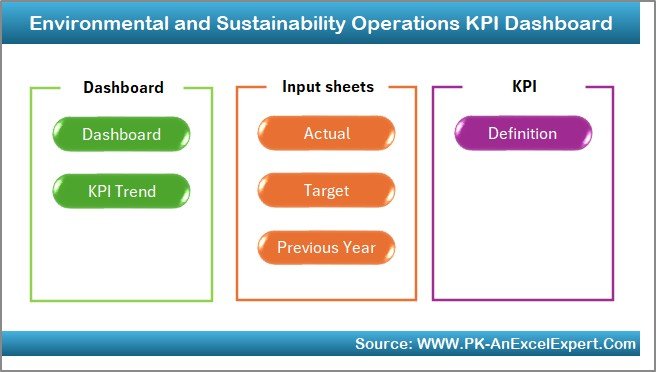
What it is: An operations-focused dashboard for energy, water, waste and emissions at the plant level.
Who it is for: Facility and operations managers who own the environmental numbers day to day.
- Energy intensity, water intensity and waste diversion in one view
- Site-by-site comparison
- Monthly targets with variance highlighting
Price: $12.99. Get the Sustainability Operations KPI Dashboard →
Best for: plant-level environmental operations.
7. Sustainability Compliance KPI Dashboard in Excel
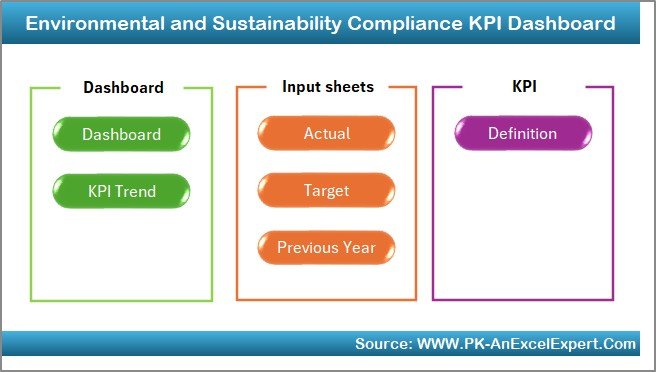
What it is: A compliance-oriented dashboard for permits, audits, safety (TRIR) and governance metrics.
Who it is for: EHS, audit and governance teams that report on obligations and incidents.
- Permit and audit status tracking
- TRIR and safety-incident logging
- Governance metrics like board independence and ethics-training completion
Price: $12.99. Get the Sustainability Compliance KPI Dashboard →
Best for: regulatory, audit and safety reporting.
8. Sustainability Product Development KPI Dashboard in Excel
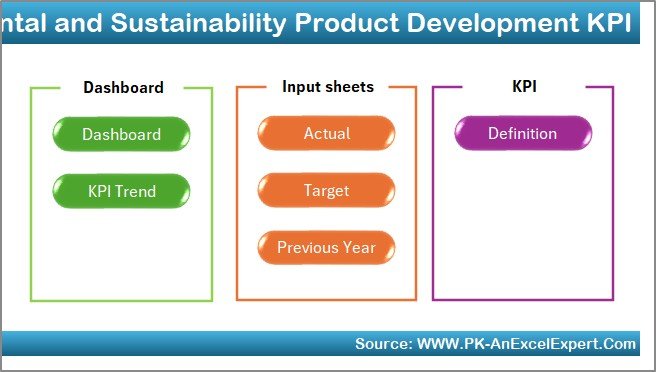
What it is: An eco-design dashboard tracking sustainability KPIs through the product-development pipeline.
Who it is for: R&D and product teams building greener products.
- Lifecycle and eco-design metrics by project
- Material and energy impact per product
- Stage-gate KPI tracking
Price: $14.99. Get the Sustainability Product Development KPI Dashboard →
Best for: eco-design and product R&D.
How to choose between them
| If you want… | Pick | Price |
|---|---|---|
| All three pillars in one file | ESG Dashboard in Excel | $17.99 |
| The widest coverage for the money | Energy & ESG Sustainability Bundle | $59.99 |
| Interactive board reporting | ESG KPI Dashboard in Power BI | $11.99 |
| Live cloud collaboration | ESG Dashboard in Google Sheets | $9.99 |
| Plant/operations metrics | Sustainability Operations KPI Dashboard | $12.99 |
| Audit and compliance | Sustainability Compliance KPI Dashboard | $12.99 |
A quick rule: if one person owns ESG and reports monthly, start with the Excel dashboard; if several departments feed the numbers, buy the bundle so operations, compliance and product development each get their own file. For deeper cross-department context, our finance KPIs and procurement KPIs guides pair naturally with ESG reporting.
When ESG KPI templates are NOT the right answer
A spreadsheet dashboard is the right tool for tracking and reporting ESG KPIs you already collect. It is the wrong tool in three situations. First, if you need audited, assurance-grade carbon accounting for regulated disclosure (CSRD, SEC climate rules), you will eventually need dedicated carbon-accounting software with a verifiable audit trail — use the template to prototype, then graduate. Second, if your emission data lives in dozens of live source systems and must refresh automatically, a manual template becomes a maintenance burden. Third, if you have no reliable underlying data yet, no dashboard will fix that; fix data collection first. For most small and mid-sized organisations building their first ESG scorecard, though, a template is faster, cheaper and perfectly auditable. If you are also standing up people metrics, our recruitment KPIs guide covers the social-pillar hiring numbers in more depth.
Get more ESG and sustainability templates
Start with the ESG Dashboard in Excel ($17.99) for a single-file scorecard, or take the Energy & ESG Sustainability Bundle ($59.99) if you want all eight templates at half price. Every dashboard is a one-time purchase with lifetime access — no subscription. See them in action on our YouTube channel, NextGenTemplates, and browse related metric guides for sales KPIs, marketing KPIs, warehouse KPIs and inventory KPIs.
Frequently asked questions
What are ESG KPIs?
ESG KPIs are quantifiable metrics that measure a company’s environmental, social and governance performance — things like greenhouse-gas emissions, employee turnover and board independence. They turn broad sustainability commitments into numbers that investors, regulators and customers can compare year over year and against peers.
What are the three pillars of ESG?
The three pillars are Environmental (emissions, energy, water, waste), Social (safety, diversity, pay equity, training, engagement) and Governance (board independence, ethics, compliance). A balanced ESG scorecard tracks four to six live KPIs in each pillar rather than loading up on one and ignoring the others.
Which ESG KPI matters most?
For most companies the single most material ESG KPI is total greenhouse-gas emissions across Scope 1, 2 and 3, because it is the metric investors, rating agencies and regulators weight most heavily. Scope 3 usually represents 70–90% of the footprint, so omitting it understates your real climate impact.
What is the difference between Scope 1, 2 and 3 emissions?
Scope 1 is direct emissions from owned sources such as boilers and vehicles. Scope 2 is indirect emissions from purchased electricity, steam or heat. Scope 3 is all other value-chain emissions — suppliers, business travel, product use and disposal — and is normally the largest and hardest category to measure.
How do you calculate carbon intensity?
Carbon intensity is total emissions in tonnes of CO₂ equivalent divided by a business metric, usually revenue in millions or units produced. It lets you compare performance fairly as the company grows, but watch for absolute emissions rising even while intensity falls because output grew faster.
What is a good ESG score benchmark?
There is no universal ESG score; benchmarks are metric-specific and sector-specific. Compare each KPI within your own industry — for example TRIR below 1.0, renewable energy above the 30–40% average, or turnover near 13%. The direction of travel year over year usually matters more to raters than a single absolute number.
Do I need special software to track ESG KPIs?
No. For tracking and reporting KPIs you already collect, an Excel, Google Sheets or Power BI dashboard is enough and fully auditable. Dedicated carbon-accounting software only becomes necessary for assurance-grade regulated disclosure or when data must refresh automatically from many live source systems.
How often should ESG KPIs be reported?
Track ESG KPIs monthly internally so trends surface early, and report externally at least annually in a sustainability or integrated report. Safety and operational metrics such as TRIR, energy and waste are usually reviewed monthly, while governance and diversity metrics are commonly reported quarterly or annually.
Which ESG dashboard template should a small business start with?
Start with the ESG Dashboard in Excel at $17.99 — it covers all three pillars in one file, needs no subscription and is easy to audit. If several departments will feed the numbers, the $59.99 Energy & ESG Sustainability Bundle gives operations, compliance and product-development teams their own dashboards at half the standalone price.
Can these templates be customised for my industry?
Yes. Every NextGenTemplates ESG dashboard uses editable KPI names, targets and formulas, so you can swap in sector-specific metrics — water stress for a beverage company, Scope 3 categories for a retailer, or safety rates for manufacturing — without rebuilding the structure.