

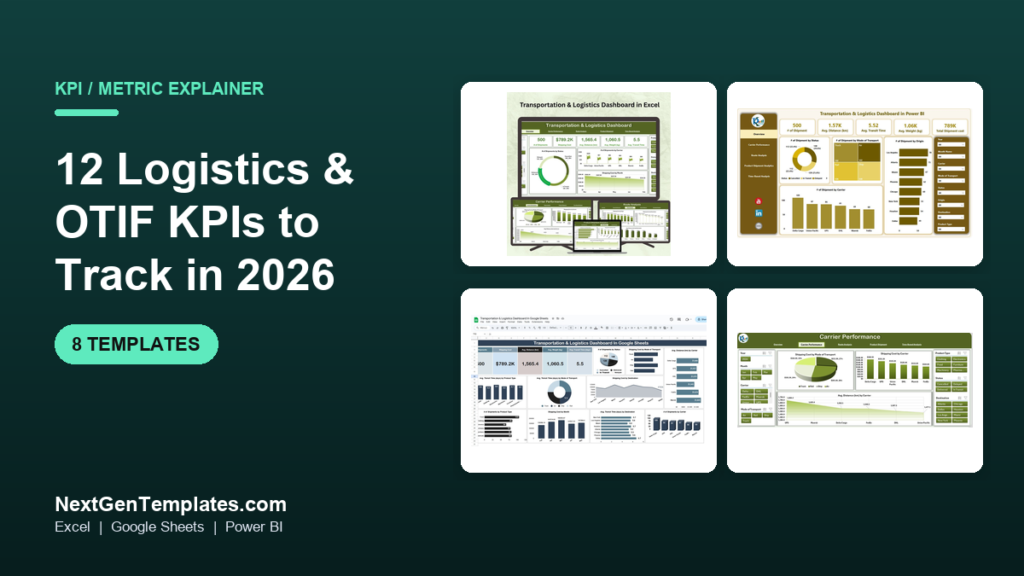
The 12 logistics KPIs that matter most in 2026 are OTIF, on-time delivery, perfect order rate, order fill rate, order cycle time, freight cost per unit, transportation cost as a percentage of sales, vehicle utilization, dwell time, damage rate, freight bill accuracy, and return rate. Each has a simple formula and a published benchmark range.
Last updated: September 2026
Key takeaways
- OTIF (On-Time In-Full) is the master logistics KPI — world-class shippers hit 95%+, yet most teams sit between 80% and 90% because they measure “on time” and “in full” separately.
- Every metric below ships with a formula and a benchmark range, so you can score your own operation in an afternoon instead of guessing.
- The most common OTIF mistake is measuring against your dispatch date, not the customer’s requested delivery date — it inflates your score by 5 to 15 points.
- All 12 logistics KPIs are pre-built in NGT’s Logistics and Transportation Hub bundle (7 templates, $69.99) — cheaper than one month of most SaaS logistics tools.
- You do not need a TMS to start: a single $9.99 Google Sheets logistics dashboard tracks the core delivery KPIs out of the box.
 Launch offer
From your first Pivot Table to the Data Model, DAX, Power Query and a one-page KPI dashboard. 11h 51m of video by PK, with practice files, quizzes and a capstone.
The 12 logistics KPIs and OTIF metrics at a glance
This is the reference table. Use it to pick the three or four metrics that map to your biggest cost or service problem, then read the detailed breakdown below for the formula, the benchmark and the mistake that quietly ruins the number.
| Metric | Formula | Benchmark range | Where to see it |
|---|---|---|---|
| 1. On-Time In-Full (OTIF) | (Orders delivered on time and complete ÷ Total orders) × 100 | 90–95% good; 95%+ world-class | Transportation & Logistics Dashboard |
| 2. On-Time Delivery (OTD) | (On-time deliveries ÷ Total deliveries) × 100 | 95–98% | Food Delivery KPI Dashboard |
| 3. Perfect Order Rate | (Error-free orders ÷ Total orders) × 100 | 97–99% | Logistics and Transportation Hub |
| 4. Order Fill Rate | (Units shipped ÷ Units ordered) × 100 | 95–98% | Transportation & Logistics Dashboard |
| 5. Order Cycle Time | Σ(Delivery date − Order date) ÷ Number of orders | 2–5 days (domestic) | Food Delivery KPI Dashboard |
| 6. Freight Cost per Unit | Total freight spend ÷ Total units shipped | Track trend; target 5–10% YoY cut | Transportation & Logistics Dashboard |
| 7. Transportation Cost % of Sales | (Total freight cost ÷ Total sales revenue) × 100 | 3–6% typical; <5% good | Logistics and Transportation Hub |
| 8. Vehicle / Truck Utilization | (Actual load ÷ Maximum capacity) × 100 | 85–95% | Transportation Dashboard (Power BI) |
| 9. Dwell Time | Departure time − Arrival time (avg per stop) | <2 hours at dock | Transportation & Logistics Dashboard |
| 10. Damage Rate | (Damaged shipments ÷ Total shipments) × 100 | <1–2% | Logistics and Transportation Hub |
| 11. Freight Bill Accuracy | (Accurate invoices ÷ Total invoices) × 100 | 98–99% | IT & Service Delivery KPI Dashboard |
| 12. Return Rate (reverse logistics) | (Returned orders ÷ Total orders shipped) × 100 | 5–10% retail; 20–30% apparel | Logistics and Transportation Hub |
The 12 logistics & OTIF KPIs explained (formula + benchmark)
For each metric: a one-sentence definition, the exact formula, a realistic benchmark range, and the mistake teams make when they calculate it.
1. On-Time In-Full (OTIF)
OTIF is the percentage of orders delivered both on the requested date and with the full quantity, undamaged and correctly documented. It is the single number executives use to judge a supply chain. Read the neutral definition on Wikipedia’s On Time In Full entry.
Formula: (Orders delivered on time AND in full ÷ Total orders) × 100. Benchmark: 90–95% is a healthy target; 95%+ is world-class; large retailers such as Walmart fine suppliers below their contracted OTIF threshold. Common mistake: measuring on-time and in-full as two separate metrics, then averaging them — OTIF is a strict AND condition, so an order that is on time but short one case fails the whole line.
2. On-Time Delivery (OTD)
OTD is the share of deliveries that arrive by the promised date or within the agreed window, ignoring completeness.
Formula: (On-time deliveries ÷ Total deliveries) × 100. Benchmark: 95–98% for mature carriers; below 90% signals a routing or capacity problem. Common mistake: scoring against your own dispatch date instead of the customer’s requested delivery date, which flatters the number by 5 to 15 points and hides the real service gap.
3. Perfect Order Rate
The perfect order rate is the percentage of orders that move through the entire cycle with zero errors: right item, right quantity, on time, undamaged, and with accurate paperwork.
Formula: (Error-free orders ÷ Total orders) × 100. Many teams multiply the four component rates (on-time × complete × damage-free × correct-docs). Benchmark: 97–99% for best-in-class operations. Common mistake: excluding invoice and documentation errors — a shipment can arrive perfectly and still fail on a wrong PO number.
4. Order Fill Rate
Fill rate measures how much of customer demand you satisfy from available stock without a backorder, at the unit, line, or order level.
Formula: (Units shipped ÷ Units ordered) × 100. Benchmark: 95–98% unit fill rate. Common mistake: reporting order fill rate (all-or-nothing per order) and calling it line fill rate — they can differ by 10+ points, and mixing them makes trend charts meaningless.
5. Order Cycle Time (Average Delivery Time)
Order cycle time is the average elapsed time from when a customer places an order to when it is delivered.
Formula: Σ(Delivery date − Order date) ÷ Number of orders. Benchmark: 2–5 days for domestic e-commerce; same-day and next-day are now competitive baselines in urban last-mile. Common mistake: measuring only transit time and ignoring the order-processing lag, which is often where the real delay lives.
6. Freight Cost per Unit
This is the average transportation cost to move a single unit, case, or order.
Formula: Total freight spend ÷ Total units shipped. Benchmark: highly product-specific — track the trend rather than an absolute, and target a 5–10% year-over-year reduction through consolidation and mode optimization. Common mistake: excluding fuel surcharges and accessorial charges, which can be 20–30% of the true landed freight cost.
7. Transportation Cost as a Percentage of Sales
This ratio shows how much of your revenue is consumed by moving goods.
Formula: (Total freight cost ÷ Total sales revenue) × 100. Benchmark: 3–6% is typical across manufacturing and retail; under 5% is a strong result for most industries. Common mistake: not separating inbound from outbound freight, which hides whether the cost problem is on the supply side or the delivery side.
8. Vehicle / Truck Utilization Rate
Utilization is the share of a vehicle’s weight or volume capacity that is actually used on each trip. To track utilization alongside fuel cost and downtime per vehicle, compare these fleet management dashboard templates.
Formula: (Actual load weight or volume ÷ Maximum capacity) × 100. Benchmark: 85–95% is a strong target; below 70% means you are paying to ship air. Common mistake: tracking weight utilization when the freight “cubes out” first — for light, bulky goods, volume is the binding constraint.
9. Dwell Time
Dwell time is how long a truck, container, or trailer waits at a facility before it is loaded, unloaded, or released.
Formula: Departure time − Arrival time, averaged per stop or site. Benchmark: under 2 hours at a dock; most carriers begin charging detention after roughly 2 hours. Common mistake: reporting a single site-wide average instead of breaking dwell down by facility, which is the only way to find the one dock that is bleeding you.
10. Damage Rate (Damage-Free Delivery)
Damage rate is the percentage of shipments that arrive damaged; its inverse, damage-free delivery, is the number you want to grow.
Formula: (Damaged shipments ÷ Total shipments) × 100. Benchmark: under 1–2% damage rate for well-run operations. Common mistake: logging only customer-reported damage and ignoring warehouse-detected damage, which understates the problem and hides packaging or handling root causes.
11. Freight Bill Accuracy
This is the percentage of carrier invoices that are billed correctly against the contracted rate and the services actually delivered.
Formula: (Accurate invoices ÷ Total invoices) × 100. Benchmark: 98–99%; freight audits routinely recover 1–4% of total freight spend. Common mistake: paying invoices on time without auditing them against the rate agreement, so duplicate and mis-rated charges slip through every month.
12. Return Rate (Reverse Logistics)
Return rate is the percentage of shipped orders that customers send back.
Formula: (Returned orders ÷ Total orders shipped) × 100. Benchmark: 5–10% in general retail; 20–30% in apparel e-commerce. Common mistake: tracking the headline rate without categorizing return reasons, so you never learn whether it is sizing, damage, or wrong-item picks driving the cost.
Skip the spreadsheet build. The Logistics and Transportation Hub calculates all 12 of these logistics KPIs automatically in Excel and Power BI — 7 templates for $69.99. Drop in your shipment data and every formula and benchmark above is already wired up.
Logistics dashboard templates compared
These are the eight ready-made dashboards that already calculate the logistics KPIs above. Prices are one-time; there is no subscription.
| Template | Format | Best for | Price |
|---|---|---|---|
| Logistics and Transportation Hub (7 templates) — Best overall | Excel + Power BI | Teams that want every KPI in one bundle | $69.99 |
| Transportation & Logistics Dashboard | Excel | Analysts who live in Excel | $17.99 |
| Transportation & Logistics Dashboard | Power BI | Real-time, large shipment volumes | $17.99 |
| Transportation & Logistics Dashboard — Best value | Google Sheets | Collaborative, cloud-first teams | $9.99 |
| Transportation and Logistics Dashboard | HTML | Embedding a live view on a web portal | $12.99 |
| Food Delivery KPI Dashboard | Excel | Last-mile and on-time delivery focus | $14.99 |
| IT & Tech Service Delivery KPI Dashboard | Excel | SLA and service-level tracking | $14.99 |
| HR Service Delivery KPI Dashboard | Excel | Internal service delivery metrics | $14.99 |
How we picked these
We searched NextGenTemplates’ catalog of 1,200+ paid templates for every dashboard that already computes at least four of the twelve logistics KPIs above from raw shipment data. We prioritized templates that expose the underlying formulas (so you can audit and adapt them), cover more than one file format, and carry a one-time price rather than a subscription. We excluded generic business dashboards that only surface revenue and profit, and any template that charts KPIs without letting you edit the calculation logic. What remained are the eight below, ranked by breadth of KPI coverage and buyer value.
The 8 best logistics dashboard templates for 2026
1. Logistics and Transportation Hub — best overall
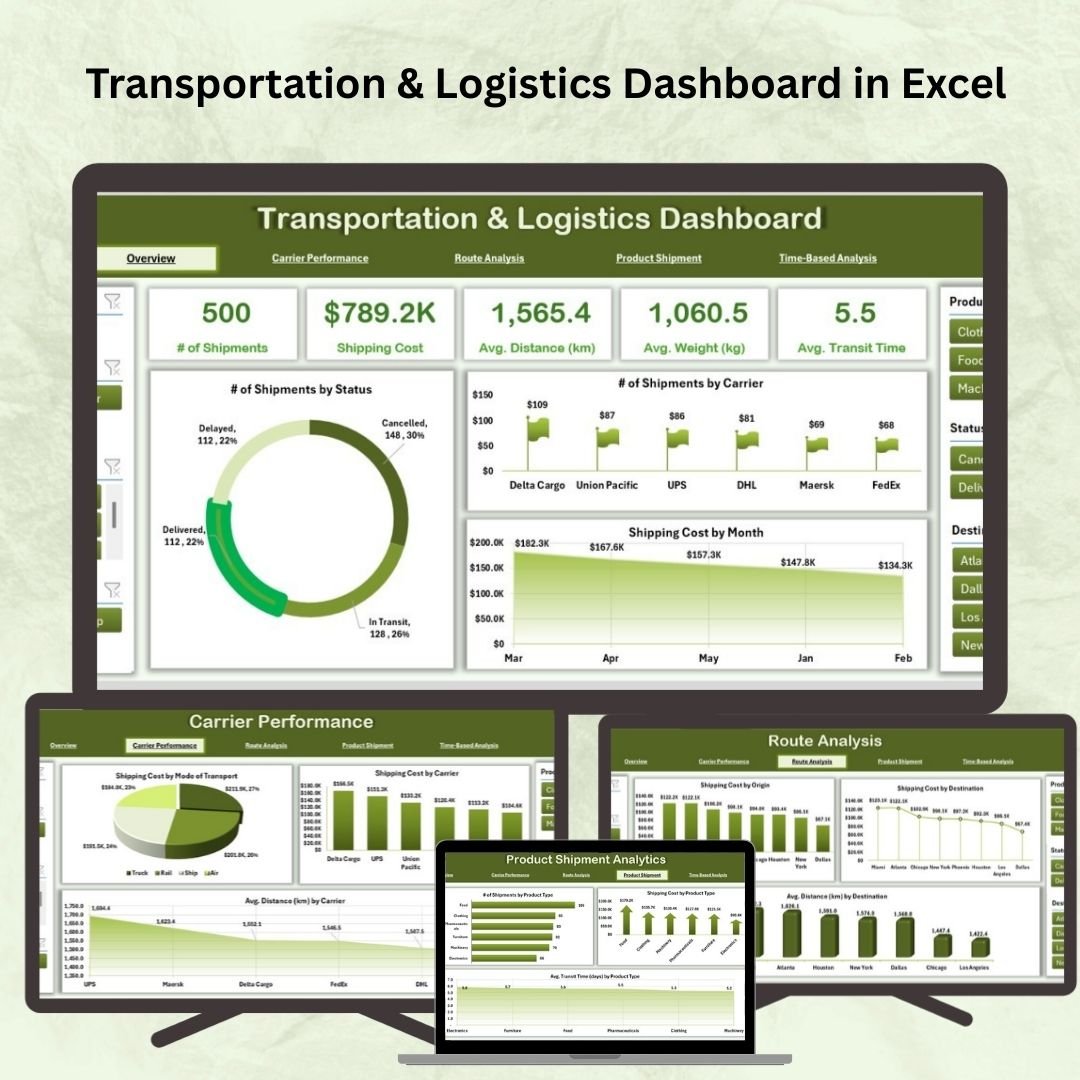
What it is: a seven-template bundle spanning Excel and Power BI that covers the full logistics KPI set — OTIF, freight cost, utilization, dwell time, damage and returns — in one purchase.
Who it is for: logistics and supply-chain managers who want every metric in this article without stitching separate files together.
What is inside:
- Pre-built OTIF, perfect-order and fill-rate calculations
- Freight cost per unit and transportation-cost-as-%-of-sales tiles
- Carrier performance and vehicle utilization views
- Both Excel and Power BI versions of the core dashboard
A 3PL tracking 5,000 shipments a month can replace three ad-hoc spreadsheets with one bundle; a regional distributor can benchmark carriers side by side; a manufacturer can watch inbound and outbound freight cost in the same view. At $69.99 it works out to roughly $10 per template. Get the Logistics and Transportation Hub bundle.
Best for: anyone who wants the complete logistics KPI stack in a single, editable package.
2. Transportation & Logistics Dashboard in Excel
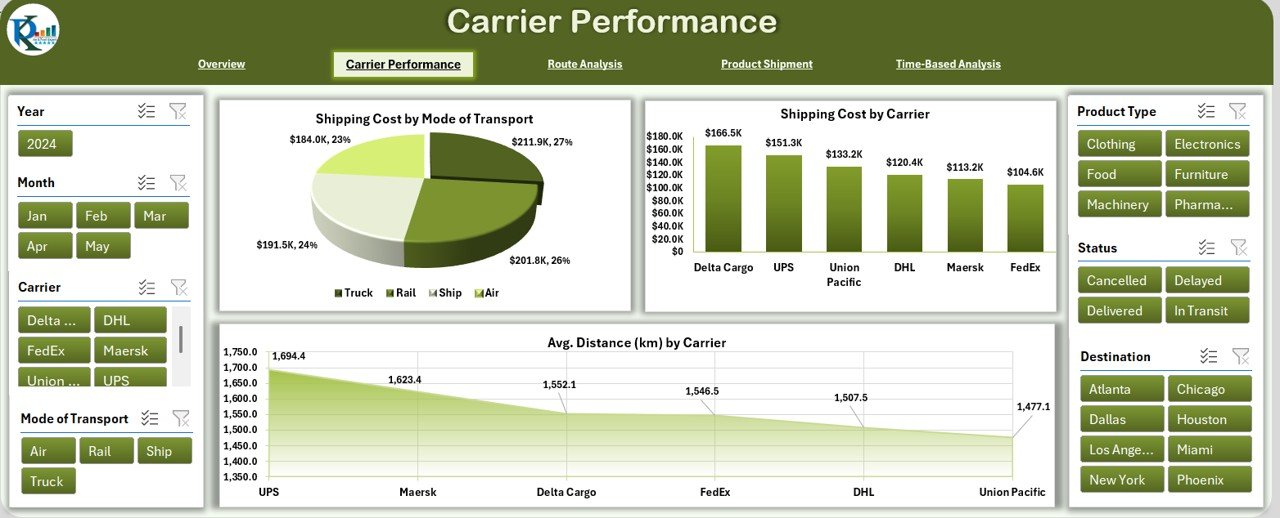
What it is: a single-file Excel dashboard that tracks shipments by status, carrier, mode and route with OTIF, transit time and freight cost built in.
Who it is for: analysts who want a proven Excel model they can extend with their own formulas.
What is inside: shipment-by-status and by-carrier views, average distance and transit-time tiles, cost-by-mode charts, and a clean data-entry sheet.
Use it to spot the carrier dragging your OTIF down, to compare freight cost across modes, or to see which lane has the worst dwell time. At $17.99 it is the cheapest way into a full Excel logistics KPI model. See the Excel logistics dashboard.
Best for: Excel-first teams that want to own and edit every formula.
3. Transportation & Logistics Dashboard in Power BI
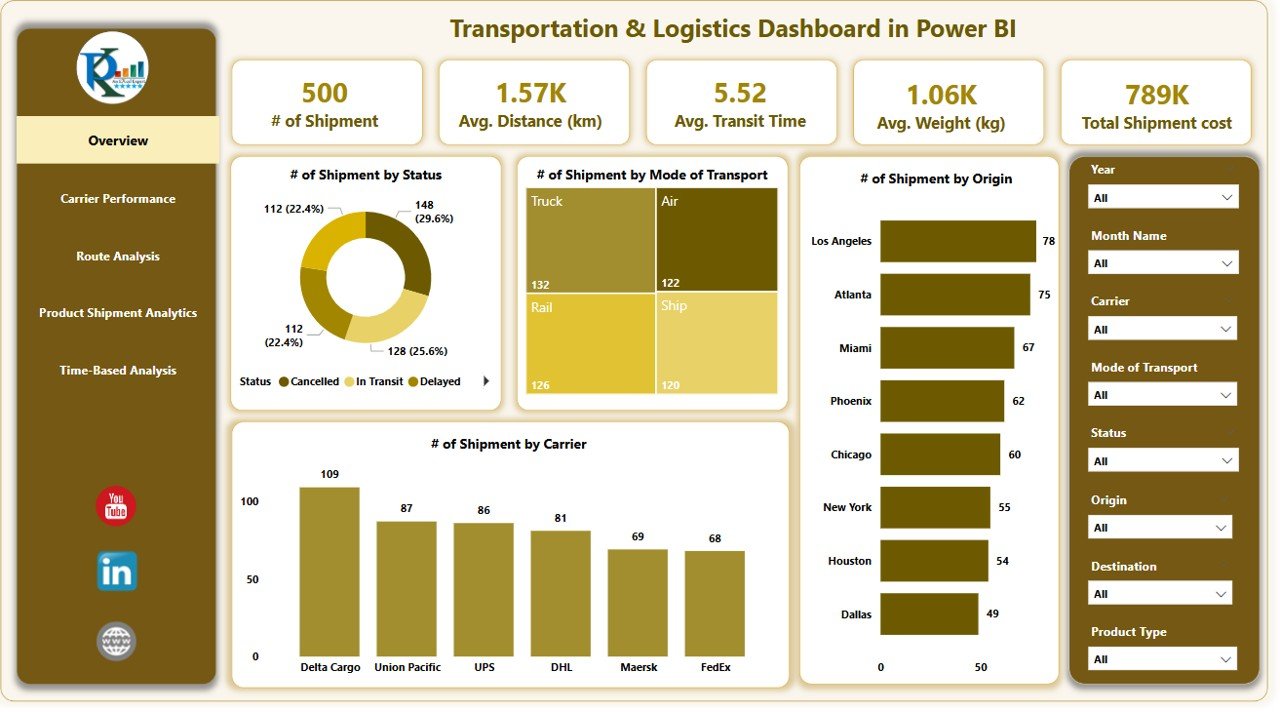
What it is: the Power BI version of the same model, built for larger shipment volumes and live refresh.
Who it is for: teams already on Power BI who need slicers, drill-through and a dataset that refreshes on a schedule.
What is inside: interactive shipment-by-status, by-carrier and by-origin visuals, weight and shipment-cost cards, and DAX measures you can reuse.
Connect it to a warehouse or TMS export and it refreshes nightly; use the slicers to isolate one region’s on-time delivery in seconds. At $17.99 it is a fraction of a single BI-developer day. Explore the Power BI logistics dashboard.
Best for: real-time reporting on high shipment volumes.
4. Transportation & Logistics Dashboard in Google Sheets — best value
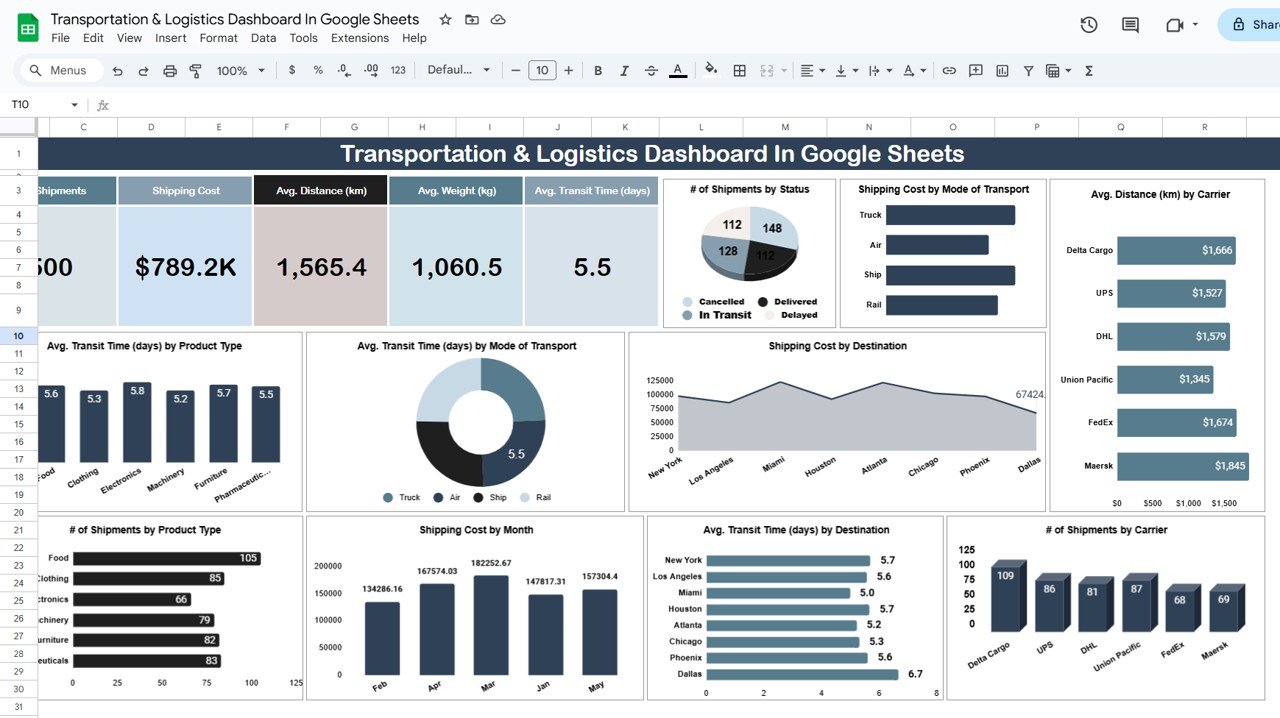
What it is: a fully cloud-based logistics dashboard in Google Sheets, editable by a whole team at once.
Who it is for: startups and distributed teams that live in Google Workspace and want zero install.
What is inside: the same shipment, carrier and cost views, driven by Google Sheets formulas with shareable, permissioned access.
Field staff can update shipment status from a phone; managers see OTIF move in real time. At $9.99 it is the lowest-cost entry point to logistics KPI tracking anywhere on this list. Grab the Google Sheets logistics dashboard.
Best for: collaborative, cloud-first teams on a tight budget.
5. Transportation and Logistics Dashboard in HTML
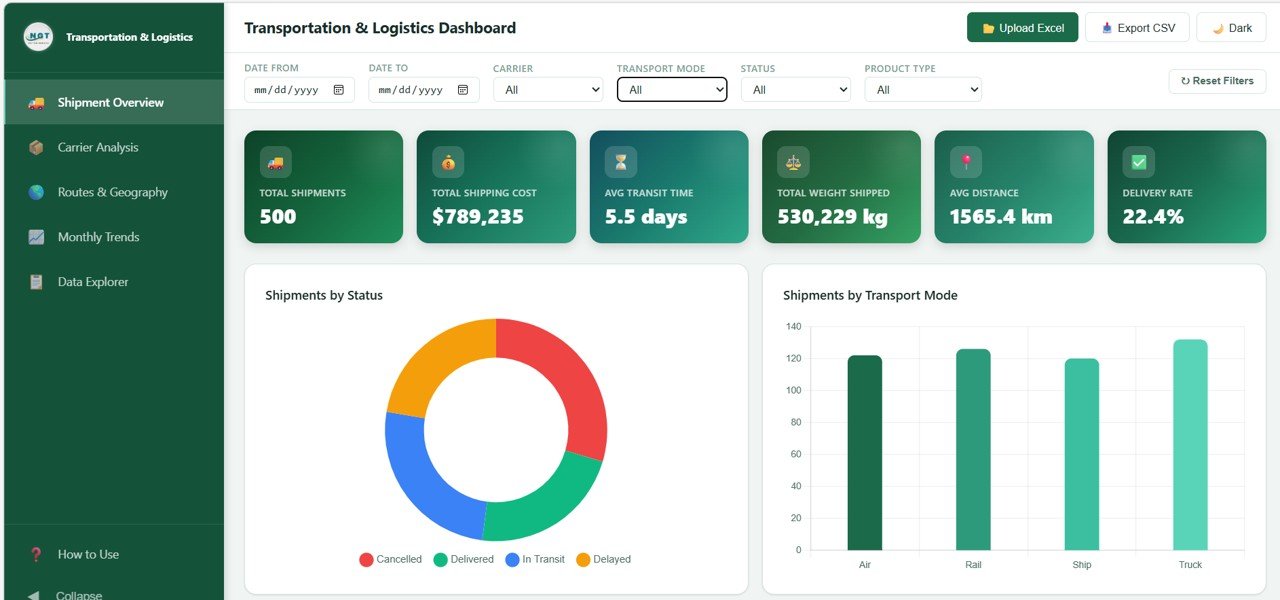
What it is: a self-contained HTML dashboard you can host on an internal portal or client-facing page.
Who it is for: teams that need to embed a live logistics view in a website or web app rather than a spreadsheet.
What is inside: responsive charts and KPI cards for shipments, carriers and cost, ready to drop into any web page.
A 3PL can give each client a branded, read-only KPI page; an ops team can pin it to a wall-mounted screen. At $12.99 it is a cheap alternative to a custom web build. View the HTML logistics dashboard.
Best for: embedding a live KPI view on a web portal.
6. Food Delivery KPI Dashboard in Excel

What it is: a last-mile-focused KPI dashboard built around on-time delivery, order cycle time and order accuracy.
Who it is for: food delivery, courier and last-mile operations where minutes decide the customer experience.
What is inside: delivery-time distribution, on-time rate, order-accuracy and driver-performance views.
Use it to find the zone where delivery time spikes at dinner rush, or the driver whose accuracy drags down your perfect-order rate. At $14.99 it is purpose-built for delivery-speed KPIs. See the Food Delivery KPI dashboard.
Best for: last-mile and on-time delivery tracking.
7. IT & Tech Service Delivery KPI Dashboard in Excel
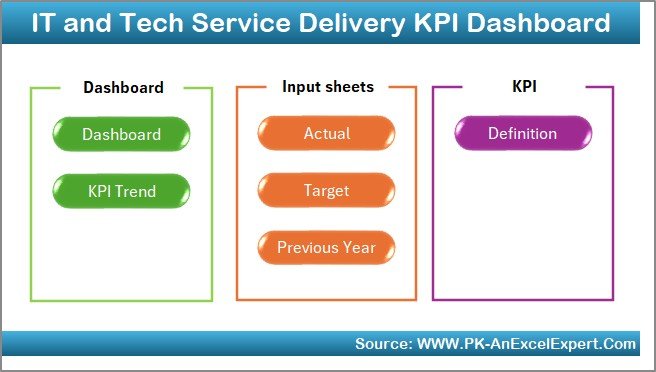
What it is: a service-level dashboard that tracks SLA attainment, on-time resolution and accuracy — the service-delivery cousins of OTIF.
Who it is for: teams whose “deliveries” are tickets and services with contractual SLAs, including freight-audit and control-tower functions.
What is inside: SLA-met rate, on-time resolution, backlog and accuracy tiles.
Logistics control towers reuse the same on-time and accuracy logic for freight-bill audit and exception handling. At $14.99 it brings SLA discipline to any delivery function. Explore the Service Delivery KPI dashboard.
Best for: SLA and service-level tracking.
8. HR Service Delivery KPI Dashboard in Excel

What it is: a service-delivery KPI dashboard modeled on the same on-time and quality logic, applied to internal HR services.
Who it is for: operations leaders who want to hold internal shared-service teams to the same on-time standard as external logistics.
What is inside: request-resolution time, on-time completion, and satisfaction tiles built on editable formulas.
The template is useful as a pattern: the on-time-completion formula is identical to OTD, so it doubles as a teaching model for KPI construction. At $14.99 it rounds out the service-delivery set. See the HR Service Delivery KPI dashboard.
Best for: internal service-delivery metrics and KPI modeling.
How to choose between them
- Want everything in one buy? Get the Logistics and Transportation Hub bundle.
- Live in Excel? The Excel dashboard at $17.99.
- Big volumes or need live refresh? The Power BI version.
- Team collaboration on a budget? The Google Sheets dashboard at $9.99.
- Last-mile speed? The Food Delivery KPI dashboard.
For a wider view of the format trade-offs, see our guide to logistics and transportation dashboard templates.
When a KPI dashboard is NOT the right answer
A spreadsheet dashboard is the right tool for tracking and reviewing logistics KPIs, but it is the wrong tool in three situations. First, if you need to execute — book carriers, tender loads, print labels, or optimize routes in real time — you need a transportation management system (TMS), not a dashboard. Second, if your shipment data lives in five disconnected systems and nobody owns data entry, no template can fix a broken data pipeline; solve the source-of-truth problem first. Third, at very high volume with sub-hour SLAs, a manually refreshed spreadsheet will lag reality — you want a live BI connection or a purpose-built control tower. Buy a dashboard to measure and improve your logistics KPIs; buy software to run the operation. Being honest about this is why teams trust the numbers the dashboards produce. If your bottleneck is upstream, start with our supply chain KPIs guide or the procurement KPIs guide instead.
Frequently asked questions
What is the most important logistics KPI?
On-Time In-Full (OTIF) is the most important logistics KPI because it captures both delivery reliability and order completeness in one number. It is the metric large retailers use to score and fine suppliers, and it correlates directly with customer retention. Track OTIF first, then diagnose it using the other eleven metrics.
What is a good OTIF percentage?
A good OTIF score is 90–95%, and 95% or higher is considered world-class. Most teams sit between 80% and 90% because they measure on-time and in-full separately or use their own dispatch date. Major retailers set contractual OTIF thresholds and charge penalties for shipments that fall below them.
How do you calculate OTIF?
OTIF equals the number of orders delivered both on time and in full, divided by total orders, times 100. An order counts only if it meets every condition at once: the customer’s requested date, the full quantity, undamaged, with correct documentation. Because it is a strict AND, one short case fails the entire order.
What is the difference between OTD and OTIF?
On-Time Delivery (OTD) measures only whether a delivery arrived by the promised date. OTIF adds the “in full” condition — right quantity, undamaged, correct paperwork. OTD is always equal to or higher than OTIF for the same period, so reporting OTD as if it were OTIF overstates your true service level.
How many logistics KPIs should I track?
Track four to seven logistics KPIs, not all twelve at once. Start with OTIF, on-time delivery, freight cost per unit, and vehicle utilization, then add metrics that target your specific weak spot. Tracking too many KPIs dilutes focus; the dashboards in this guide let you show or hide metrics as priorities shift.
What is a good transportation cost as a percentage of sales?
Transportation cost is typically 3–6% of sales across manufacturing and retail, and under 5% is a strong result for most industries. The figure varies with product weight, value density, and distance, so track your own trend over time rather than chasing a single universal benchmark.
Can I track logistics KPIs in Excel or Google Sheets?
Yes. Excel and Google Sheets handle every logistics KPI in this guide, and the pre-built dashboards here calculate OTIF, fill rate, freight cost, and utilization automatically from your shipment data. Spreadsheets are ideal for tracking and review; you only need a TMS when you must execute bookings and routing in real time.
What is dwell time and why does it matter?
Dwell time is how long a truck or trailer waits at a facility before it is loaded, unloaded, or released. It matters because carriers charge detention fees after roughly two hours, and long dwell ties up assets you have already paid for. Break it down by site to find the specific dock causing delays.
How much do logistics dashboard templates cost?
NextGenTemplates’ logistics dashboards range from $9.99 for the Google Sheets version to $69.99 for the seven-template Logistics and Transportation Hub bundle. All are one-time purchases with no subscription, which is typically less than a single month of comparable SaaS logistics analytics tools.
Get more logistics templates
Ready to score your operation against every benchmark in this guide? The Logistics and Transportation Hub bundle gives you all 12 logistics KPIs in Excel and Power BI for a one-time $69.99. Prefer to start small? The Google Sheets logistics dashboard is just $9.99.
For related metrics, see our 12 inventory KPIs, 12 manufacturing KPIs, and OEE and downtime metrics guides. If you operate as or work with a 3PL, see our 3PL & distribution center dashboard templates buyer guide. Watch build walkthroughs on our YouTube channel: youtube.com/@NextGenTemplates.