

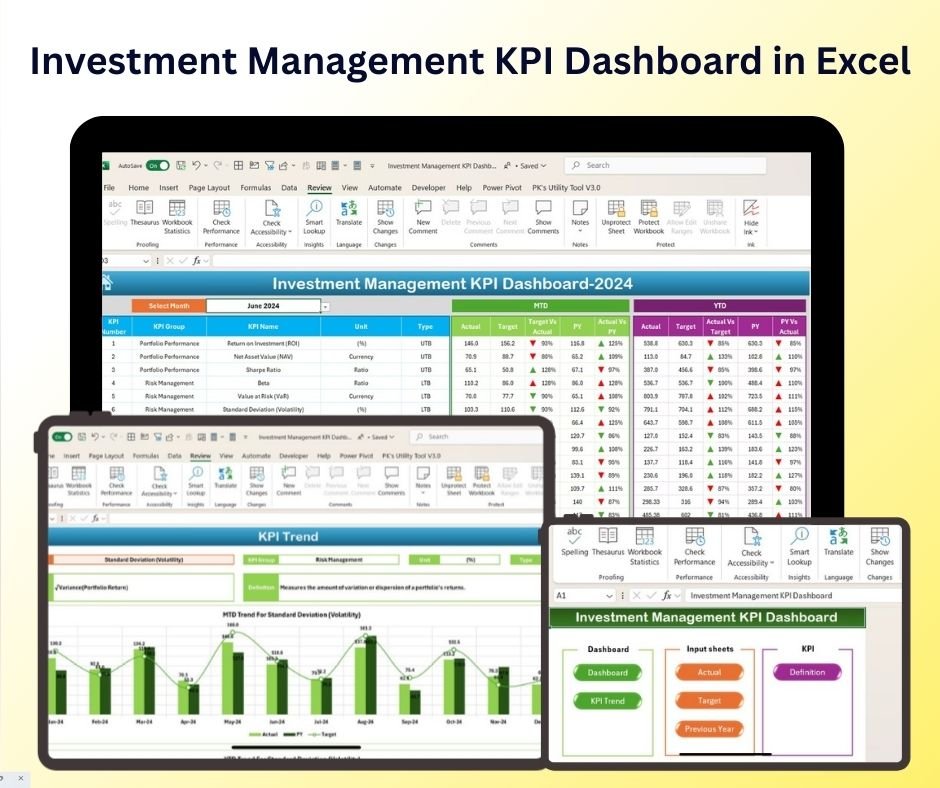
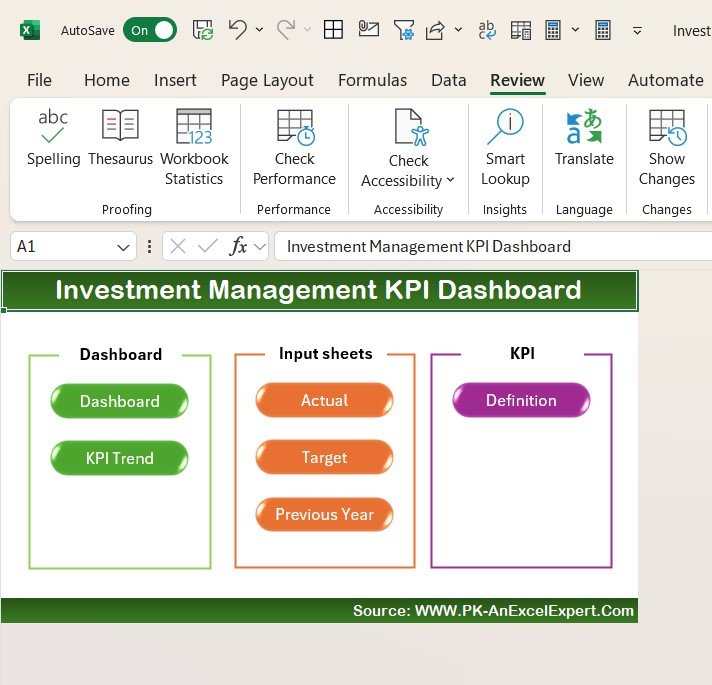
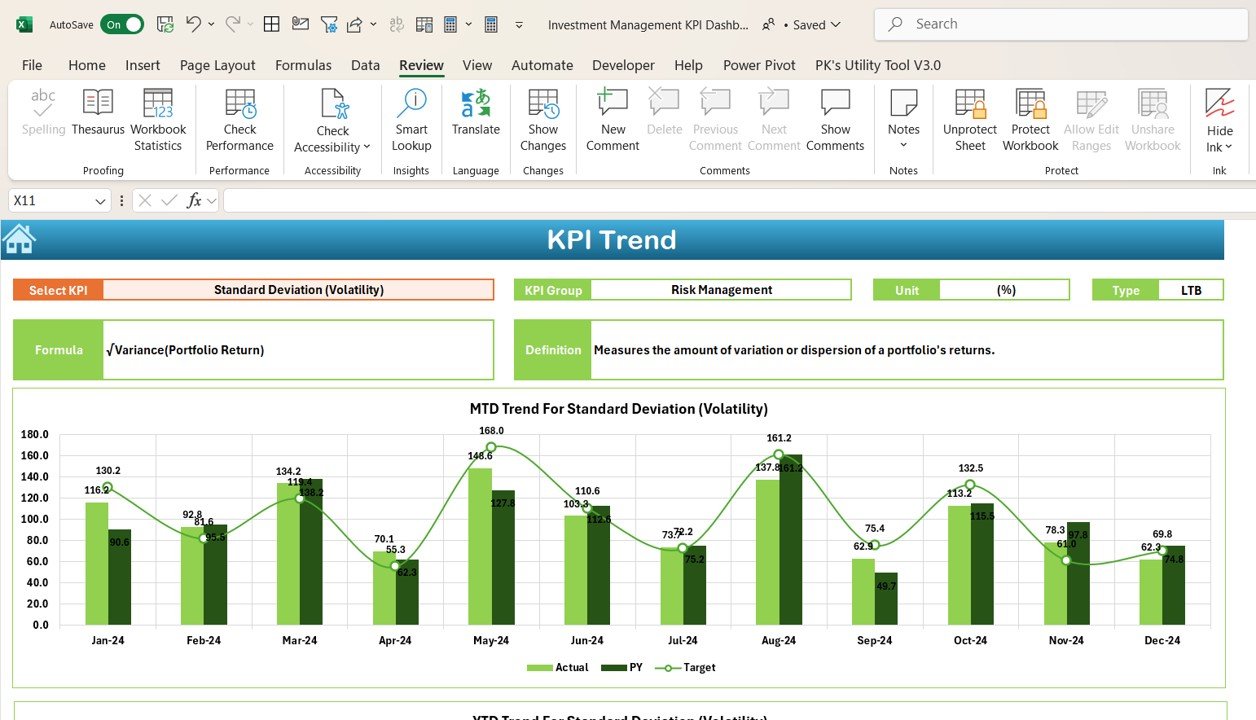
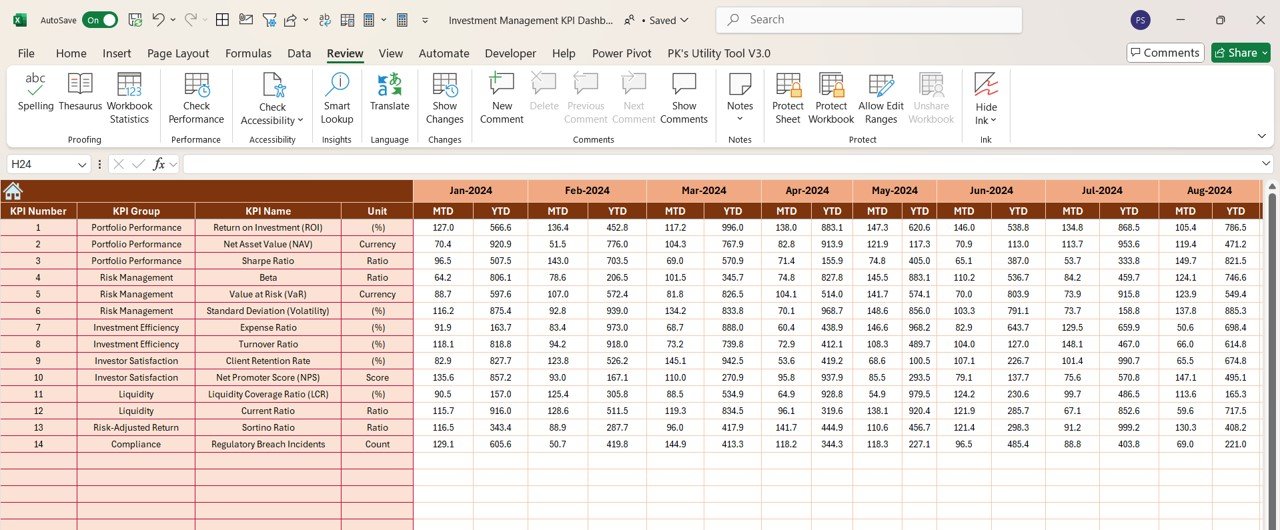
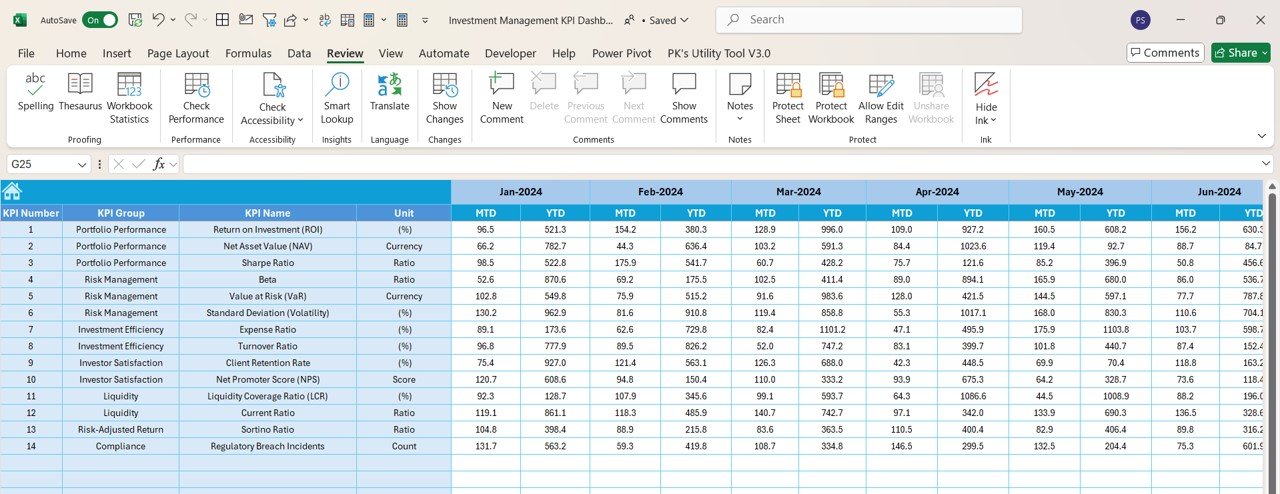
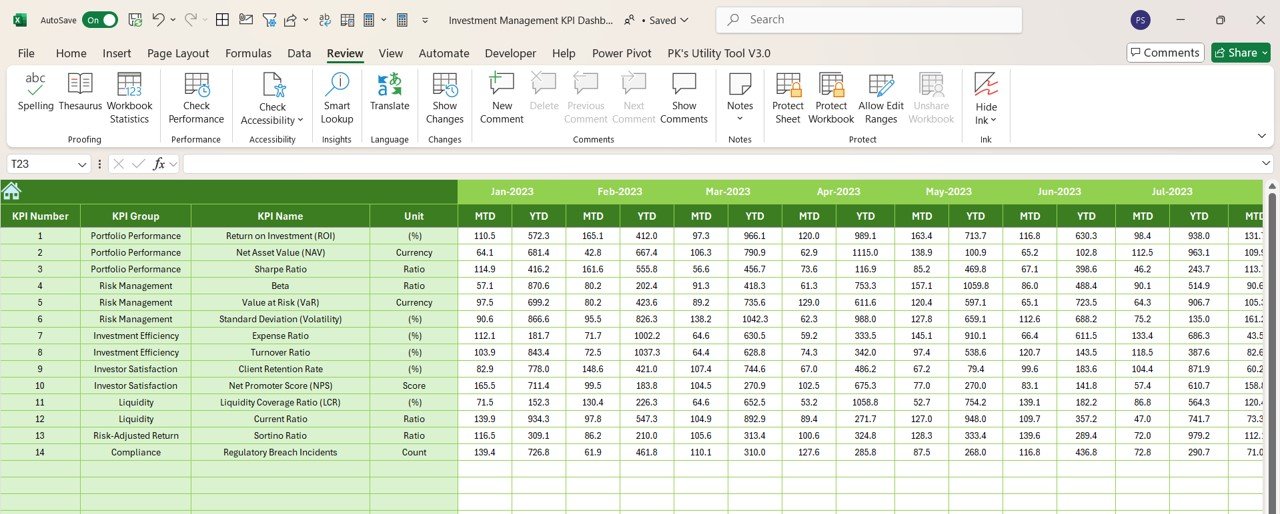
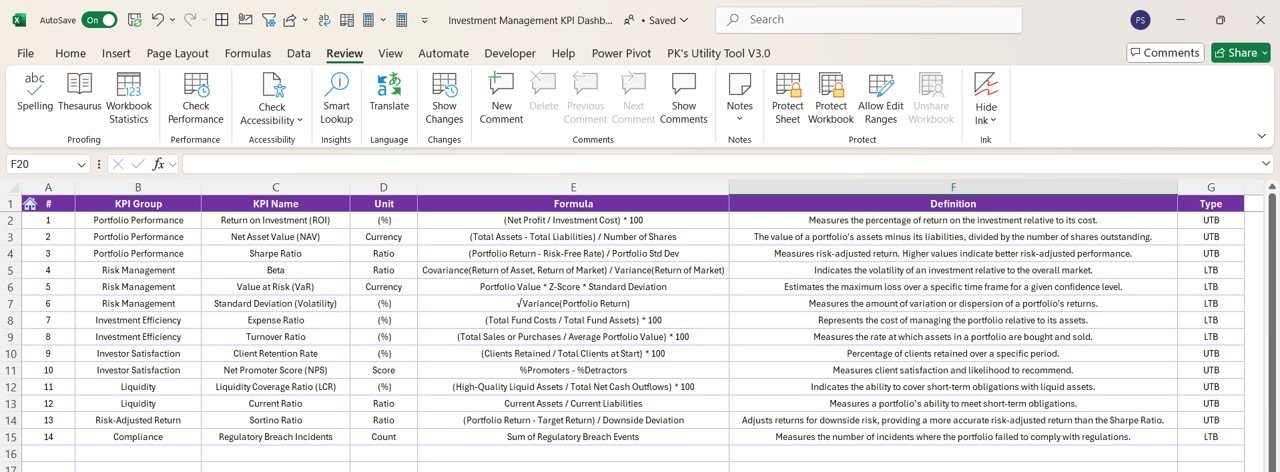

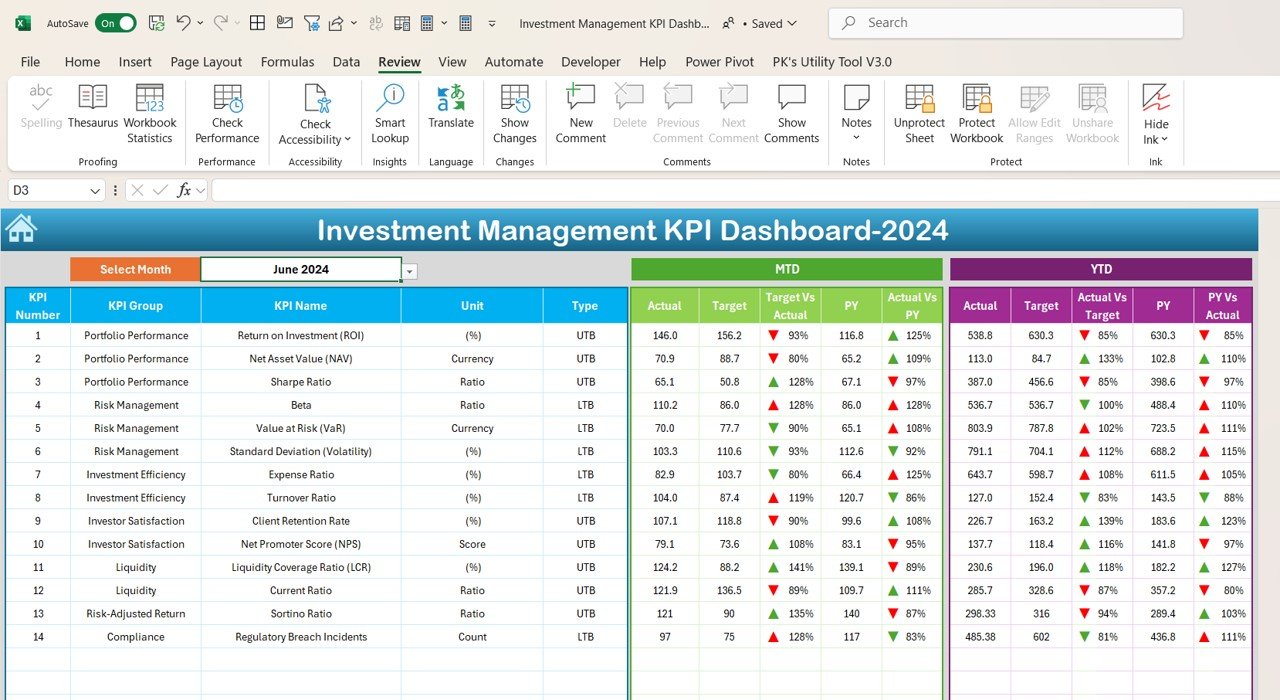
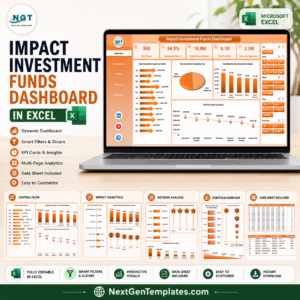
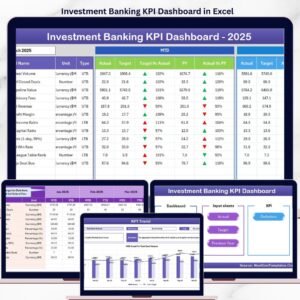
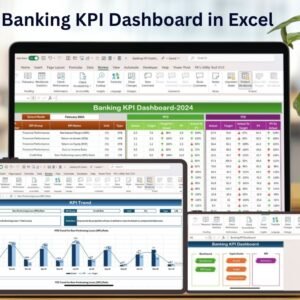
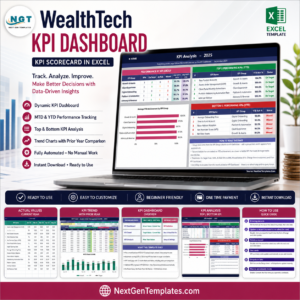
The Investment Management KPI Dashboard in Excel is a powerful tool designed for investment managers, portfolio managers, financial analysts, and investors who want to track, monitor, and optimize their investment portfolios. This dashboard provides a clear and concise view of key performance indicators (KPIs) that are essential for effective investment management, including return on investment (ROI), asset allocation, portfolio performance, and risk metrics.
With real-time data tracking, visual charts, and customizable fields, this Excel-based dashboard enables investors to make informed, data-driven decisions, optimize portfolio performance, and manage risks. Whether you’re tracking stocks, bonds, mutual funds, or other investment assets, this dashboard helps ensure that your investment strategy is on target to meet financial goals.
Key Features of the Investment Management KPI Dashboard in Excel:
📊 Comprehensive KPI Tracking
Track essential investment KPIs such as ROI, portfolio growth, asset allocation, risk exposure, and dividends—all in one dashboard.
📈 Real-Time Portfolio Monitoring
Monitor the performance of your investment portfolio in real-time, ensuring that you stay up-to-date on the performance of your assets.
📅 Month-to-Date (MTD) and Year-to-Date (YTD) Performance
Analyze the performance of your investments over time with MTD and YTD views, comparing current data to previous periods.
🎯 Goal Setting and Performance Comparison
Set specific financial goals for your investments and compare actual performance against these targets, ensuring your portfolio is on track to meet its objectives.
🛠 Customizable Inputs
Easily input your own investment data such as asset allocation, stock performance, and dividend earnings, and adjust the dashboard to fit your investment strategy.
🔔 Conditional Formatting Alerts
Receive real-time alerts with color-coded indicators to quickly identify underperforming assets, high-risk investments, or missed targets.
💡 Risk and Portfolio Insights
Gain deeper insights into your portfolio’s risk exposure, diversification, and overall performance, helping you make informed decisions to reduce risk and increase returns.
🚀 Why You’ll Love the Investment Management KPI Dashboard in Excel:
✅ Monitor Portfolio Performance – Track your investment performance across different asset classes, including stocks, bonds, and mutual funds, all in one place.
✅ Optimize Asset Allocation – Monitor how your assets are allocated across different sectors or investment types to ensure that your portfolio is properly diversified.
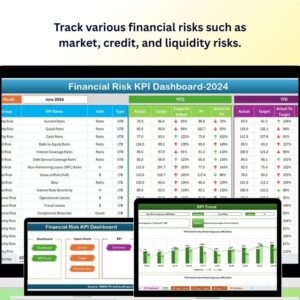
✅ Manage Risk Effectively – Track risk metrics such as volatility, maximum drawdown, and risk-adjusted returns to ensure your investments are well-balanced.
✅ User-Friendly Interface – Designed for ease of use, this dashboard enables both novice and experienced investors to manage their investments effectively.
✅ Fully Customizable – Tailor the dashboard to fit your investment goals, whether you’re focused on growth, income, or capital preservation.
What’s Inside the Investment Management KPI Dashboard in Excel:
- Return on Investment (ROI): Track the return on each investment, helping you measure the success of your investment strategy.
- Portfolio Performance: Monitor the overall performance of your entire portfolio, including total returns, growth, and sector performance.
- Asset Allocation: Visualize how your assets are distributed across various investment categories (stocks, bonds, real estate, etc.).
- Risk Metrics: Measure volatility, Sharpe ratio, and drawdown to understand the risk levels in your portfolio.
- Dividend Earnings: Track dividend income and calculate dividend yields for income-generating investments.
- Benchmark Comparison: Compare your portfolio’s performance against market benchmarks to assess relative performance.
How to Use the Investment Management KPI Dashboard in Excel:
1️⃣ Download the Template – Instantly access your Excel dashboard upon purchase.
2️⃣ Input Your Data – Enter your investment data such as asset allocation, stock performance, dividends, and other metrics into the provided fields.
3️⃣ Set Financial Goals – Define targets for returns, risk, and asset allocation to guide your investment decisions.
4️⃣ Monitor Progress – Track your portfolio’s performance in real-time and identify areas for adjustment based on your financial goals.
5️⃣ Generate Reports – Use the dashboard to generate detailed performance reports for personal analysis or client presentations.
Who Can Benefit from the Investment Management KPI Dashboard in Excel:
- Investment Managers
- Portfolio Managers
- Financial Analysts
- Wealth Managers
- Private Investors
- Hedge Fund Managers
- Financial Advisors
- Business Owners
The Investment Management KPI Dashboard in Excel is the perfect tool for any investor looking to optimize portfolio performance, track key financial metrics, and make data-driven investment decisions.
Click here to read the Detailed blog post
https://www.pk-anexcelexpert.com/investment-management-kpi-dashboard-in-excel/
Visit our YouTube channel to learn step-by-step video tutorials
Youtube.com/@PKAnExcelExpert












Reviews
There are no reviews yet.