

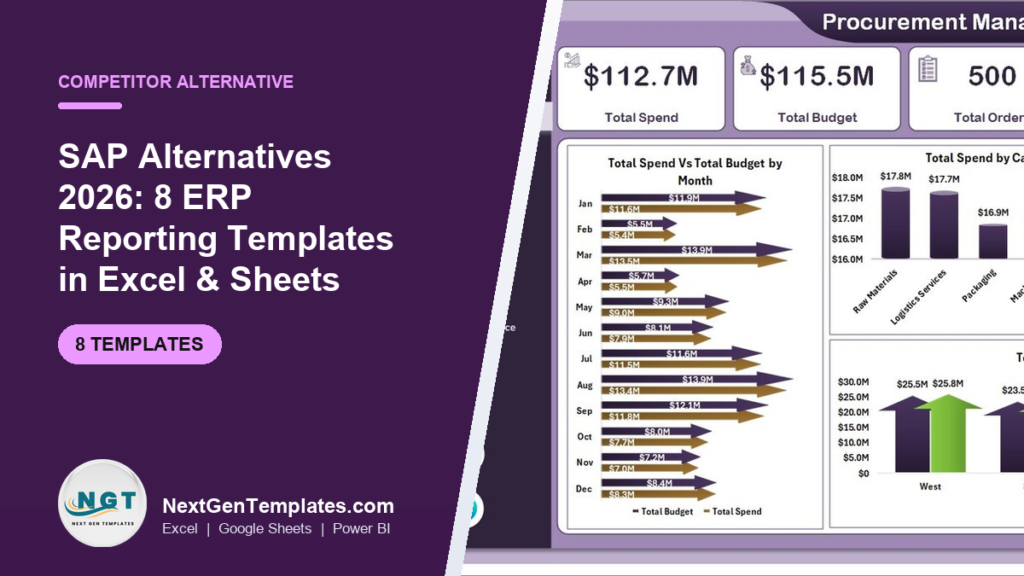
The best SAP alternative Excel dashboard is a one-time ERP reporting template that rebuilds the module you actually read – finance, procurement, inventory or warehouse – without a per-user SAP licence. Our top pick is the Supply Chain Management Dashboard in Excel ($17.99, paid once), which covers the operational reporting most SAP users export to Excel anyway.
Last updated: August 2026
Related guide: Replacing the sales side of your stack too? See Salesforce alternatives: 8 CRM templates in Excel & Sheets.
Key takeaways
- SAP publishes no self-serve list price for S/4HANA or Business One – the official pricing page routes you to a quote, so every figure you read online is a third-party estimate, not a rate card.
- Independent ERP research firms report SAP S/4HANA Cloud Public Edition from roughly $180 per user per month, and SAP Analytics Cloud – the dashboard layer – at about $36 per BI user per month on top.
- All 8 templates in this guide are one-time purchases between $12.99 and $64.99, with no per-seat fee, no renewal and no Digital Access document charge.
- Best overall is the Supply Chain Management Dashboard in Excel ($17.99); best value is the Finance & Accounting Command Center ($64.99 for 8 templates, about $8.12 each).
- Templates replace SAP reporting, not SAP transactions – we name the six situations where you should stay on SAP and pay the bill.
 Launch offer
SUMIFS, XLOOKUP, FILTER, LAMBDA and checking AI-written formulas, with real business projects. 11h 47m of video by PK, with practice files, quizzes and a capstone.
Why teams leave SAP – and what it actually costs
SAP is not a bad product. It runs a very large share of the world’s manufacturing, distribution and public-sector back offices, and for good reason. But the companies that churn off it – or, more often, refuse to migrate onto it – are almost always doing the same arithmetic, and it comes down to three things plus one that nobody warns you about.
1. Seat cost, and the FUE puzzle behind it. SAP’s official S/4HANA pricing page does not publish a per-user list price. Everything goes through SAP sales or a certified partner, which is itself the first cost: you cannot budget without a sales cycle. What SAP does publish is the licensing unit. S/4HANA Cloud Public Edition is sold in Full Use Equivalents (FUEs), where 1 Advanced Use user equals 1 FUE, 5 Core Use users equal 1 FUE, and 30 Self-Service users equal 1 FUE. Independent ERP research firms report list pricing from about $180 per user per month, rising to $300-$400 for Advanced Use. On those reported numbers a modest 25-FUE contract lands near $54,000 a year, every year.
2. You pay for modules you never open. A distributor that bought S/4HANA for FI, MM and SD still carries the plumbing for PP, QM, PM, EWM and a dozen more. Most of those never get configured. Worse for our purposes here, the reporting most people actually want – a spend-by-category chart, an on-time-delivery trend, a payables ageing – usually arrives as a separate paid layer. SAP Analytics Cloud is reported at roughly $36 per BI user per month; twenty read-only viewers is about $8,640 a year for charts on data you already own.
3. Admin overhead that never shrinks. Someone maintains authorisation roles, tests transports, re-validates the CDS views after every upgrade, and rebuilds the query when finance renames a cost centre group. In a company of 200, that is rarely less than one full-time role. In a company of 40, it is a director doing it badly at 11pm.
4. The one nobody warns you about: licence-audit exposure. SAP’s Digital Access model charges for documents that third-party systems create inside SAP – your webshop posting a sales order, your WMS posting a goods movement, an IoT device posting a maintenance notification. Reported list rates start around $0.40 per document and scale down with volume, and SAP’s Global License Audit team typically measures every 24 months. The practical effect is that integrating anything with SAP carries a licence cost that is invisible until the audit letter arrives. A reporting template that reads a CSV export creates zero documents and triggers zero Digital Access liability. That is not a small footnote – for a lot of teams it is the whole reason they build the report outside SAP.
And the deadline sitting behind all of it. Mainstream maintenance for SAP ECC ends in December 2027. Standard extended maintenance runs to December 2030 for an extra 2% of your maintenance base, and SAP has offered a cloud subscription transition option covering 2031 to the end of 2033 for very complex landscapes. Every ECC customer is therefore in a forced conversation about a migration project – and migration projects are exactly when finance asks whether the reporting really needs to live inside the ERP at all.
SAP module vs the NGT template that covers it
Here is the head-to-head. On the left, the SAP module or add-on you are paying for; in the middle, the NGT template that reproduces its reporting; on the right, the one-time price.
| SAP module / add-on | What you use it for | NGT template that covers the reporting | One-time price |
|---|---|---|---|
| SAP MM + SD + LE | End-to-end supply chain reporting | Supply Chain Management Dashboard in Excel | $17.99 |
| SAP FI / CO | Financial accounting and controlling | Finance & Accounting Command Center (8 templates) | $64.99 |
| SAP MM (Purchasing) | PO cycle, supplier performance | Procurement Management Dashboard in Excel | $17.99 |
| SAP Ariba / Spend Analysis | Category spend, maverick buying | Procurement Spend Analysis Dashboard in Power BI | $17.99 |
| SAP MM-IM / EWM | Stock levels, turns, ageing | Inventory Management Dashboard in Power BI | $17.99 |
| SAP FI-AP | Invoice-to-pay, DPO, ageing | Accounts Payable KPI Dashboard in Excel | $12.99 |
| SAP MM KPI reporting | Procurement scorecard for management | Procurement KPI Scorecard in Google Sheets | $12.99 |
| SAP WM / EWM | Pick rates, dock-to-stock, accuracy | Warehouse Management KPI Dashboard in Google Sheets | $12.99 |
SAP alternative templates compared
Every template in this guide, side by side. Two rows are flagged: one best overall and one best value. Total for all eight is $175.92, once – about what a single reported S/4HANA seat costs in its first month.
| Template | Format | Best for | Price |
|---|---|---|---|
| Supply Chain Management Dashboard (Best overall) | Excel | Broadest single-file ERP operations report | $17.99 |
| Finance & Accounting Command Center (Best value) | Excel + Power BI + Google Sheets | Replacing FI/CO reporting across three formats | $64.99 |
| Procurement Management Dashboard | Excel | Purchase-order cycle and supplier scoring | $17.99 |
| Procurement Spend Analysis Dashboard | Power BI | Category spend and maverick-buy analysis | $17.99 |
| Inventory Management Dashboard | Power BI | Stock turns, ageing and reorder signals | $17.99 |
| Accounts Payable KPI Dashboard | Excel | DPO, ageing and payment-run control | $12.99 |
| Procurement KPI Scorecard | Google Sheets | Cloud procurement scorecard for management | $12.99 |
| Warehouse Management KPI Dashboard | Google Sheets | Free-to-run warehouse KPI tracking | $12.99 |
How we picked these
We searched the NextGenTemplates catalogue of roughly 6,900 published products for finance, procurement, supply chain, inventory and warehouse reporting in Excel, Google Sheets and Power BI, then mapped each candidate against a specific SAP module – MM, FI/CO, SD, WM/EWM or Ariba – and kept only the ones that reproduce a report an SAP user would otherwise build in a query, a CDS view or SAP Analytics Cloud. We excluded single-industry niche dashboards that would only suit one vertical, anything without editable formulas or a visible data model, and free files that cannot hold a year of transaction history. Every template below is paid, one-time, and structured so you can paste a standard SAP export into an input tab – because an ERP reporting replacement that cannot ingest an export is not a replacement.
The 8 best SAP alternative templates for 2026
1. Supply Chain Management Dashboard in Excel – best overall
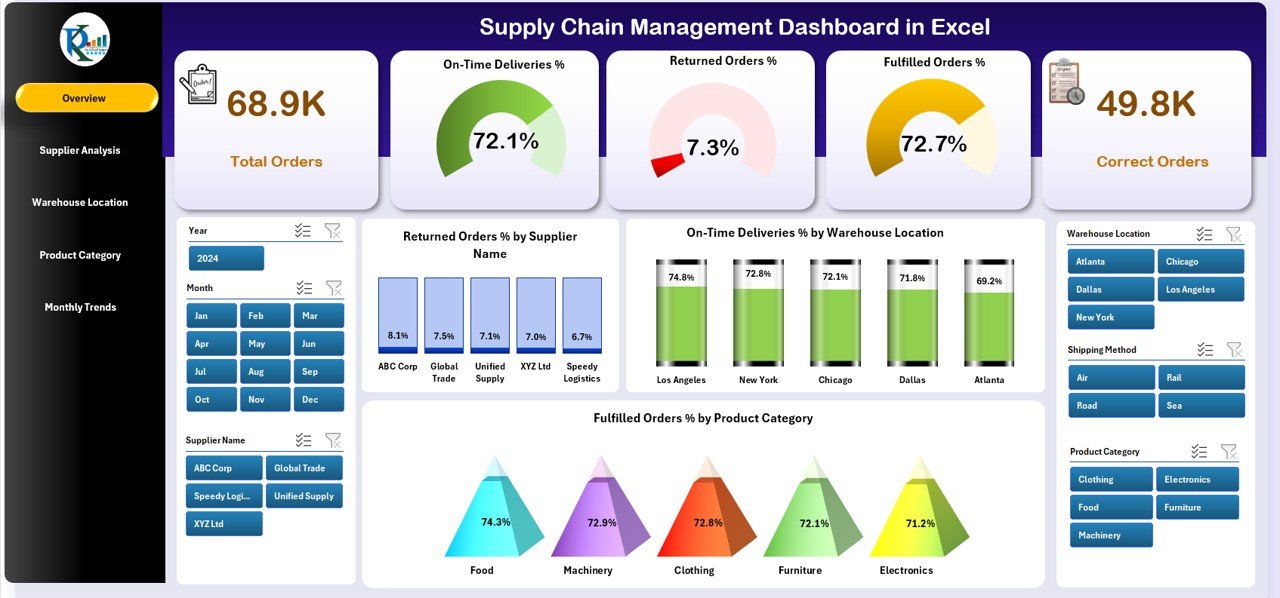
This is the closest single file to what an SAP user actually looks at every week: orders, on-time delivery, supplier performance, fulfilment and returns in one Excel workbook with slicers for year, month and supplier.
Who it is for: an operations or supply chain manager who exports from SAP into Excel anyway and wants the pivot work already done.
What is inside:
- KPI cards for total orders, on-time delivery %, fulfilment rate and returned-order %
- Supplier-level breakdowns so you can rank vendors without an Ariba module
- Year / month / supplier slicers synced across every page
- A clean input sheet that takes a pasted SAP or WMS export without reformatting
It is our number one because it covers the widest slice of ERP reporting in a single file, in the format the SAP world already lives in. Almost every SAP shop has an unofficial Excel layer – this replaces the hand-built version of it. Use it for a weekly supplier review, a monthly ops pack, or a quarterly OTIF trend. A three-person ops team replacing twenty SAP Analytics Cloud viewer seats recovers the $17.99 in the first hour. Pair it with our Power BI dashboard templates ranked by industry when you outgrow one workbook.
Best for: the broadest one-file SAP-to-spreadsheet swap. $17.99 – view the template.
2. Finance & Accounting Command Center – best value
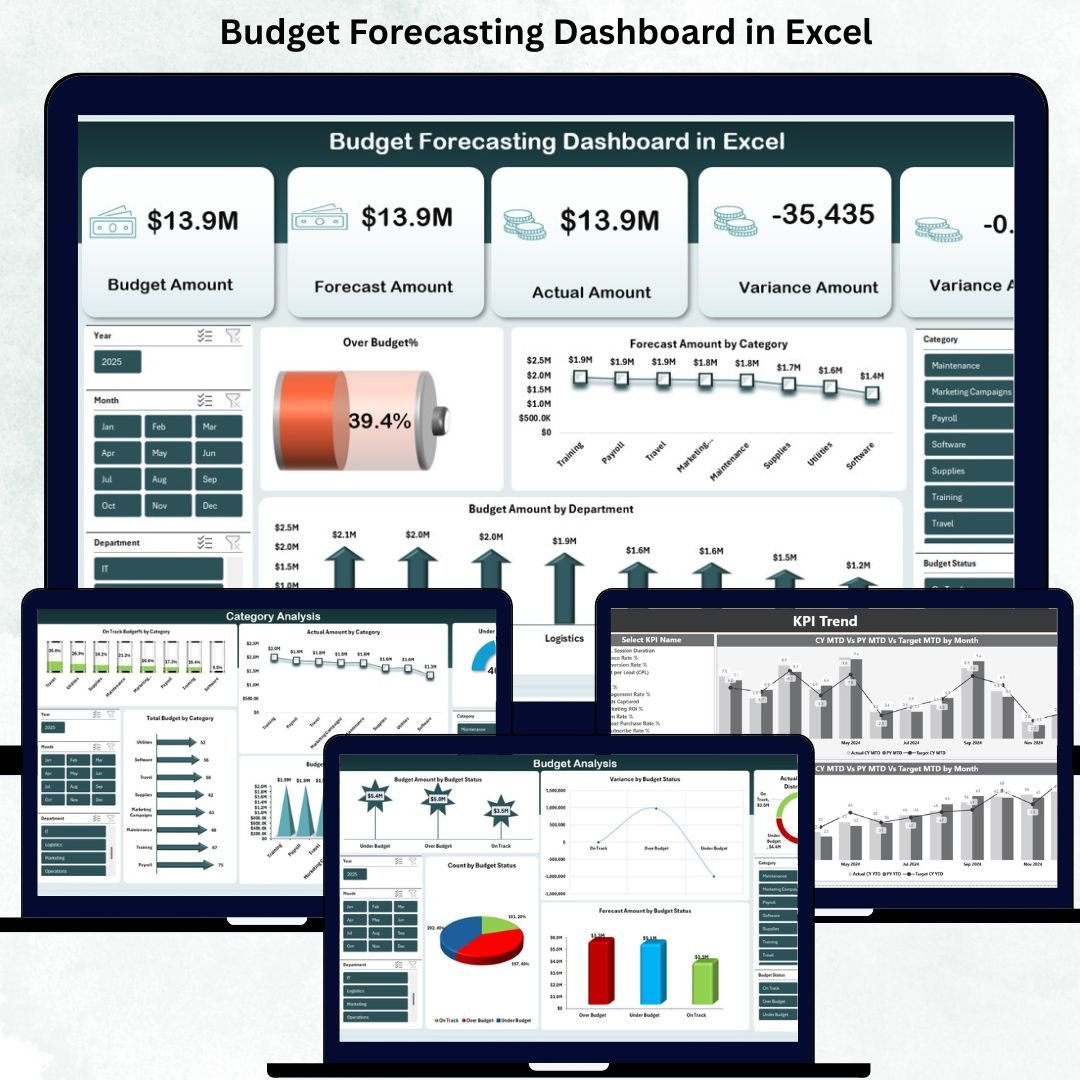
Eight premium finance templates across Excel, Power BI and Google Sheets in one purchase – budgeting and forecasting, expense tracking, financial statements and accounting KPIs. This is the FI/CO reporting layer, unbundled from the ERP.
Who it is for: a finance lead or controller who needs the management pack every month and does not want to wait on an SAP report request.
What is inside:
- Budget vs actual forecasting with variance by cost centre and period
- Expense analysis and cash-position views in both Excel and Power BI
- Accounting KPI dashboards with month-on-month and YTD comparisons
- Google Sheets versions so the CFO can read the numbers on a phone
At $64.99 for eight templates the effective price is about $8.12 each, which is why this is the best-value entry. Against the reported $36 per user per month for SAP Analytics Cloud, the bundle pays for itself before the second monthly invoice on two seats. The practical use case is the month-end pack: export the trial balance, paste it once, and every chart in all eight files refreshes. It also covers three formats, so a mixed Microsoft-and-Google finance team does not have to standardise first.
Best for: replacing FI/CO management reporting in one purchase. $64.99 – view the bundle.
3. Procurement Management Dashboard in Excel
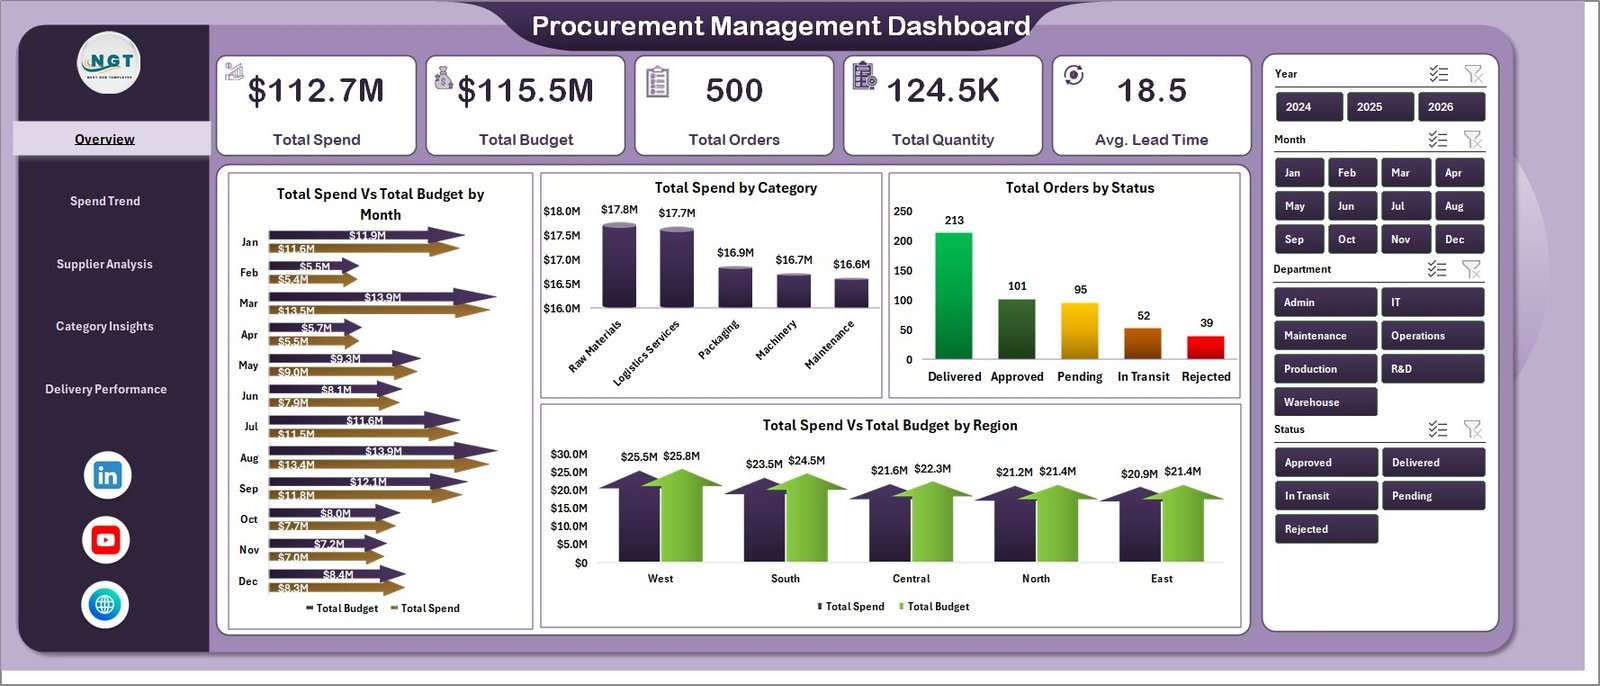
SAP MM’s purchasing reporting – spend against budget, order counts, category mix, regional split – rebuilt as an Excel dashboard with a proper input model rather than a stack of ME2N exports.
Who it is for: a purchasing manager who runs the PO cycle in SAP but reports on it to a board that will never log in.
What is inside:
- Total spend, total budget and total order KPI cards with variance
- Spend vs budget by month, so overruns show up in week two not quarter three
- Spend by category and by region, the two cuts every procurement review asks for
- Supplier concentration views to expose single-source risk
The number this template earns its price on is maverick spend. Categories where actual consistently exceeds budget are where off-contract buying hides, and a monthly spend-vs-budget chart surfaces it without a spend-analytics subscription. For a company buying $10m a year, recovering even 0.5% of off-contract spend is $50,000 – against a $17.99 file. It sits naturally beside our project management templates in Excel and Sheets when procurement is tied to project milestones.
Best for: purchase-order cycle and category spend reporting. $17.99 – view the template.
4. Procurement Spend Analysis Dashboard in Power BI
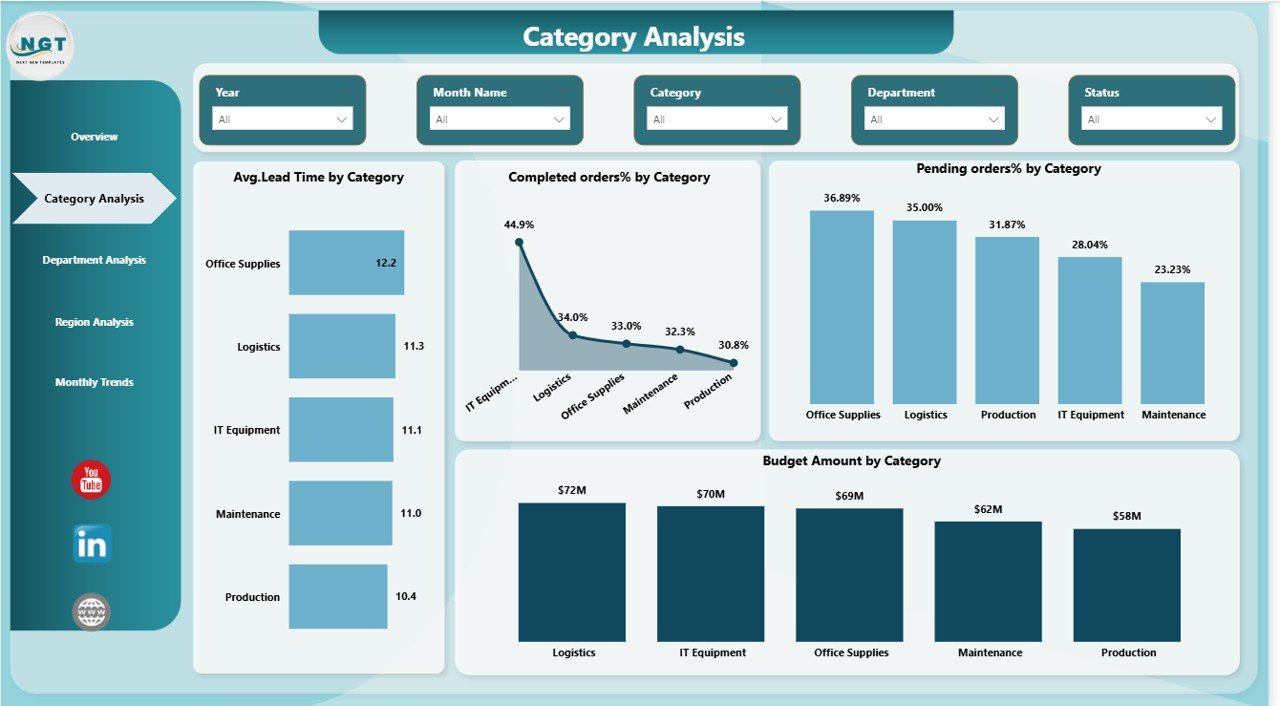
Where the Excel version reports, this one analyses. It is a Power BI model with a date table and DAX measures, so you can slice several years of purchase history by supplier, category, plant and period without the workbook slowing down.
Who it is for: a category manager or analyst with more purchase-order history than an Excel sheet can comfortably hold.
What is inside:
- Semantic model with a proper date table and pre-built spend measures
- Slicers for supplier, category, region and period, synced across pages
- Period-over-period deltas on every KPI card
- Drillable detail so a spike in one category resolves to the actual POs
This is the honest answer to the volume objection. An Excel worksheet stops at 1,048,576 rows; a Power BI import model handles tens of millions comfortably. If your SAP estate produces 40,000 purchase-order lines a month, three years of history is 1.44 million rows – past Excel’s ceiling, nowhere near Power BI’s. Publishing inside your own tenant also means no Digital Access documents are created, because nothing writes back to SAP.
Best for: multi-year category spend analysis at volume. $17.99 – view the template.
Not sure which module to replace first? Start with the one your team already exports to Excel every week. For most SAP shops that is supply chain or procurement – the Supply Chain Management Dashboard in Excel at $17.99 or the Procurement Management Dashboard in Excel at $17.99. Both are one-time purchases with no seat count attached.
5. Inventory Management Dashboard in Power BI
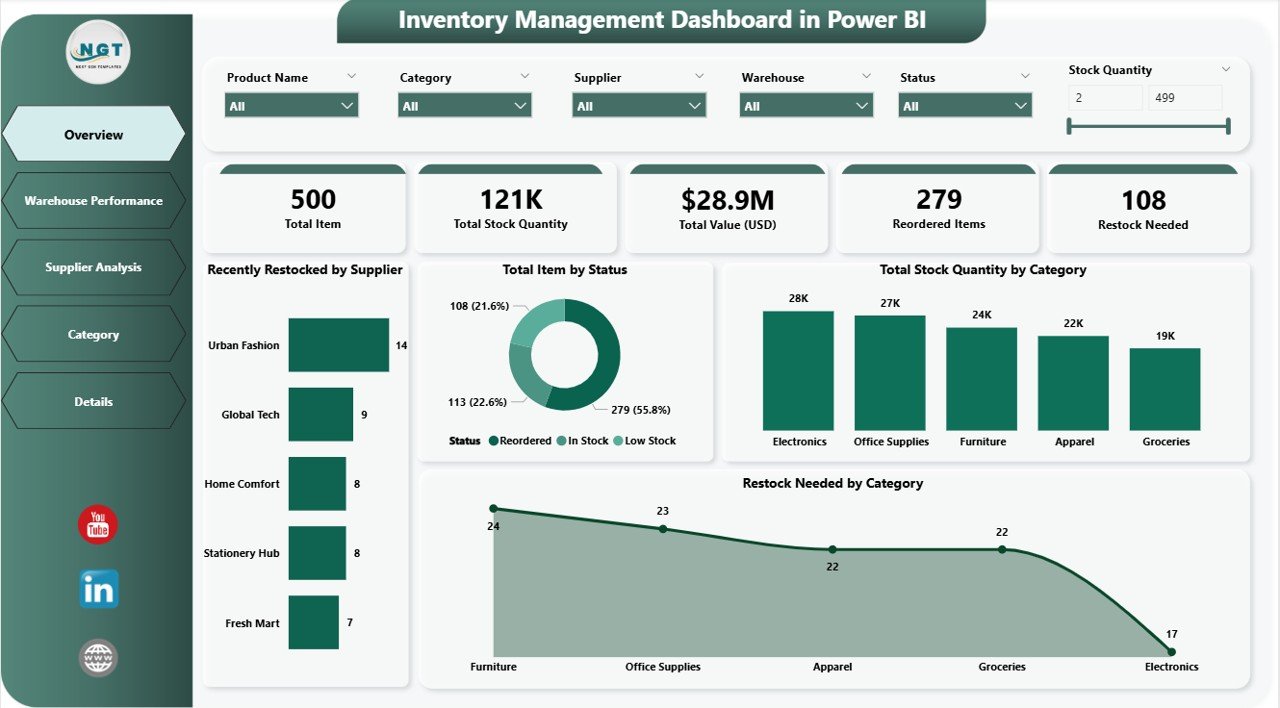
SAP MM-IM tells you what is in stock. This tells you what that stock is costing you. Turns, ageing, stock value by location and reorder signals, in an interactive Power BI report.
Who it is for: an inventory or planning manager who needs stock health visible to non-SAP users – warehouse supervisors, the CFO, the sales director.
What is inside:
- Stock value, turnover ratio and days-of-supply KPI cards
- Ageing buckets that expose slow-moving and obsolete stock
- Location and category slicers for multi-warehouse operations
- Reorder-point views that flag SKUs before they stock out
Inventory turnover is the metric to watch here: cost of goods sold divided by average inventory value. Distribution benchmarks generally sit between 4 and 8 turns a year, manufacturing lower, grocery far higher. If a $2m inventory is turning 3 times against a sector norm of 6, roughly $1m of working capital is trapped on shelves – a number worth far more than the licence you saved. For a wider view of the same family, see our Power BI dashboard templates by industry.
Best for: stock turns, ageing and working-capital visibility. $17.99 – view the template.
6. Accounts Payable KPI Dashboard in Excel

SAP FI-AP holds the invoices; this holds the scorecard. Days payable outstanding, invoice ageing, cost per invoice, first-time-match rate and early-payment discount capture in an Excel KPI dashboard with actual-versus-target logic and traffic lights.
Who it is for: an AP manager or shared-services lead who reports monthly on payables performance and cannot get a custom report out of SAP without a change request.
What is inside:
- Actual / target input model with automatic red-amber-green status per KPI
- MTD and YTD views with a month picker
- Trend page so you can see whether DPO is drifting, not just where it landed
- A KPI definition tab, which matters when finance and procurement argue about formulas
The formula that pays for this file is DPO: (accounts payable divided by cost of goods sold) multiplied by 365. Push DPO from 32 to 45 days on $12m of annual COGS and you free roughly $427,000 of working capital – permanently, with no financing cost. That is the single strongest argument for measuring payables outside the ERP, where the report takes minutes rather than a ticket.
Best for: payables performance and working-capital control. $12.99 – view the template.
7. Procurement KPI Scorecard in Google Sheets
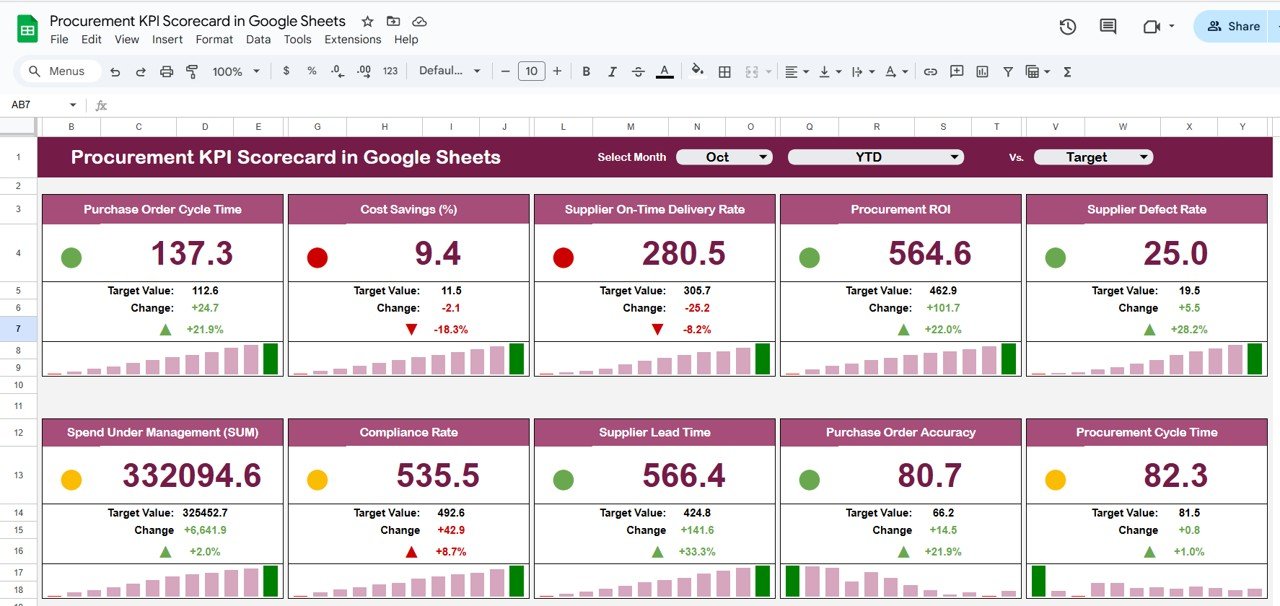
The same procurement story as entry three, but cloud-native and share-by-link. Ten procurement KPIs with targets, traffic lights and sparklines, running on a free Google account.
Who it is for: a procurement team spread across sites or countries where not everyone has an SAP licence, a Microsoft 365 seat, or both.
What is inside:
- Ten scorecard tiles – cost savings, PO cycle time, supplier on-time rate, contract compliance and more
- Month picker driving MTD and YTD in one view
- Traffic lights against a target you set per KPI
- Trend and analysis tabs for the twelve-month view
This is the cheapest way to give people read access to procurement performance. Under SAP’s model, every viewer needs a licence category, and even Self-Service users consume FUE at 30 to 1. A Google Sheet link consumes nothing. Set edit access for the two buyers who maintain it and view-only for everyone else – the plant managers, the CFO, the board – and the running cost is zero. It is a natural companion to our Zoho CRM alternatives in Excel and Sheets if you run the supplier and customer sides on the same stack.
Best for: distributed procurement teams and zero-cost viewers. $12.99 – view the scorecard.
8. Warehouse Management KPI Dashboard in Google Sheets
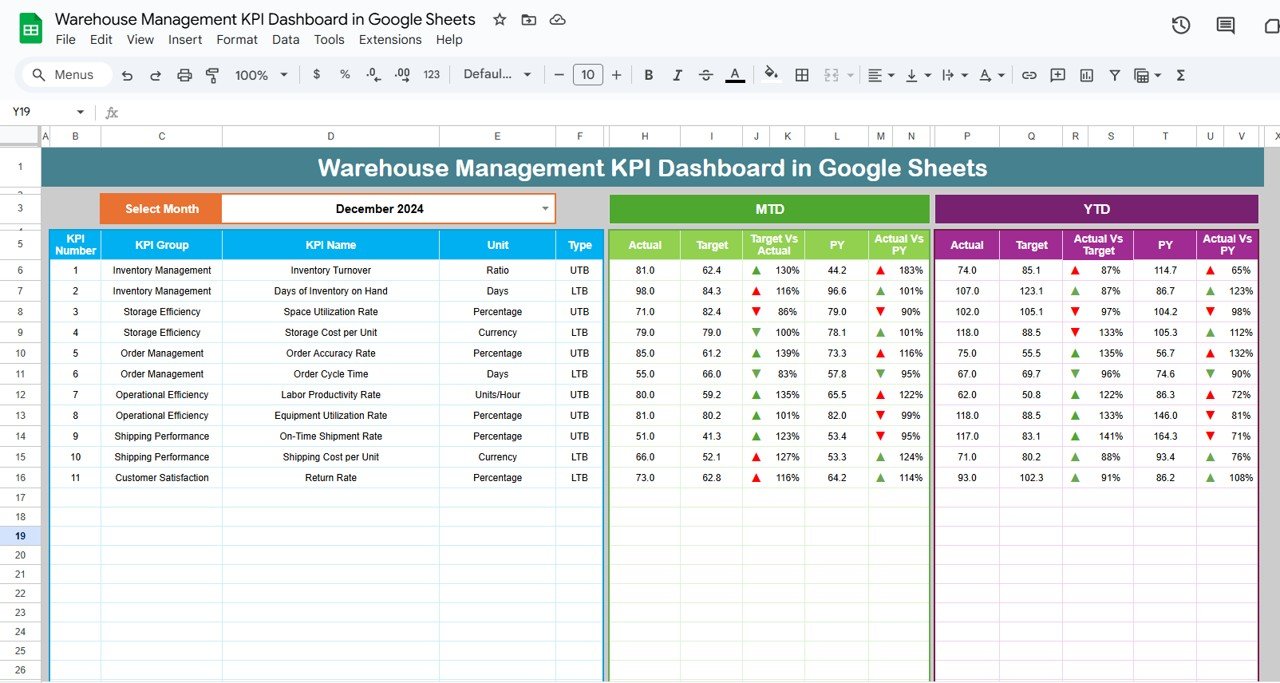
SAP EWM is one of the most expensive modules to configure and one of the least often fully used. This covers the reporting half – pick accuracy, dock-to-stock time, order cycle time, space utilisation and labour productivity – in a shared Google Sheet.
Who it is for: a warehouse or 3PL manager whose team works on the floor, not at a desk, and needs the numbers on a tablet.
What is inside:
- KPI cards for order accuracy, picking productivity and inventory accuracy
- Dock-to-stock and order cycle time tracking with targets
- Space and labour utilisation views for capacity planning
- Cloud sharing so shift supervisors update it directly from the floor
The benchmark worth holding this against is order accuracy: best-in-class distribution operations run above 99.5%, and every percentage point below that translates into returns, credits and re-picks. At 97% accuracy on 5,000 orders a month, that is 150 wrong shipments – and at a typical $25 to $70 all-in cost to correct one, $3,750 to $10,500 a month of avoidable spend. You cannot fix what nobody on the floor can see, which is the real problem with warehouse KPIs locked inside an ERP.
Best for: floor-level warehouse KPI visibility at no running cost. $12.99 – view the template.
How to choose between them
Pick by the SAP module you are trying to stop paying to report on, then by the format your readers already use. Four questions settle it.
| If your situation is… | Start with | Price |
|---|---|---|
| You export SAP data to Excel every week already | Supply Chain Management Dashboard in Excel | $17.99 |
| Finance needs the month-end pack, in three formats | Finance & Accounting Command Center | $64.99 |
| Procurement reports to a board that has no SAP login | Procurement Management Dashboard in Excel | $17.99 |
| You have 3+ years of PO history, over a million rows | Procurement Spend Analysis Dashboard in Power BI | $17.99 |
| Working capital is the board’s question, not cost | Inventory Management Dashboard in Power BI | $17.99 |
| AP performance is measured but never reported | Accounts Payable KPI Dashboard in Excel | $12.99 |
| Your team is distributed and licence-light | Procurement KPI Scorecard in Google Sheets | $12.99 |
| Your users are on the warehouse floor, on tablets | Warehouse Management KPI Dashboard in Google Sheets | $12.99 |
The format rule is simpler than people make it. Under about 100,000 rows and a Microsoft shop, use Excel. Over a million rows, or several years of history, use Power BI. Distributed team, mixed devices, or readers without a Microsoft licence, use Google Sheets. Buy the bundle only when you need three or more templates from the same family – below that, singles are cheaper.
When SAP is still the right call
This is a reporting swap, not an ERP swap, and it would be dishonest to pretend otherwise. There are six situations where you should keep paying SAP and stop reading here.
1. Statutory consolidation across many legal entities. If you close books for fifteen subsidiaries in nine currencies with intercompany elimination, SAP’s consolidation is doing real work that no spreadsheet reproduces safely. The audit risk alone settles it.
2. Regulated manufacturing with validated audit trails. Pharmaceutical GxP, medical devices, aerospace and defence all require change control and traceability that a workbook cannot evidence to an inspector. A template is a reporting artefact, not a validated system of record.
3. Real-time MRP and production scheduling. If your plants run MRP runs against live stock and capacity across multiple sites, the value is in the transaction engine, not the chart. Templates read history; they do not plan.
4. Statutory e-invoicing and tax compliance. Mandates in India, Italy, Poland, Brazil and the incoming EU ViDA regime require certified transmission and clearance. SAP Document and Reporting Compliance exists because this is genuinely hard, and getting it wrong is a fine, not an inconvenience.
5. You already own the licence and the marginal report is free. If your contract is signed and your BI layer is paid for, building one more query costs you nothing. The saving only exists where you are about to buy a seat, a viewer licence or an analytics subscription that a $17.99 file would have covered.
6. Transaction volumes past the spreadsheet ceiling with no Power BI. Excel stops at 1,048,576 rows per worksheet; Google Sheets caps at 10 million cells per file. If your reporting genuinely needs tens of millions of line items and Power BI is not an option in your organisation, a spreadsheet is the wrong tool and you should say so out loud.
Outside those six, the maths tends to be one-sided. Most teams do not need a second copy of the ERP – they need the six charts they actually read, in a file they own, that nobody can audit them for. If you are also reviewing the tools bolted onto SAP for tickets and projects, our Jira alternatives in Excel and Sheets and Trello alternatives for kanban boards cover the same ground for delivery work.
Frequently asked questions
What is the best SAP alternative Excel dashboard?
The Supply Chain Management Dashboard in Excel ($17.99) is the best SAP alternative Excel dashboard for most teams. It reproduces the operational reporting SAP users export to Excel anyway – orders, on-time delivery, supplier performance and returns – in one file you buy once, with no per-user licence attached.
How much does SAP cost in 2026?
SAP does not publish a self-serve list price. Its official S/4HANA pricing page routes you to a sales quote, and Business One is priced by certified partners. Independent ERP research firms report S/4HANA Cloud Public Edition from roughly $180 per user per month, rising to $300 to $400 for Advanced Use.
Can a spreadsheet replace SAP?
It can replace SAP reporting, not SAP transactions. Templates cover the dashboards, KPIs and management packs people actually read. They do not run MRP, post journals, handle statutory consolidation or manage e-invoicing compliance. Treat this as unbundling the reporting layer, not as removing the ERP.
What is the cheapest SAP alternative for reporting?
The Google Sheets templates here at $12.99 each – the Procurement KPI Scorecard and the Warehouse Management KPI Dashboard. Google Sheets itself is free, so after the one-time file there is no software cost at all, and viewers do not consume any licence unit the way SAP users do.
Does using Excel with SAP trigger Digital Access charges?
Reading a CSV or Excel export out of SAP does not create documents inside SAP, so it does not generate Digital Access liability. Charges apply when a third-party system writes documents into SAP. Every template in this guide reads exported data only, so nothing writes back. Confirm your own contract terms with your licence adviser.
What happens when SAP ECC support ends in 2027?
Mainstream maintenance for SAP ECC ends in December 2027. Standard extended maintenance runs to December 2030 for an additional 2% of your maintenance base, and SAP has offered a transition option covering 2031 to 2033 for complex landscapes. Most customers are planning an S/4HANA conversion in that window.
Do I need SAP Analytics Cloud if I use these templates?
No. SAP Analytics Cloud is the paid dashboard layer on top of the ERP, reported at around $36 per BI user per month. These templates deliver the same charts from an export, which is why a $12.99 to $17.99 one-time file is a genuine substitute for a per-viewer analytics subscription.
How do I move SAP data into a template?
Export the relevant table or report to CSV or XLSX – purchase orders, GL lines, stock, invoices – then paste the columns into the template’s input tab. Excel and Google Sheets dashboards recalculate instantly. For Power BI templates you point the data source at the export and refresh. Budget an hour for the first mapping.
Do these templates work in Excel, Google Sheets and Power BI?
Each template is built for one platform. This guide includes three Excel dashboards, two Power BI reports, two Google Sheets scorecards, and one bundle that spans all three formats. Pick the one your readers already use, because a dashboard nobody can open is worth nothing.
Are one-time templates really cheaper than SAP over a year?
For reporting, almost always. All eight templates here total $175.92 once. A 25-FUE S/4HANA contract at reported list rates is near $54,000 a year, and twenty SAP Analytics Cloud viewers add about $8,640. The comparison is fair only for reporting – the transaction engine is not included either way.
Get more ERP reporting templates
Leaving SAP’s reporting layer does not mean leaving structure behind – it means owning it, and never being audited for it. Start with the Supply Chain Management Dashboard in Excel ($17.99) if your team lives in Excel, or the Finance & Accounting Command Center ($64.99 for eight templates) if finance is the department drowning. Both are one-time purchases with no seat count, no renewal and no document charge. Browse the full range of Power BI dashboard templates by industry to mix formats.
Prefer to see the dashboards working before you buy? Watch build walk-throughs and tutorials on our YouTube channel: youtube.com/@NextGenTemplates.
Related: Replacing other enterprise subscriptions? See our HubSpot alternatives – 8 CRM & marketing templates in Excel & Sheets and Pipedrive alternatives for sales pipelines.
Replacing procurement and spend management specifically? Our Coupa alternative procurement templates cover spend analysis, PO tracking and sourcing KPIs from $11.99.
Running lean and still need board-ready reporting? See our budget guide to the best startup reporting stack templates — enterprise-grade dashboards for a one-time $4.99–$14.99, with a full bundle-vs-single pricing breakdown.