

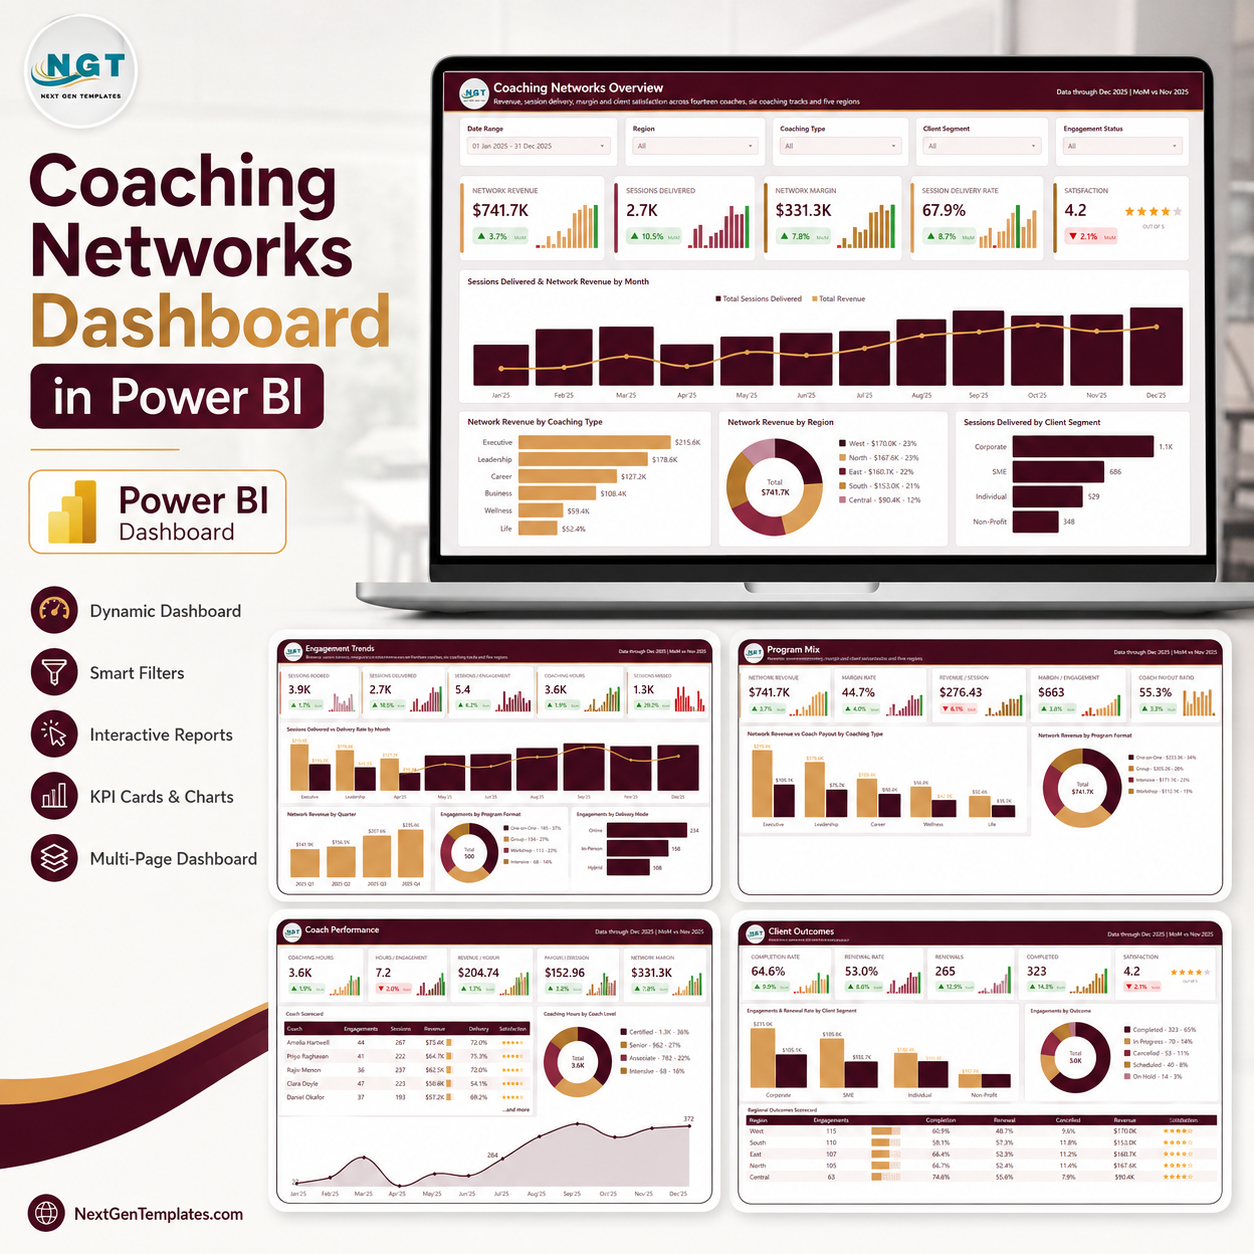
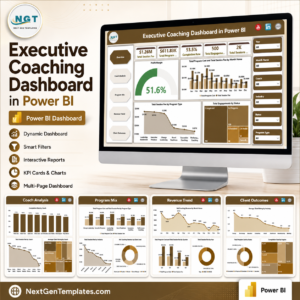
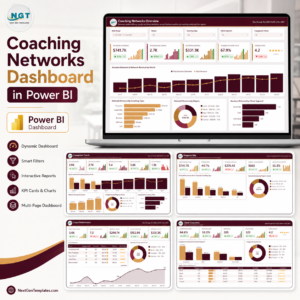
The Coaching Networks Dashboard in Power BI turns 500 coaching engagement records into five linked report pages that answer the questions a coaching network actually argues about: which tracks earn, which coaches deliver, and which clients come back. The sample model carries $741.7K of network revenue, 2,683 sessions delivered against roughly 3,950 booked, a 44.7% margin rate and a 4.2 out of 5 satisfaction average across 14 coaches, 6 coaching tracks and 5 regions. Built by PK, a Microsoft Certified Professional with 15+ years of Excel, Google Sheets and Power BI work. Instant download, no subscription and unlimited reuse – open the .pbix in the free Power BI Desktop, point it at your own data and every card, chart and scorecard repopulates.
This is the analytical Power BI line – five pages of trend, mix and league-table analysis. It is not the month-picker KPI scorecard line, and it is not a coaching management system: nothing here books a session, invoices a client or stores notes.
Key Features of the Coaching Networks Dashboard in Power BI
- Five analysis pages that share one filter mindset. Every page carries a Date Range slicer defaulted to 01 Jan 2025 – 31 Dec 2025, plus Region, Coaching Type and Client Segment, and then one page-specific fifth slicer: Engagement Status on Overview, Delivery Mode on Engagement Trends, Program Format on Program Mix, Coach Level on Coach Performance and Renewed on Client Outcomes.
- 25 KPI cards with real deltas. Each card shows the value, a month-over-month arrow against November 2025 and a 12-month sparkline – for example Network Revenue $741.7K up 3.7%, Sessions Delivered 2.7K up 10.5%, Sessions Missed 1.3K down 20.2% and Satisfaction 4.2 down 2.1%.
- Three league tables, not one. The Coach Scorecard ranks all 14 coaches, the Coaching Track Economics Scorecard ranks the six tracks and the Regional Outcomes Scorecard ranks the five regions – so a network lead can argue about people, product and geography without leaving the file.
- A Details drillthrough bound on nine fields. Right-click a coach, a region, a track, a delivery mode, a program format, a client segment, a status or a renewal flag and land on a hidden Details page filtered to exactly that slice.
- Two 280×360 tooltip pages. Category Detail and Trend Detail appear on hover, so the canvas stays readable at 1280×720 while the extra context is one mouse-move away.
- 38 measures referenced across the report visuals – revenue, payout, margin, margin rate, payout ratio, revenue per session, revenue per coaching hour, margin per engagement, delivery rate, completion rate, renewal rate, cancellation rate, sessions per engagement, hours per engagement and satisfaction, each written once and reused.
- A 17-column, 500-row source table. Engagement ID, Date, Coach, Coach Level, Coaching Type, Program Format, Delivery Mode, Client Segment, Region, Status, Renewed, Sessions Booked, Sessions Delivered, Coaching Hours, Revenue, Coach Payout and Satisfaction Score.
What’s Inside the Coaching Networks Dashboard in Power BI
Page 1 – Coaching Networks Overview
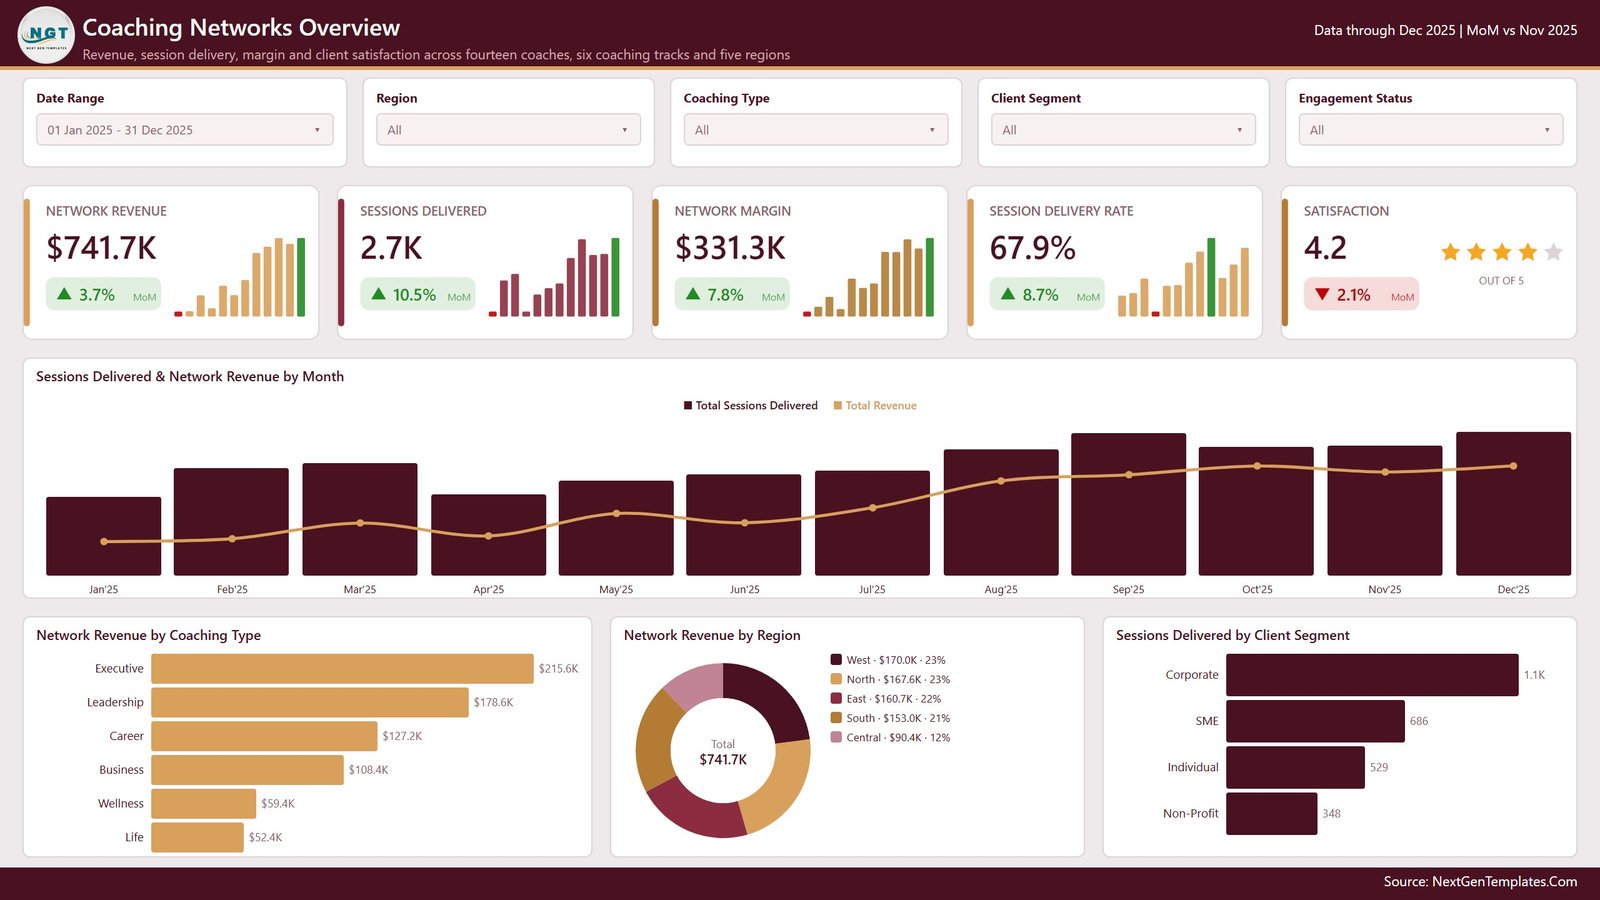
The landing page. Five cards – Network Revenue $741.7K, Sessions Delivered 2.7K, Network Margin $331.3K, Session Delivery Rate 67.9% and Satisfaction 4.2 out of 5 with a star rating. Below them a combination chart, Sessions Delivered & Network Revenue by Month, then Network Revenue by Coaching Type (Executive $215.6K, Leadership $178.6K, Career $127.2K, Business $108.4K, Wellness $59.4K, Life $52.4K), Network Revenue by Region as a donut (West $170.0K, North $167.6K, East $160.7K, South $153.0K, Central $90.4K) and Sessions Delivered by Client Segment (Corporate 1.1K, SME 686, Individual 529, Non-Profit 348).
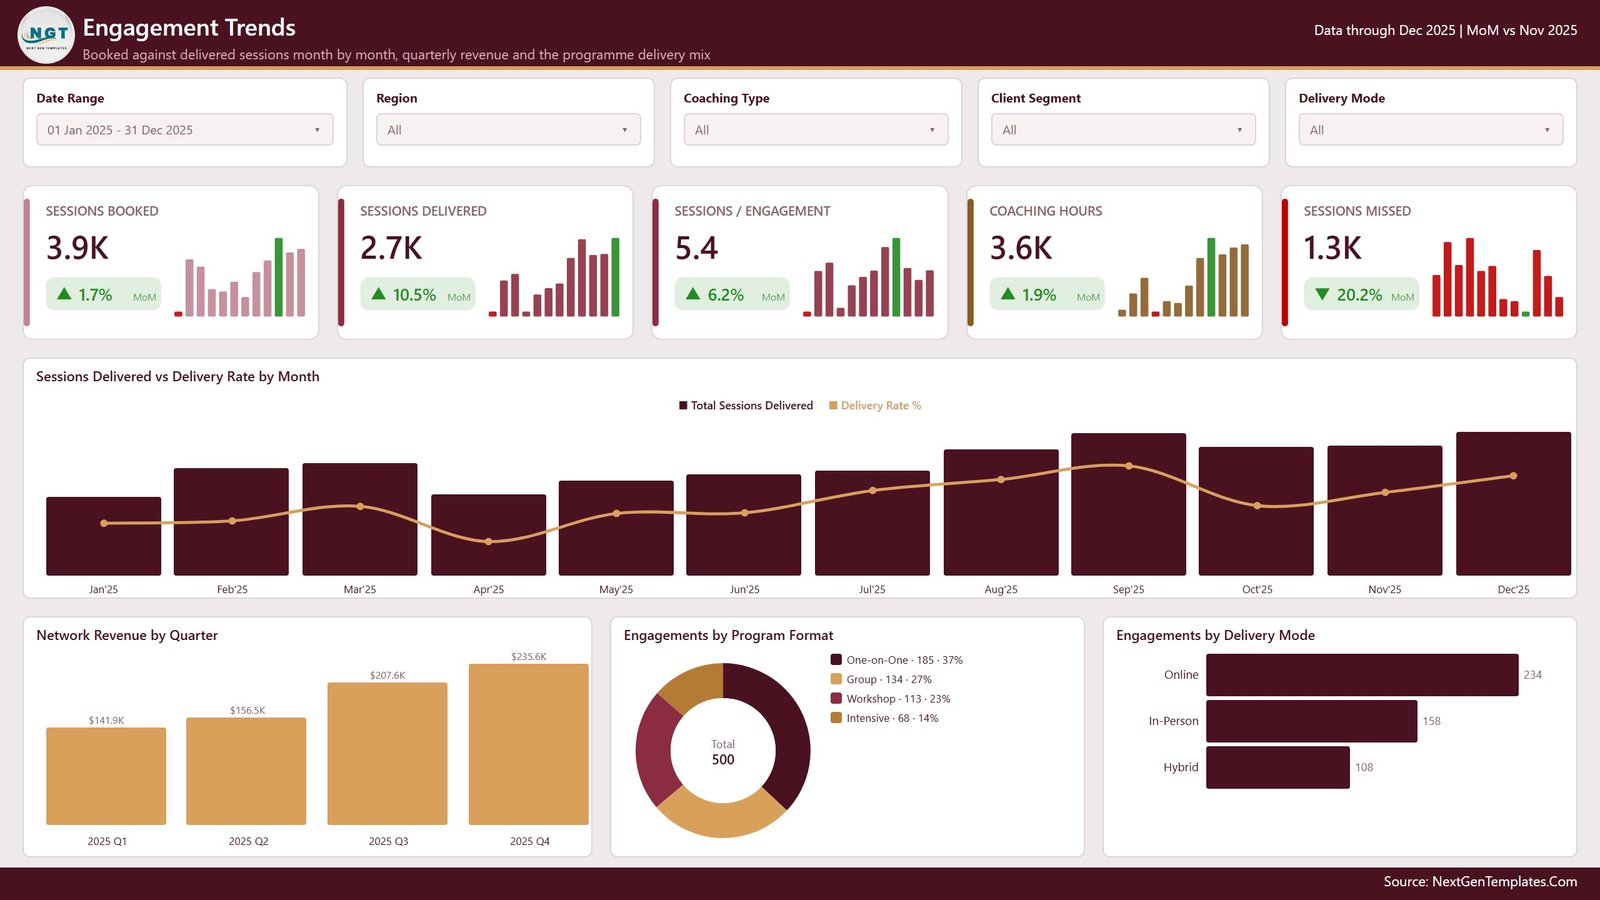
Page 2 – Engagement Trends
The delivery-gap page. Sessions Booked 3.9K, Sessions Delivered 2.7K, Sessions / Engagement 5.4, Coaching Hours 3.6K and Sessions Missed 1.3K sit above Sessions Delivered vs Delivery Rate by Month, Network Revenue by Quarter (Q1 $141.9K, Q2 $156.5K, Q3 $207.6K, Q4 $235.6K), Engagements by Program Format (One-on-One 185, Group 134, Workshop 113, Intensive 68) and Engagements by Delivery Mode (Online 234, In-Person 158, Hybrid 108).
Page 3 – Program Mix
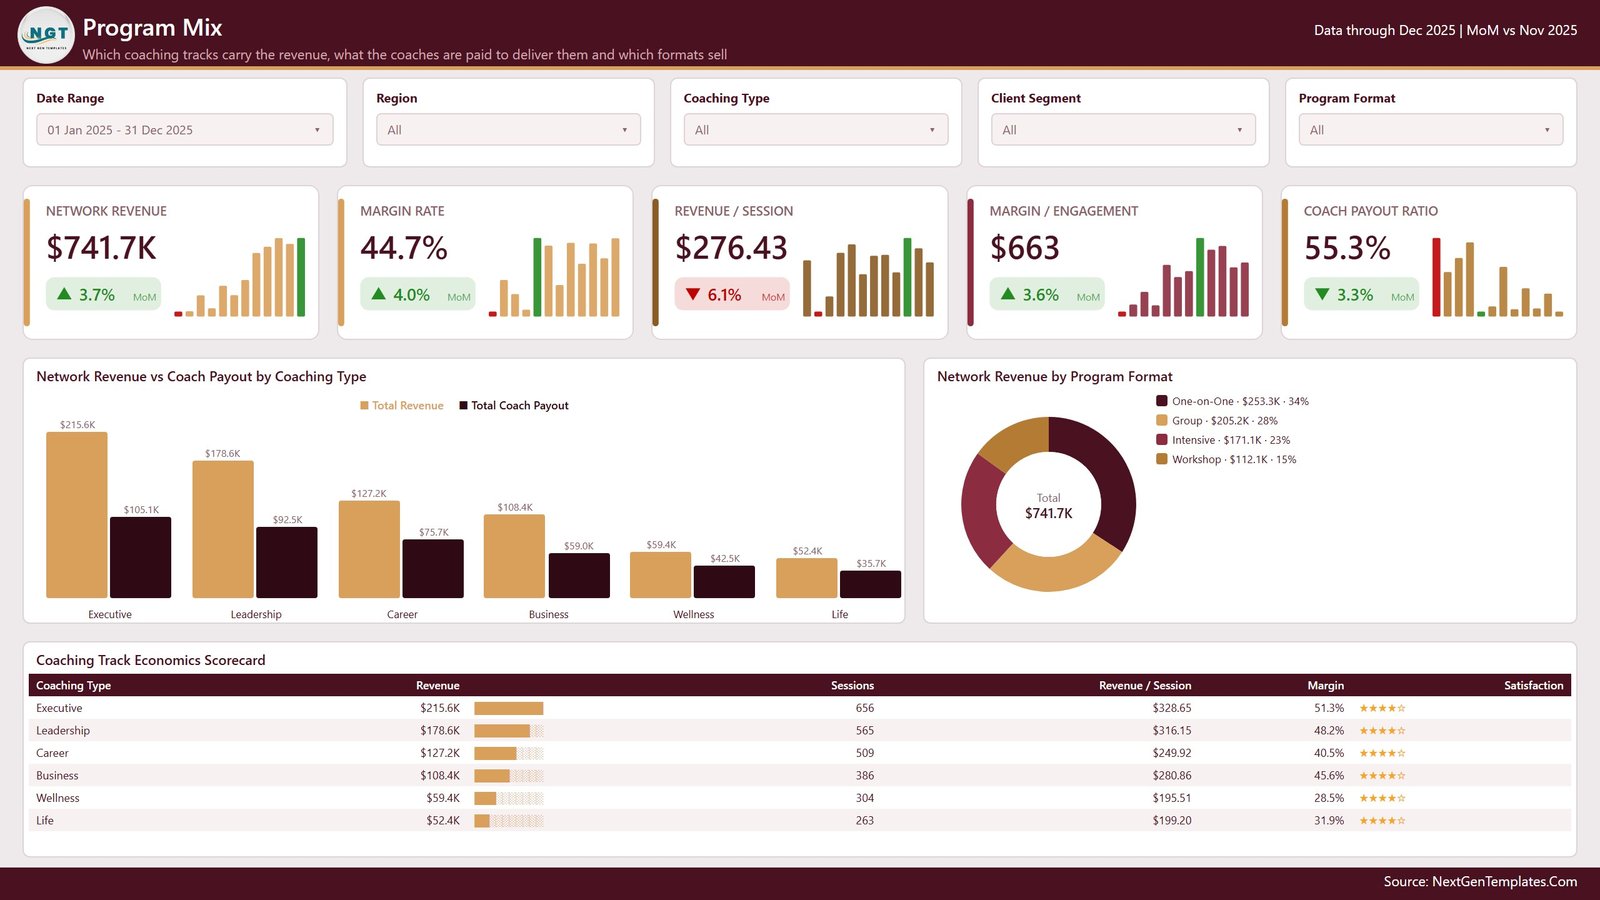
The economics page. Network Revenue $741.7K, Margin Rate 44.7%, Revenue / Session $276.43, Margin / Engagement $663 and Coach Payout Ratio 55.3%. Network Revenue vs Coach Payout by Coaching Type puts the two bars side by side for all six tracks, Network Revenue by Program Format splits One-on-One $253.3K, Group $205.2K, Intensive $171.1K and Workshop $112.1K, and the Coaching Track Economics Scorecard lists revenue, sessions, revenue per session, margin and satisfaction stars for each track – Executive at $328.65 per session and 51.3% margin against Wellness at $195.51 and 28.5%.
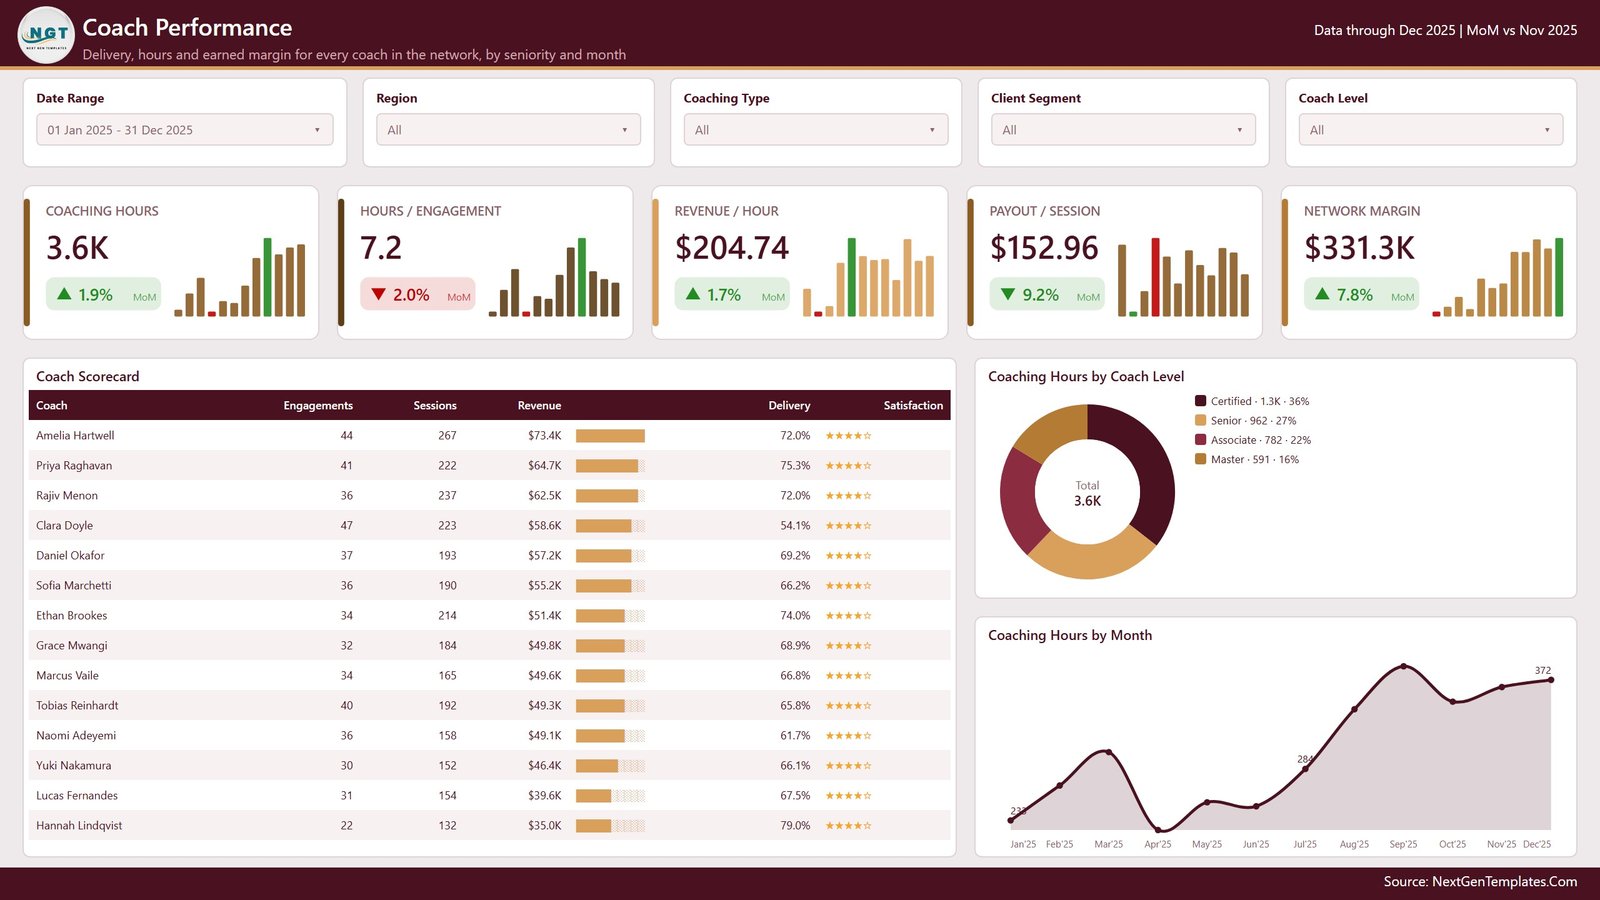
Page 4 – Coach Performance
The people page. Coaching Hours 3.6K, Hours / Engagement 7.2, Revenue / Hour $204.74, Payout / Session $152.96 and Network Margin $331.3K. The Coach Scorecard lists all 14 coaches with engagements, sessions, revenue, a revenue bar, delivery rate and satisfaction stars – Amelia Hartwell at $73.4K and 72.0% delivery, Hannah Lindqvist at $35.0K but the best delivery rate in the network at 79.0%. Beside it, Coaching Hours by Coach Level (Certified 1.3K, Senior 962, Associate 782, Master 591) and Coaching Hours by Month.
Page 5 – Client Outcomes
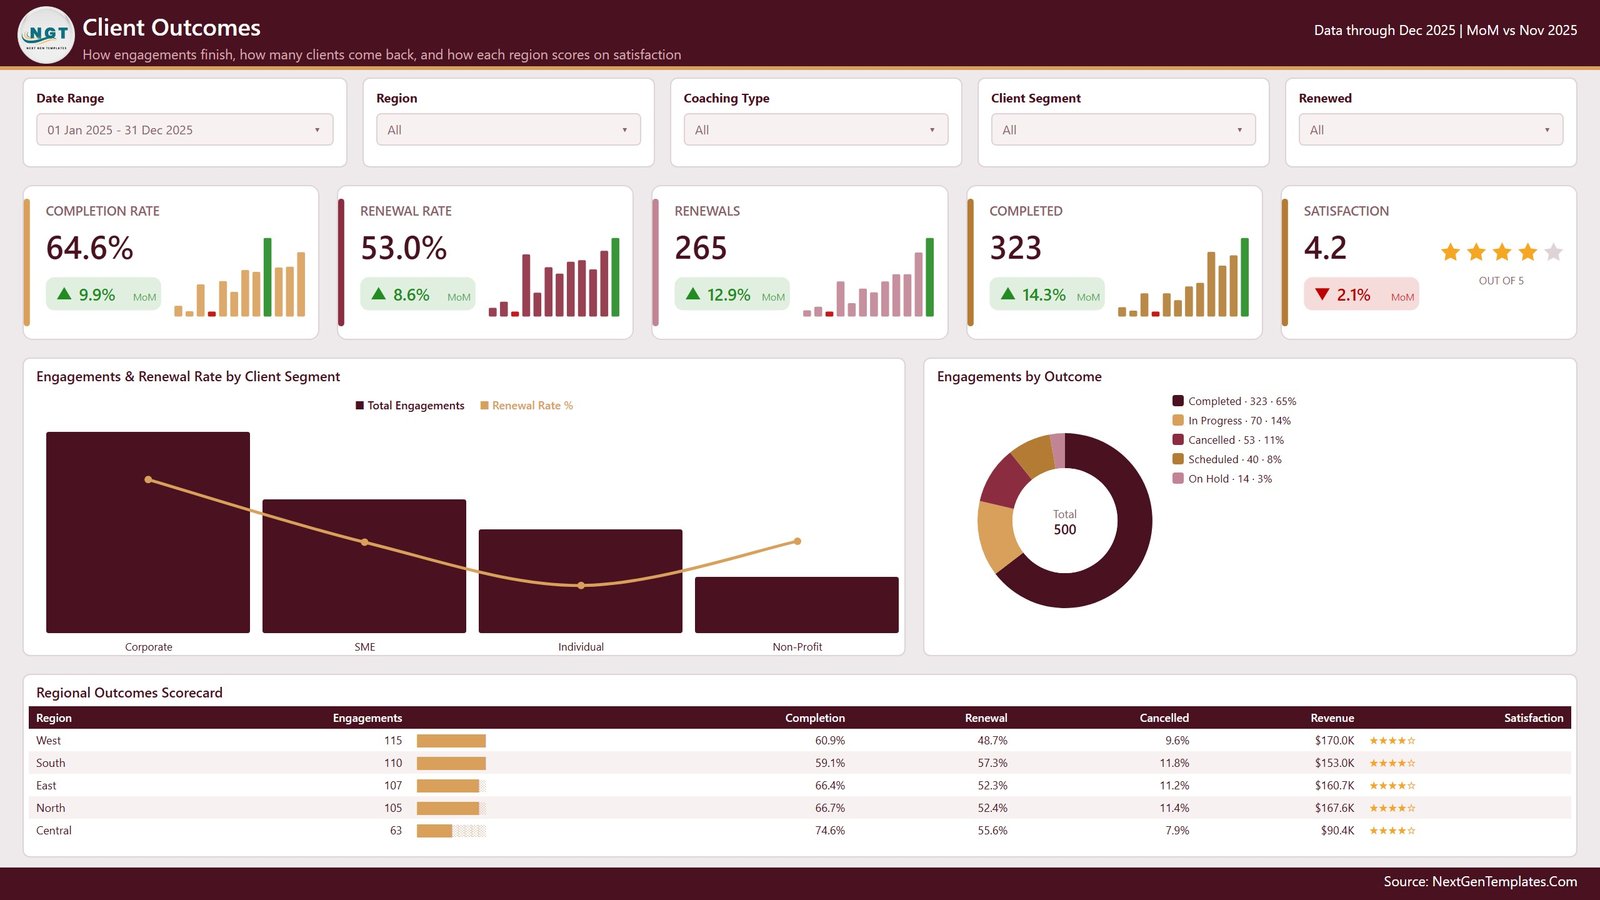
The retention page. Completion Rate 64.6%, Renewal Rate 53.0%, Renewals 265, Completed 323 and Satisfaction 4.2. Engagements & Renewal Rate by Client Segment pairs volume with renewal, Engagements by Outcome splits the 500 engagements into Completed 323, In Progress 70, Cancelled 53, Scheduled 40 and On Hold 14, and the Regional Outcomes Scorecard shows that Central runs the smallest book (63 engagements) at the highest completion rate (74.6%) and the lowest cancellation rate (7.9%).
Page 6 and the hidden pages
A Get More Dashboards page closes the report, and three pages are hidden in view mode: the nine-field Details drillthrough and the two tooltip pages.
Coaching Networks Dashboard in Power BI vs. Excel vs. Paid Coaching SaaS – Where This Fits
| This Power BI template | Excel dashboard | Paid coaching SaaS (CoachAccountable, Practice, Simply.Coach) | |
|---|---|---|---|
| Cost | One payment, no renewal | One payment, no renewal | Typically billed monthly per coach |
| Platform | Power BI Desktop (free) and Power BI Service | Microsoft Excel | Vendor web app |
| Setup time | Swap the source and refresh – under an hour | Paste data and refresh pivots | Onboarding, imports, coach accounts |
| Real-time team collaboration | Yes, once published to the Power BI Service | Via OneDrive or SharePoint co-authoring | Yes, built in |
| Mobile access | Power BI mobile app | Excel mobile | Native apps |
| Customisable fields | Yes – edit the model, measures and visuals | Yes | Limited to vendor fields |
| Share with a link | Yes, through the Power BI Service | Share the file | Yes |
| Year-1 cost at 5 users | The price on this page, once | The price of the Excel twin, once | Recurring per-coach fees |
| Books sessions and invoices clients | No – reporting only | No | Yes |
| Coach-level league table out of the box | Yes – 14 coaches ranked | Yes – top 10 by revenue | Varies by plan |
Who This Template Is For – and Who It’s Not For
It fits a coaching network, a coaching franchise, an executive-coaching practice with associates, a leadership-development firm, an L&D function that buys coaching by the track, or a training business that pays coaches a share of the fee and needs to see the margin that leaves.
It does not fit a solo coach with a dozen clients – a spreadsheet is faster. It is not a booking, invoicing, CRM or session-notes system. It does not connect to Calendly, Stripe, a coaching platform or an HRIS on its own; you point it at whatever export you already produce. And it makes no claim about coaching efficacy, accreditation or outcomes: it reports what you record, nothing more.
How to Use the Coaching Networks Dashboard in Power BI
- Unzip and open. Open the .pbix in Power BI Desktop (free from Microsoft). Explore the five pages with the shipped 500-row demo data first.
- Look at the source shape. Data.xlsx in the same zip holds the 17 columns the model expects, one row per engagement.
- Point it at your own export. In Transform data, change the source path to your file. Keep the column names and the report needs no other edit.
- Rename the labels that are yours. Coaching Type, Program Format, Delivery Mode, Client Segment, Coach Level and Region are plain text – swap Executive/Leadership/Career for your own track names.
- Refresh and check the cards. Every KPI, chart, scorecard and tooltip recalculates from the measures; nothing is hard-coded.
- Use the drillthrough. Right-click a coach in the scorecard or a slice in any donut and choose Drillthrough to open the Details page for that slice.
- Publish if you want to share. Publish to the Power BI Service to give the network a link instead of a file.
Real-World Use Cases
Ravi, network operations lead at a 14-coach executive practice. He opens Coach Performance on the first Monday of the month, sorts by delivery rate, and takes the two coaches below 60% into a capacity conversation – Clara Doyle carries the most engagements at 47 but the lowest delivery rate at 54.1%, which is a scheduling problem, not a skill problem.
Meera, commercial director at a leadership-development firm. She lives on Program Mix. Wellness sells 304 sessions but returns 28.5% margin against Executive’s 51.3%, so the pricing review starts with Wellness rather than with a blanket rate rise.
Tom, client-success manager for a corporate coaching supplier. He runs Client Outcomes with the Renewed slicer, notices Central completes 74.6% of engagements and renews 55.6% on the smallest book, and copies whatever Central does into the West playbook, where completion sits at 60.9%.
Frequently Asked Questions
Do I need a paid Power BI licence?
No. Power BI Desktop is free from Microsoft and opens the .pbix, refreshes it and lets you edit everything. A licence is only needed to publish to the Power BI Service and share with colleagues.
Does this connect to my coaching platform, calendar or payment provider?
No. It reads a file with the 17 columns shown above. If your platform can export that shape – most can – the refresh takes seconds; there is no live connector in the package.
Is this the same as the KPI scorecard dashboards?
No. Those are month-picker scorecards with traffic lights and a KPI definition page. This is the analytical line: five pages of trend, mix and league-table analysis with a drillthrough. Different template, different job.
How is it different from the Excel version?
The Coaching Networks Dashboard in Excel is the same subject built on pivot tables and slicers for people who live in Excel. This Power BI build adds the drillthrough, hover tooltips and Power BI Service sharing. Buy whichever platform your team already uses – or both, if the finance team is on Excel and the leadership team is on Power BI.
Can I change the coaching tracks, coach names and regions?
Yes. Every one of them is a text column in the source. Replace the demo values and the visuals relabel themselves; no measure references a specific track or coach by name.
Are the numbers on the screenshots real?
They come from the 500 rows of demo data shipped in the zip – realistic, internally consistent, and entirely invented. Nothing in this template is a benchmark, an industry average or a target you should hit.
How many times can I use it?
As many as you like, on unlimited projects and clients. It is a one-time download with no renewal and no seat count.
About the Author
Built by PK – Microsoft Certified Professional with 15+ years of Excel, Google Sheets, and Power BI experience. Founder of NextGenTemplates, reaching 300K+ subscribers across YouTube channels. Every template is hand-built and tested before release.
Explore Related Templates
- Coaching Networks Dashboard in Excel – the same five-topic build for Excel users.
- Coaching Business Dashboard in Power BI – an earlier, single-practice take on coaching analytics.
- Professional Training & Coaching Dashboard in Power BI – training delivery alongside coaching.
- Career Mentorship Platforms Dashboard in Power BI – mentor matching and programme outcomes.
- Career Counseling Centers Dashboard in Power BI – counsellor caseload and placement reporting.
- Browse every Power BI dashboard template or the wider Power BI category.
Download the Coaching Networks Dashboard in Power BI now – the .pbix, the 500-row demo source and the user manual arrive the moment you check out. One payment, unlimited reuse, no subscription.
Last updated: 20 August 2026.












Reviews
There are no reviews yet.