

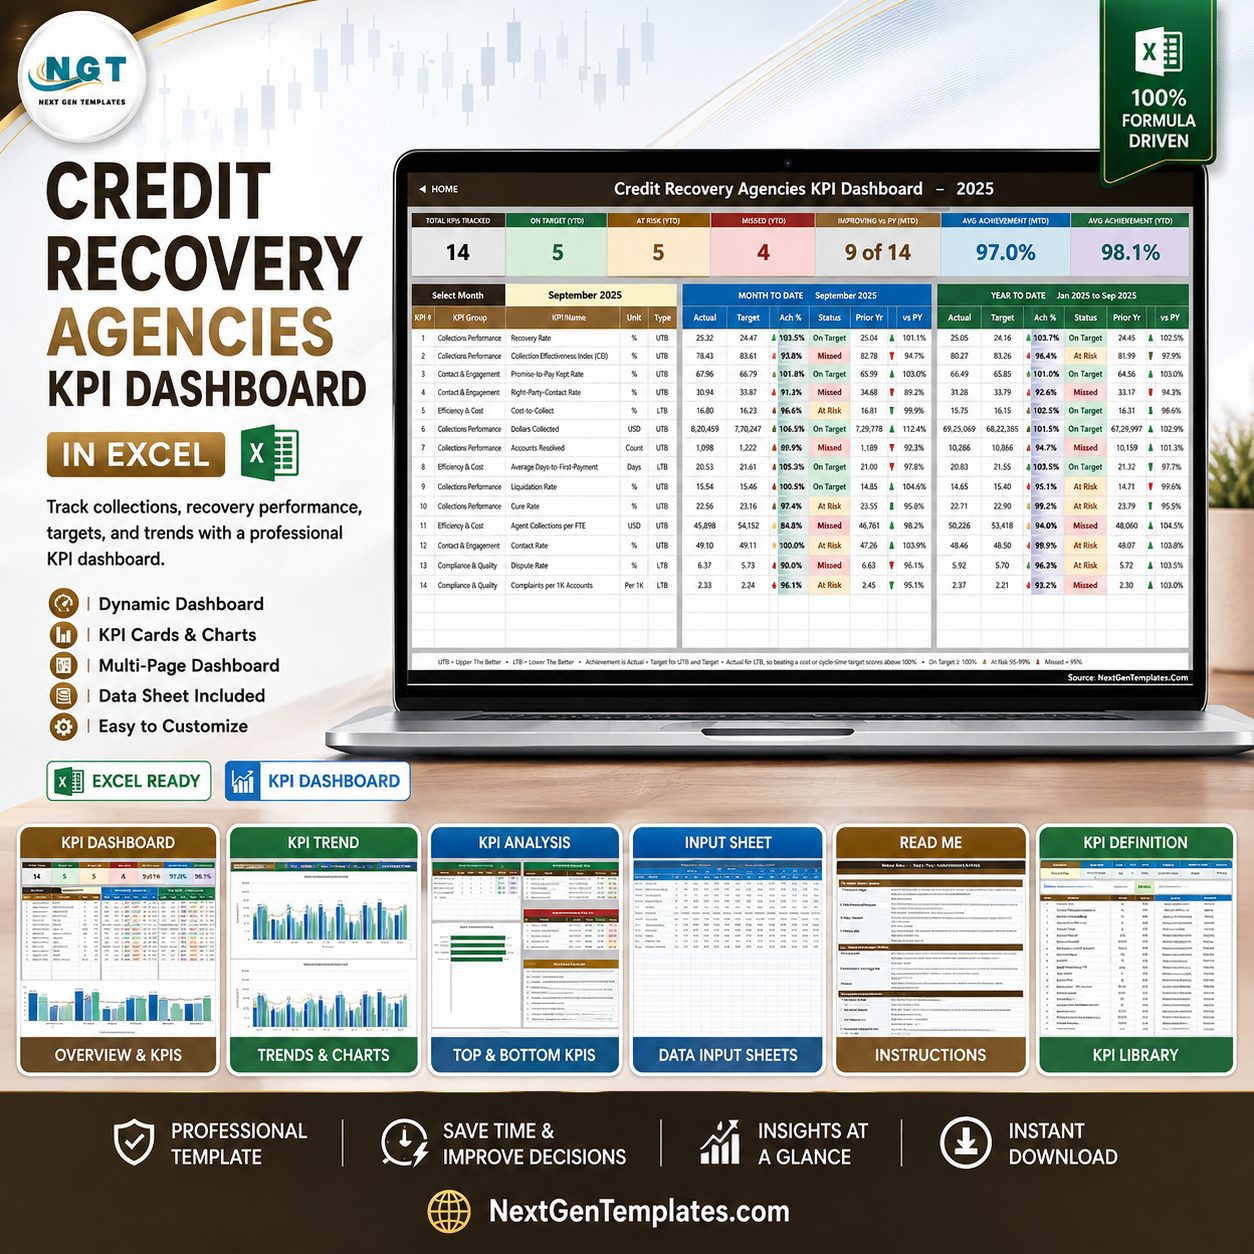
Collections leaders spend the first week of every month rebuilding the same board pack. Recovery rate, CEI, promises kept, right-party contact, cost-to-collect, complaints – each one pulled from a different report, pasted into a different tab, then coloured by hand so somebody can tell at a glance which numbers are fine and which are not. The Credit Recovery Agencies KPI Dashboard in Excel replaces that with one workbook and one dropdown.
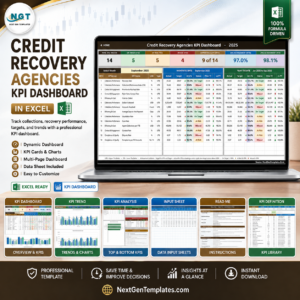
It is a KPI scorecard: a month picker, a fourteen-row scorecard with traffic lights, a trend page for one KPI at a time, and an analysis page that rolls achievement up by KPI group. Every figure it shows is a figure you typed on one of three input sheets. It runs on plain worksheet formulas – VLOOKUP, MATCH, INDEX, COUNTIF – so it opens in Excel 2013 and later, and in Excel for the web, with nothing to install and no refresh step.
Key Features
- One month dropdown drives everything. Cell D6 on the KPI Dashboard sheet is a list of the twelve months of your reporting year. Pick one and the scorecard, the summary cards and the whole KPI Analysis page re-read against it.
- 14 credit-recovery KPIs across four groups – Collections Performance, Contact & Engagement, Efficiency & Cost, and Compliance & Quality.
- MTD and YTD side by side for every KPI: actual, target, achievement %, status and prior year, with a year-on-year movement arrow on each.
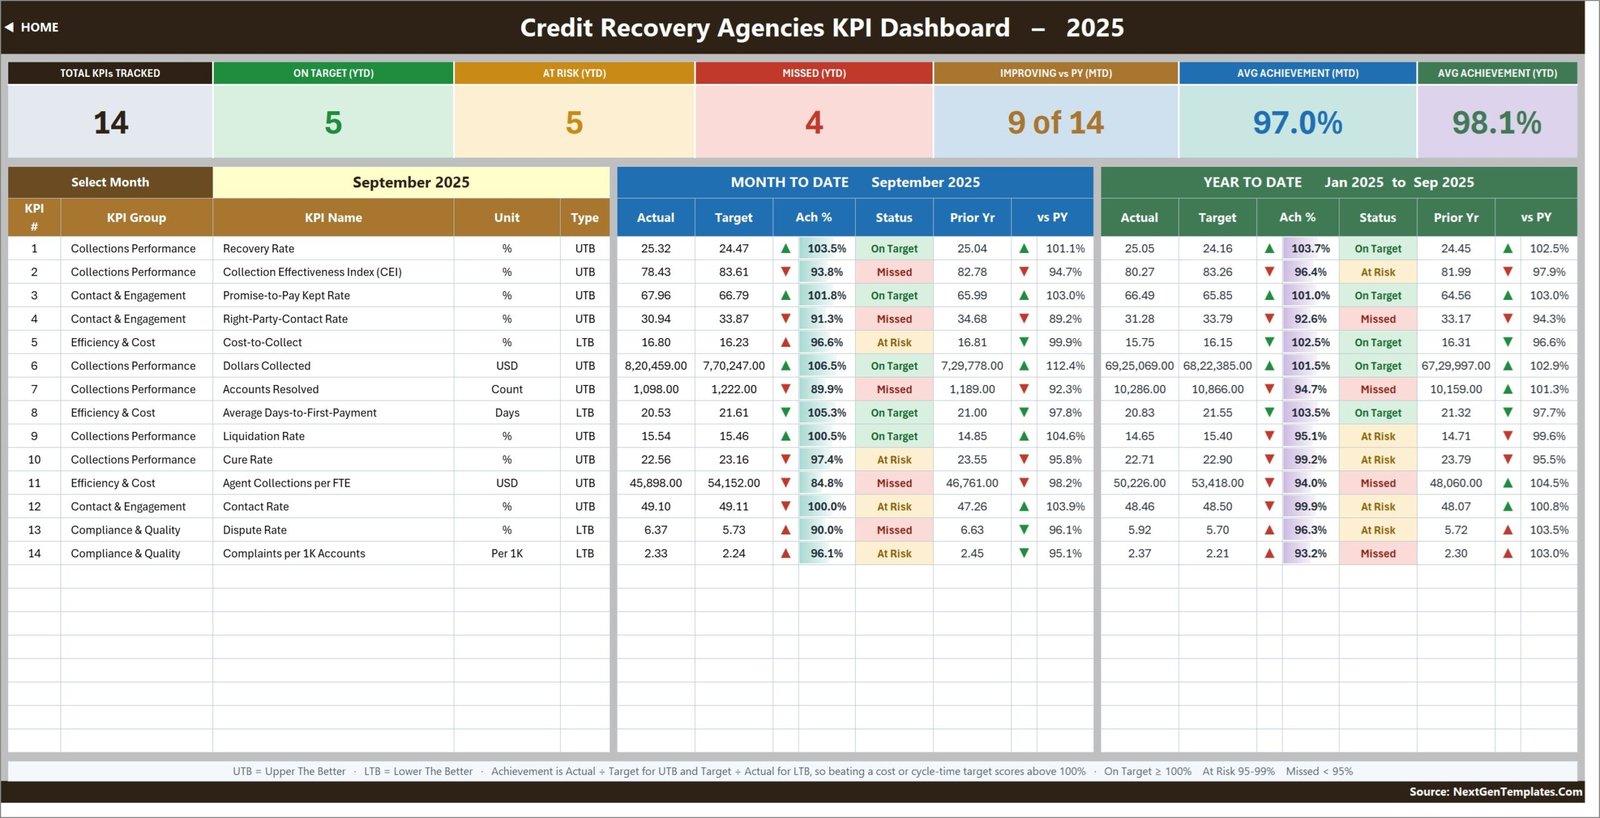
- Direction-aware scoring. Each KPI is flagged UTB (upper the better) or LTB (lower the better). Achievement is Actual divided by Target for a UTB KPI and Target divided by Actual for an LTB one, so beating a cost or cycle-time target scores above 100% instead of looking like a miss.
- Traffic lights you can re-tune. On Target from 100%, At Risk 95-99%, Missed below 95%. The thresholds sit in the formulas in columns L and U on the KPI Dashboard sheet – edit them to match your own governance.
- Seven summary cards across the top of the scorecard: Total KPIs Tracked, On Target (YTD), At Risk (YTD), Missed (YTD), Improving vs PY (MTD), Avg Achievement (MTD) and Avg Achievement (YTD).
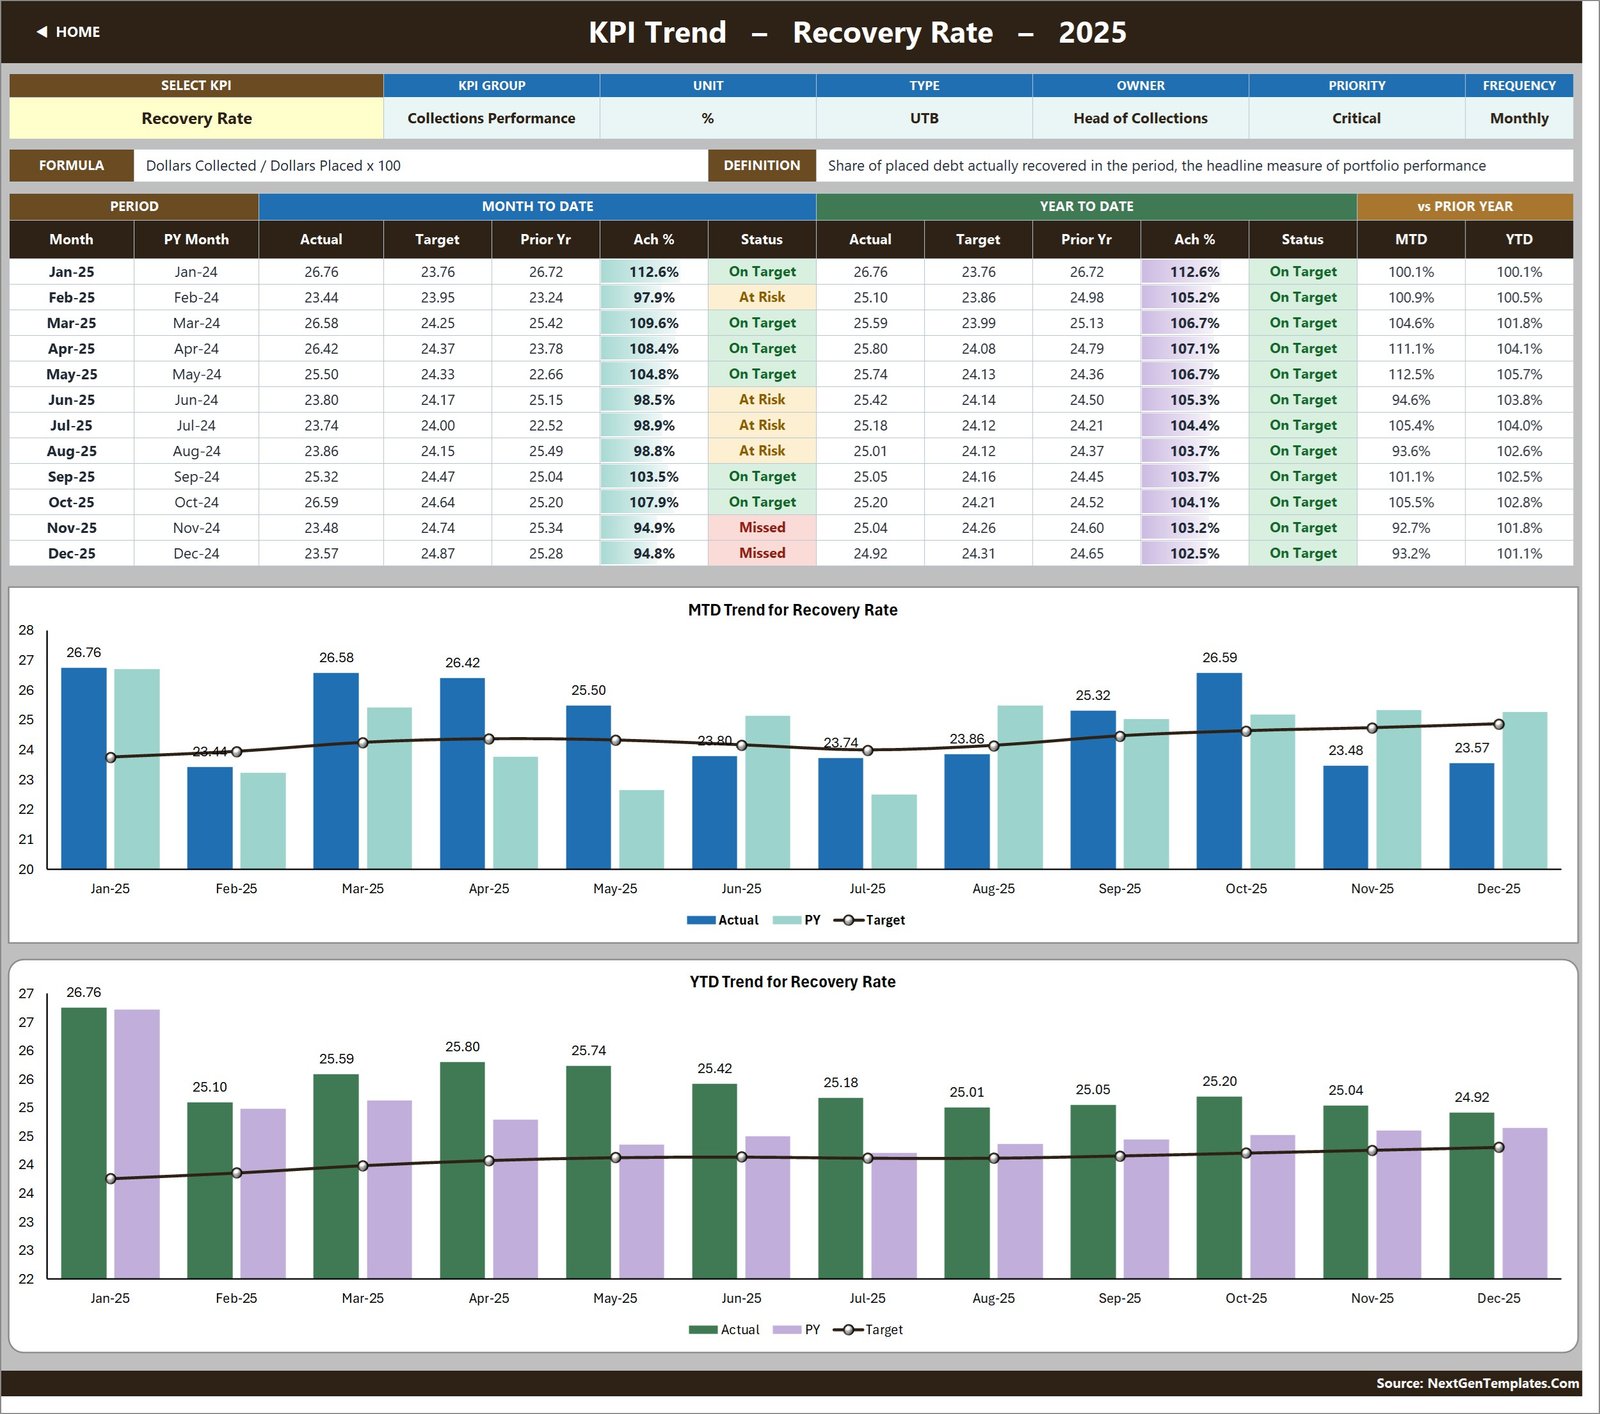
- A trend page per KPI. Pick any KPI in cell B4 on KPI Trend and its attribute strip, formula, definition, twelve-month table and both combo charts redraw for that KPI.
- Add or rename KPIs without touching a formula. The sheets are wired for 22 KPIs; 14 are filled in and the rest are live and empty. Type a new KPI on KPI Definition and it flows through the three input sheets, the scorecard, the trend page and the analysis page.
- Nothing hidden, nothing locked. Every sheet, formula and chart is open and editable.
Every Page in the Workbook
1. Home
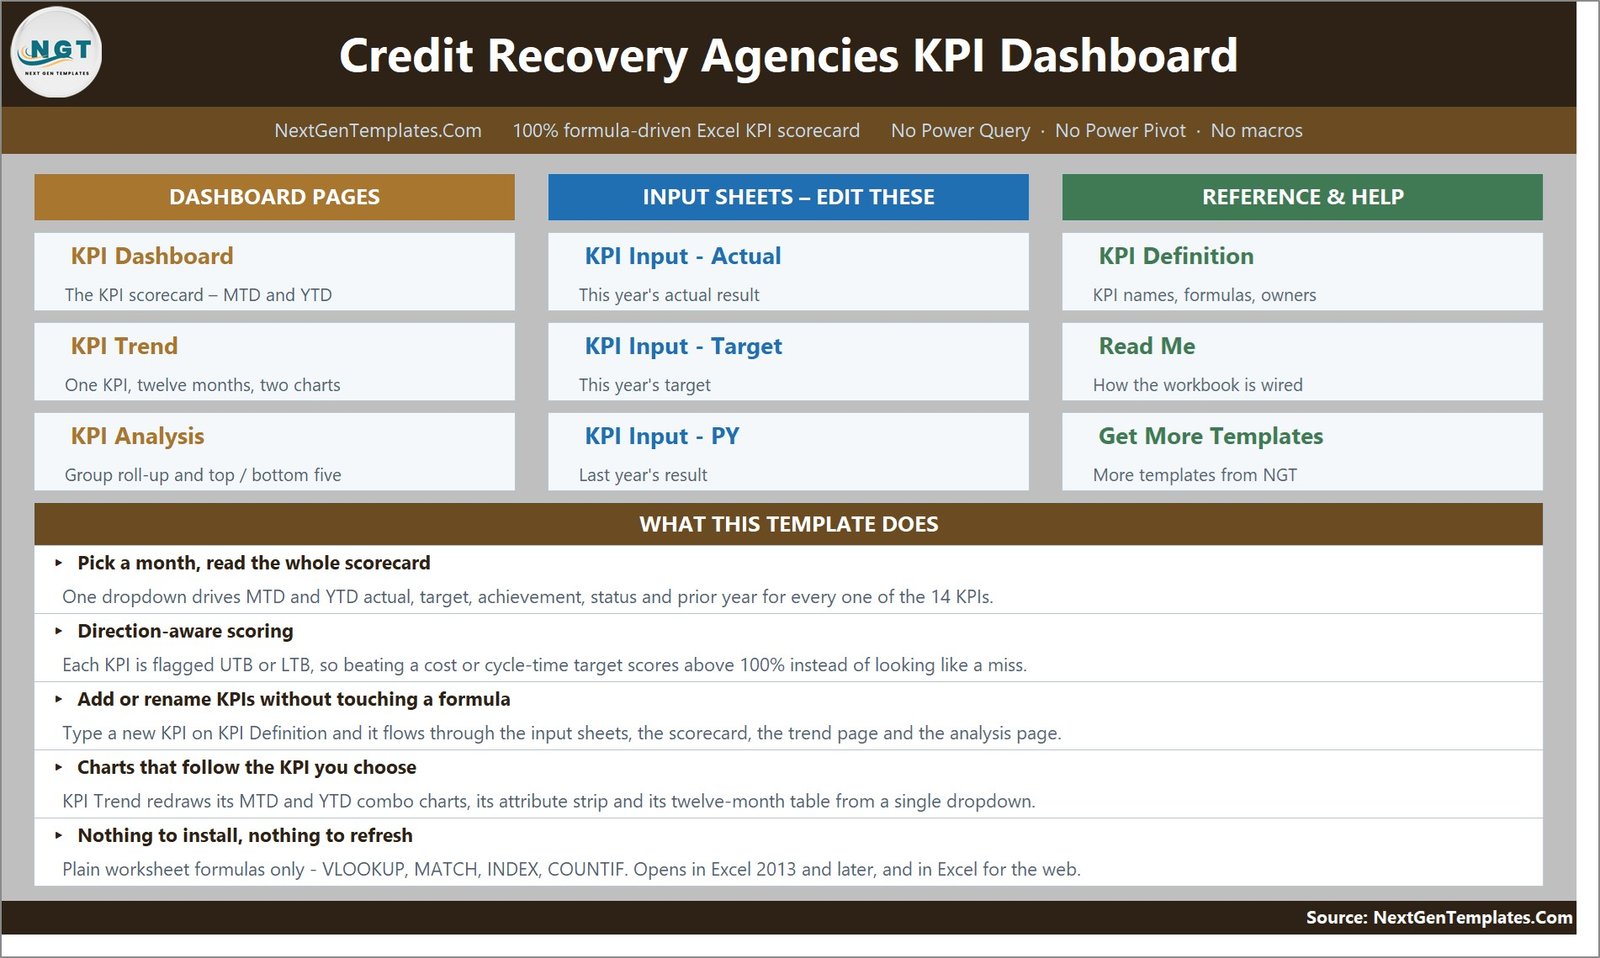
A navigation page. Three tiles blocks – Dashboard Pages, Input Sheets and Reference & Help – each hyperlinked to the sheet it names, with a one-line summary of what that sheet does. Underneath, a “What This Template Does” panel states the five things the workbook is built to do.
2. KPI Dashboard – the scorecard
The main page. Seven summary cards, a Select Month dropdown, then one row per KPI showing KPI number, KPI group, KPI name, unit and type, followed by a MONTH TO DATE block (actual, target, achievement %, status, prior year, vs PY) and a YEAR TO DATE block with the same six columns. Status cells are colour-filled green, amber or red, and every comparison carries a direction arrow whose colour reflects whether that direction is good for that particular KPI.
3. KPI Trend – one KPI, twelve months
Choose a KPI in cell B4. The page shows its group, unit, type, owner, priority and frequency, then its formula and definition in full, then a twelve-month table with MTD actual, target, prior year, achievement % and status alongside the YTD equivalents and month-on-month vs prior year. Two charts sit underneath, titled from the KPI you picked: MTD Trend for [selected KPI] and YTD Trend for [selected KPI]. Both are combo charts – actual and prior-year columns with a target line over the top.
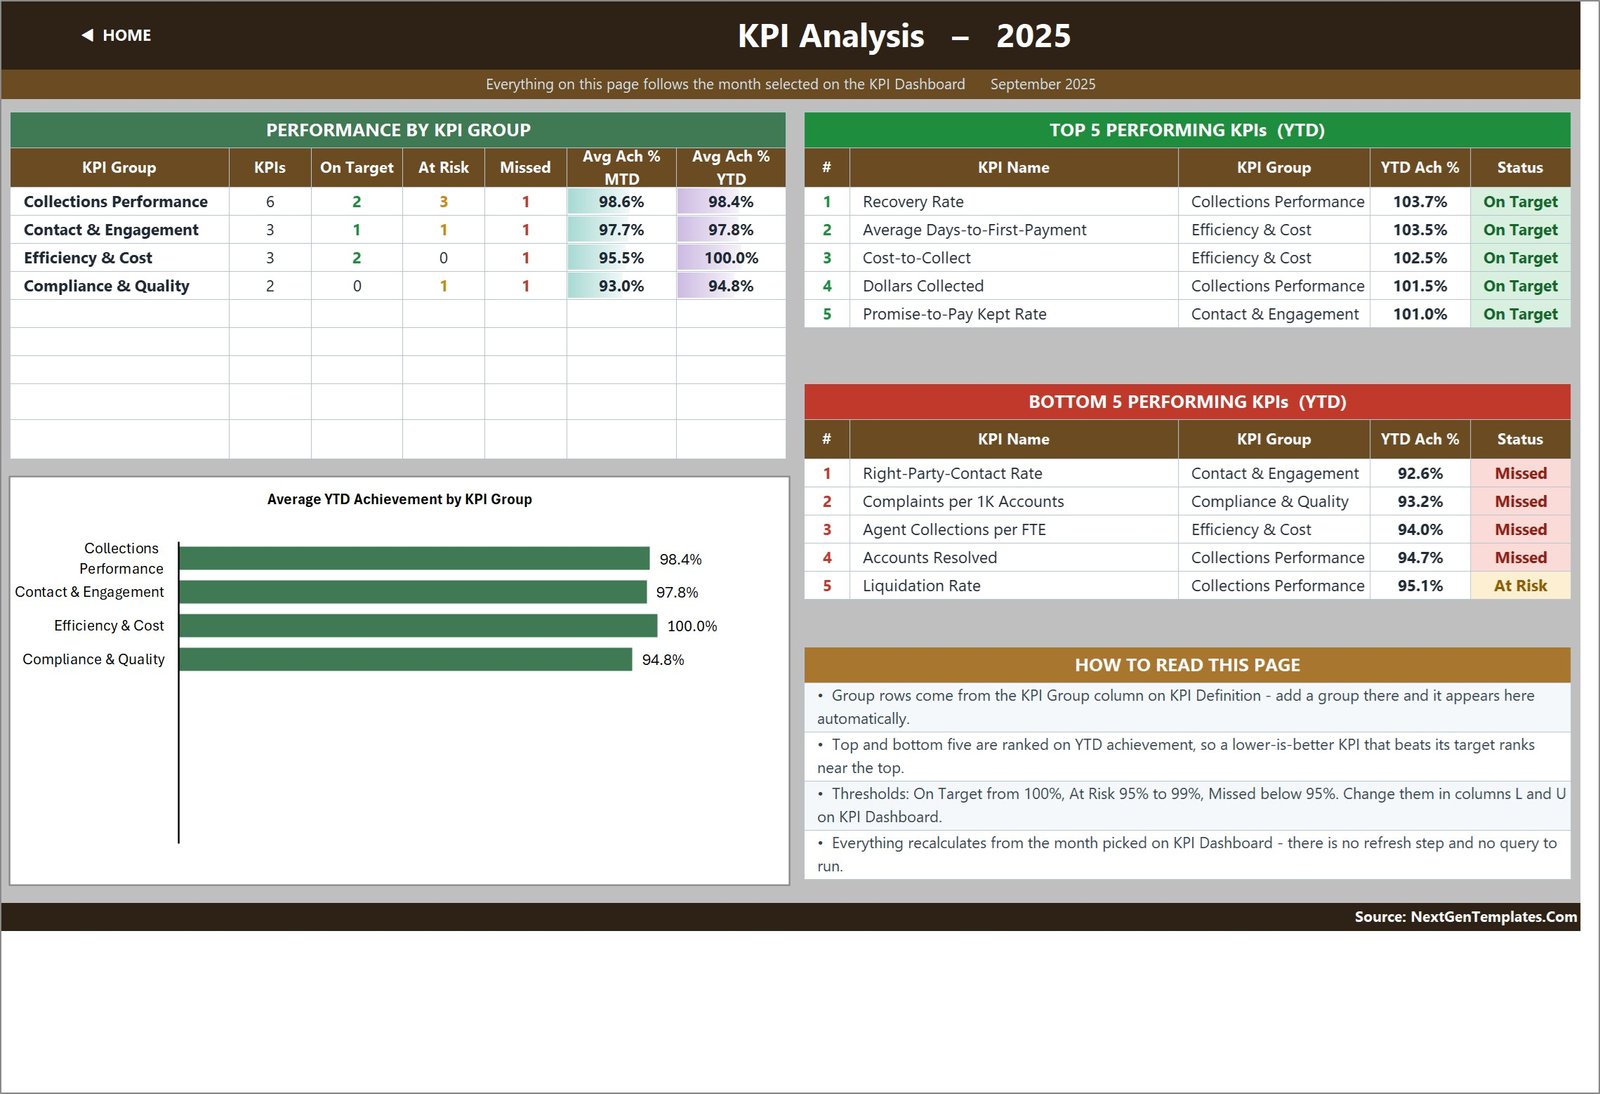
4. KPI Analysis – group roll-up and rankings
Follows the same month as the scorecard. A Performance by KPI Group table counts KPIs, On Target, At Risk and Missed per group with average achievement for MTD and YTD, and feeds a bar chart titled Average YTD Achievement by KPI Group. To the right, Top 5 Performing KPIs (YTD) and Bottom 5 Performing KPIs (YTD) rank every KPI on YTD achievement, so a lower-is-better KPI that beats its target ranks near the top exactly as it should. A How to Read This Page panel explains the ranking and the thresholds.
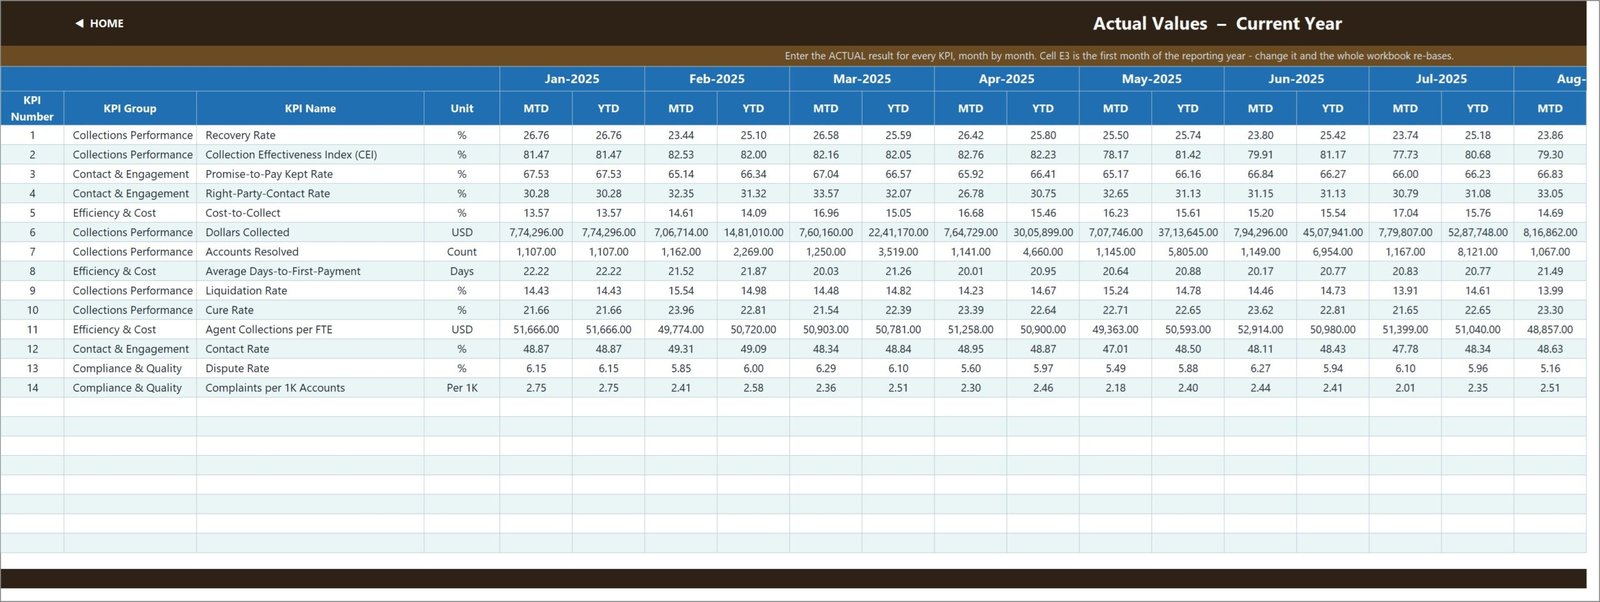
5. KPI Input – Actual
This year’s results. One row per KPI, one MTD and one YTD column per month, January through December. Cell E3 is the first month of the reporting year – change it and the Target sheet, the Prior Year sheet, the month dropdown and every sheet title re-base automatically.
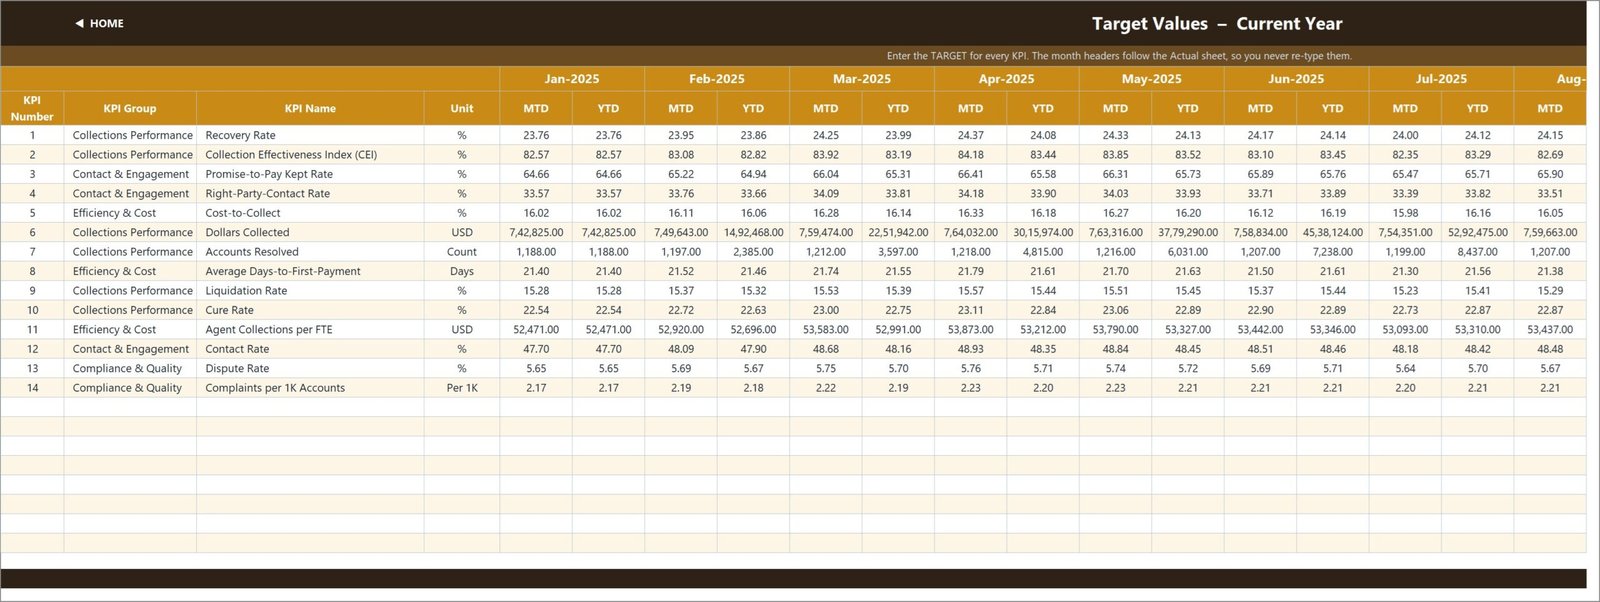
6. KPI Input – Target
The same grid for targets. Month headers follow the Actual sheet, so you never re-type them.
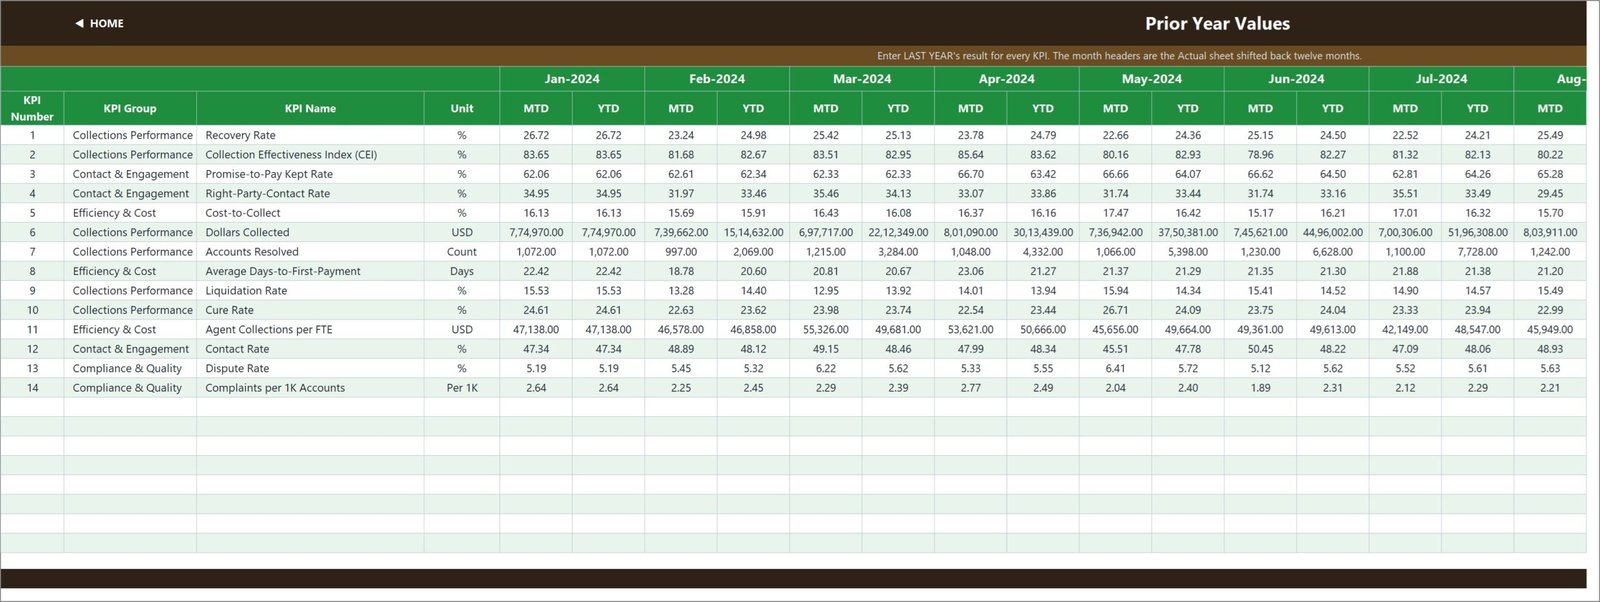
7. KPI Input – PY
Last year’s results, for the prior-year and vs-PY columns. Month headers are the Actual sheet shifted back twelve months.
8. KPI Definition – the master list
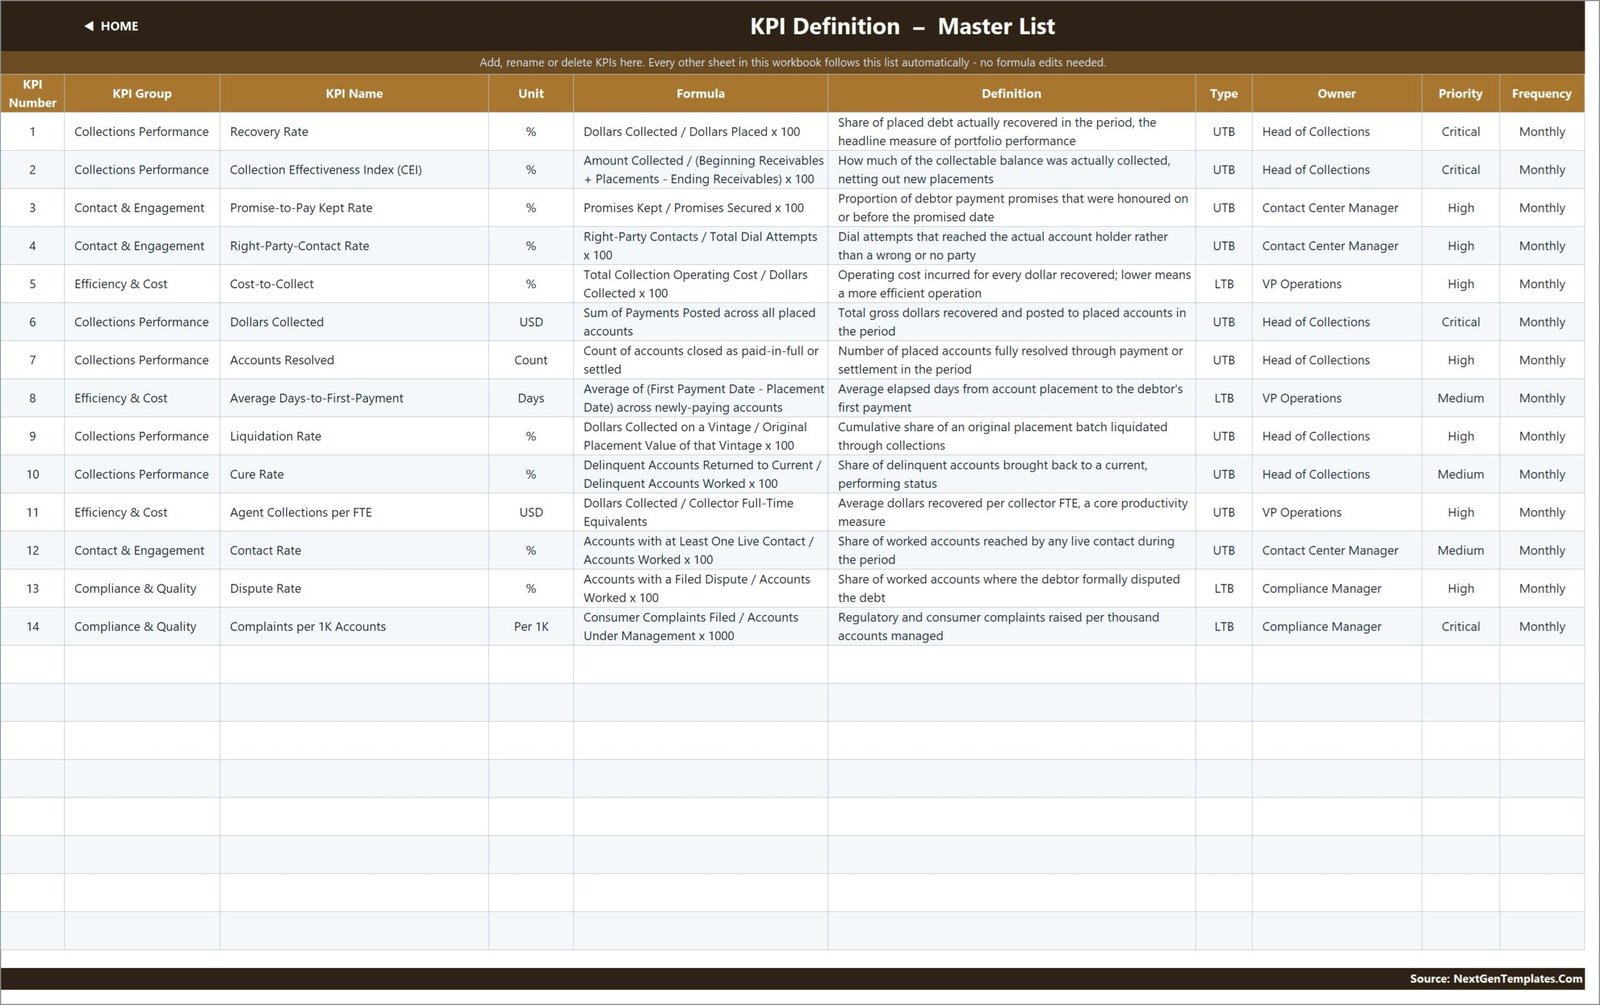
The sheet everything else follows. Nine columns per KPI: number, group, name, unit, formula, definition, type (UTB or LTB), owner, priority and frequency. Add, rename or delete a KPI here and every other sheet picks it up.
9. Read Me
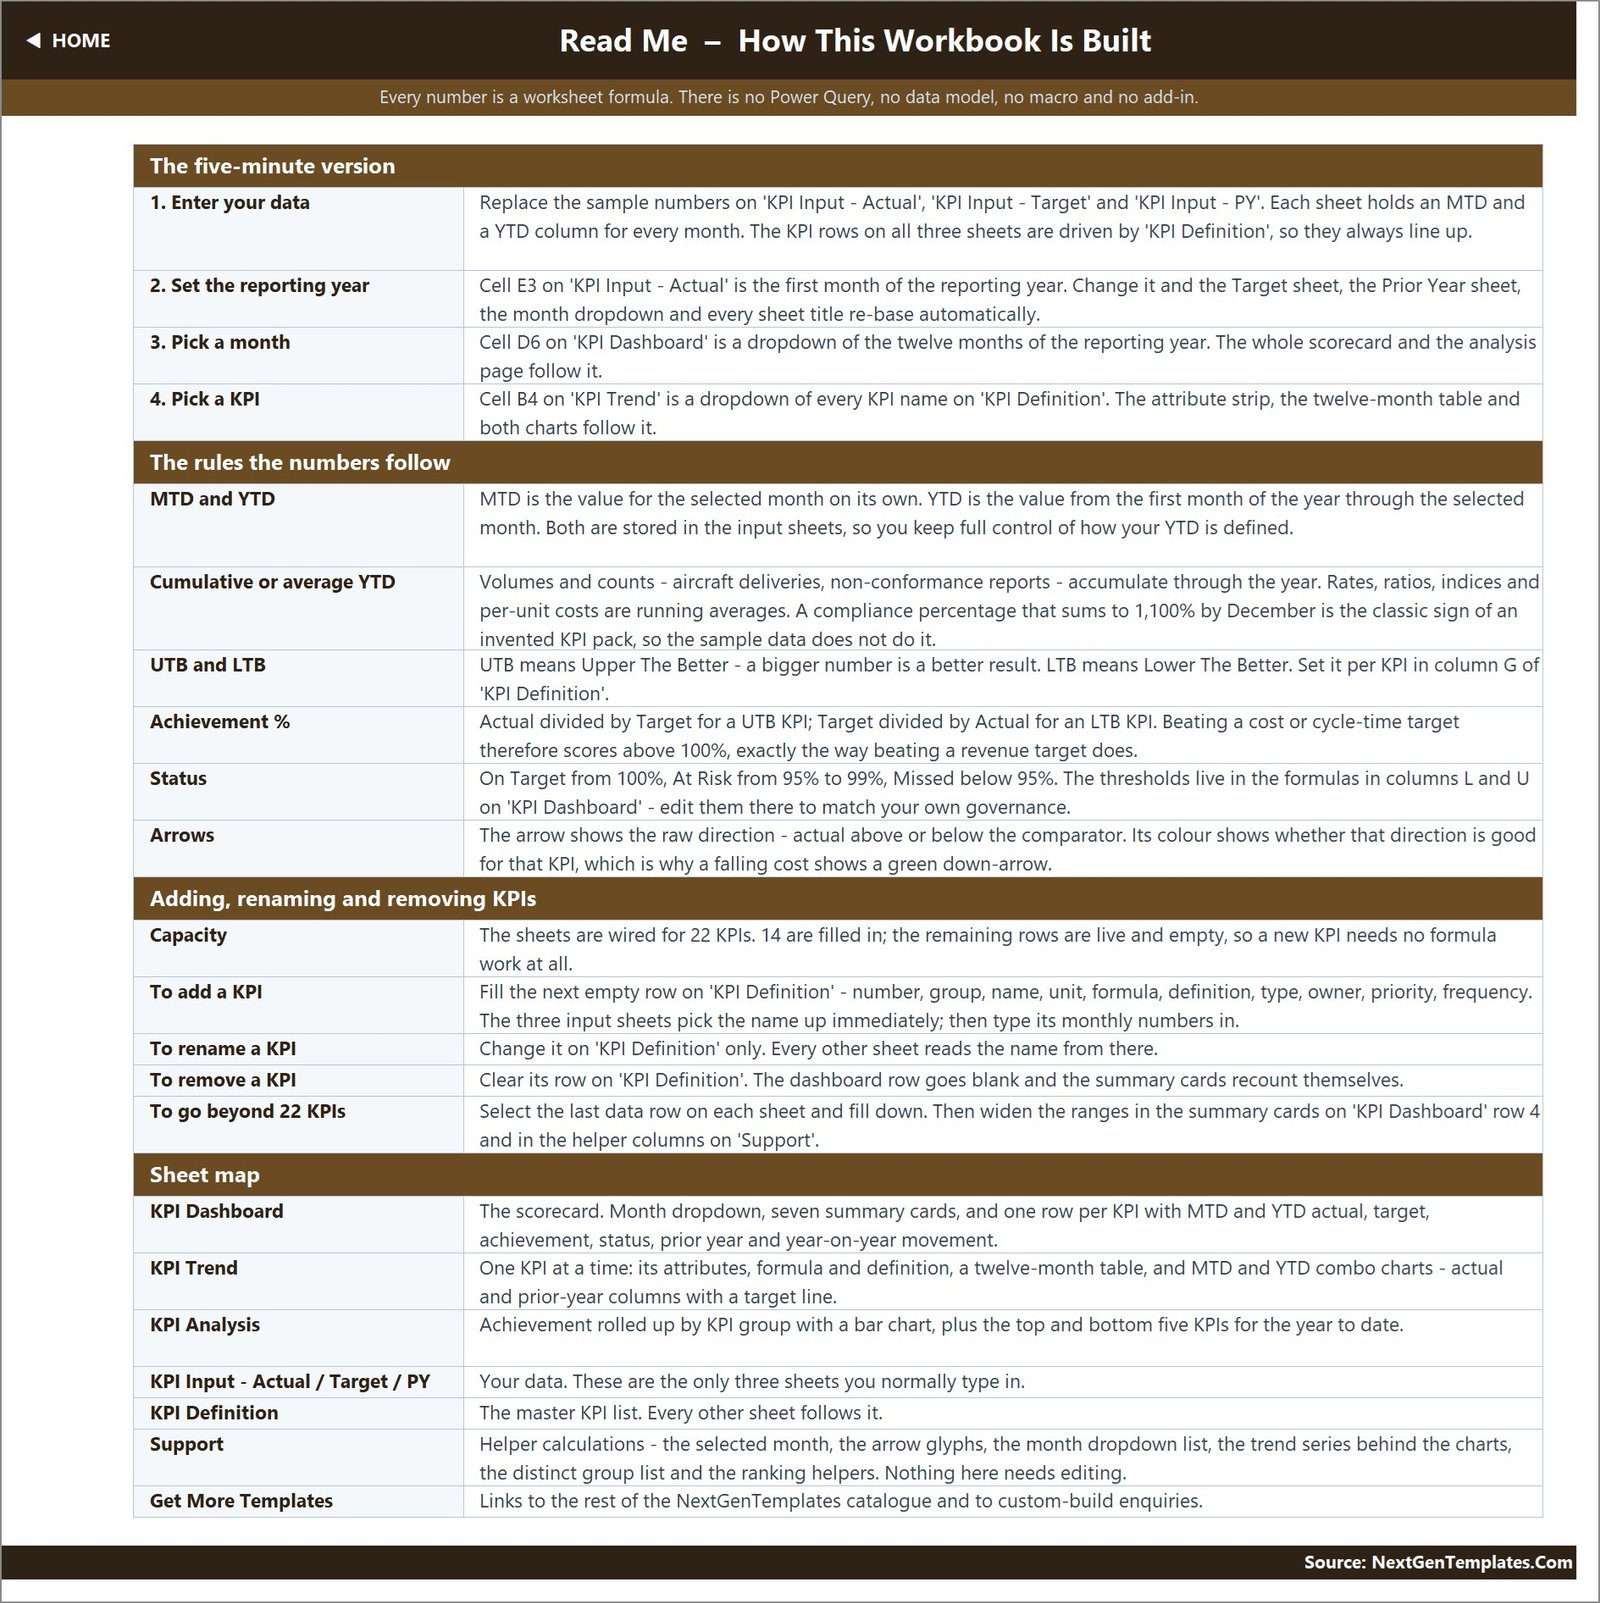
A written explanation of how the workbook is wired: the five-minute setup, the rules the numbers follow (MTD vs YTD, cumulative vs average YTD, UTB and LTB, achievement, status, arrows), how to add, rename, remove or go beyond 22 KPIs, and a sheet-by-sheet map.
10. Get More Templates
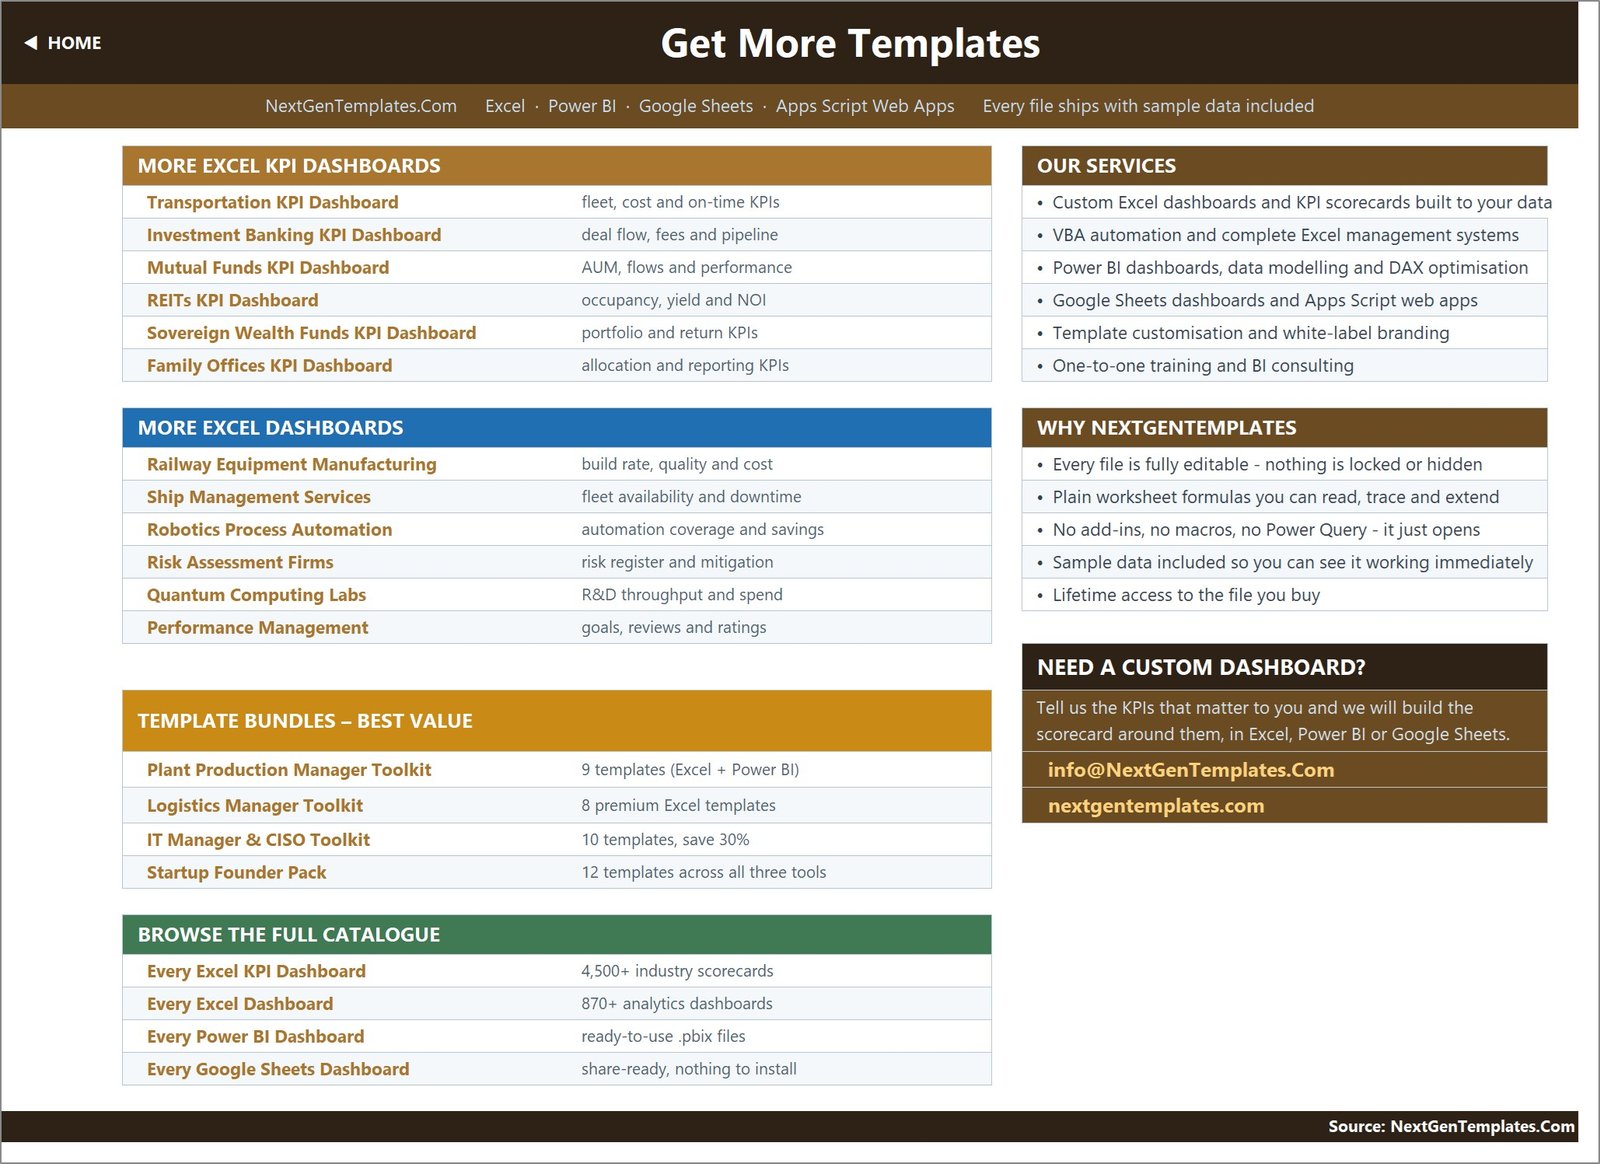
An in-workbook catalogue page from NextGenTemplates – links to other Excel KPI dashboards, other Excel dashboards, template bundles and the full catalogue, plus a note on custom builds. It is a marketing page, included here so you can see exactly what ships in the file rather than finding it after purchase.
The 14 KPIs That Ship in the File
All fourteen are pre-loaded with a name, group, unit, formula, definition, direction, owner, priority and frequency. Rename any of them on KPI Definition to match your own vocabulary.
| # | KPI | Group | Unit | Direction |
|---|---|---|---|---|
| 1 | Recovery Rate | Collections Performance | % | UTB |
| 2 | Collection Effectiveness Index (CEI) | Collections Performance | % | UTB |
| 3 | Promise-to-Pay Kept Rate | Contact & Engagement | % | UTB |
| 4 | Right-Party-Contact Rate | Contact & Engagement | % | UTB |
| 5 | Cost-to-Collect | Efficiency & Cost | % | LTB |
| 6 | Dollars Collected | Collections Performance | USD | UTB |
| 7 | Accounts Resolved | Collections Performance | Count | UTB |
| 8 | Average Days-to-First-Payment | Efficiency & Cost | Days | LTB |
| 9 | Liquidation Rate | Collections Performance | % | UTB |
| 10 | Cure Rate | Collections Performance | % | UTB |
| 11 | Agent Collections per FTE | Efficiency & Cost | USD | UTB |
| 12 | Contact Rate | Contact & Engagement | % | UTB |
| 13 | Dispute Rate | Compliance & Quality | % | LTB |
| 14 | Complaints per 1K Accounts | Compliance & Quality | Per 1K | LTB |
Scorecard or Analytical Dashboard – Which One Is This?
NextGenTemplates sells two different families of dashboard and the names look alike. This one is the scorecard. Use the table to be sure you are buying the one you want.
| This template – KPI Scorecard | An analytical dashboard | |
|---|---|---|
| What you feed it | One MTD and one YTD number per KPI per month, typed on three input sheets | A transaction-level table of hundreds or thousands of rows |
| Main control | A month dropdown, plus a KPI dropdown on the trend page | Slicers on region, category, date and so on |
| Main view | A table of KPIs with achievement % and traffic lights | Charts, KPI cards and pivot-driven visuals |
| Question it answers | Are we hitting our targets this month and year to date? | What is driving the numbers, and where? |
| Engine | Plain worksheet formulas only | Pivot tables, or a data model |
| Typical audience | Board pack, monthly management review, agency owner | Analyst exploring the detail |
Who This Is For
- Owners and directors of credit recovery, debt collection or accounts-receivable management agencies who need a monthly performance pack that always looks the same.
- Heads of collections reporting recovery rate, CEI, liquidation and cure rate to a board or a client.
- Contact centre managers tracking contact rate, right-party contacts and promise-kept rates.
- Operations and finance leads watching cost-to-collect, collections per FTE and days-to-first-payment.
- Quality and complaints managers reporting dispute rate and complaints per thousand accounts as management metrics.
- In-house receivables teams at lenders, utilities, healthcare providers, telcos or subscription businesses that run recovery internally.
How to Use It
- Download the ZIP, unzip it and open the workbook. Read the Read Me page first – it is five minutes well spent.
- Go to KPI Definition and edit the 14 KPI rows to match the measures you actually report. Set each one’s unit, formula text, direction (UTB or LTB), owner, priority and frequency. Add more in the empty rows if you need them.
- Set cell E3 on KPI Input – Actual to the first month of your reporting year. Everything else re-bases from there.
- Replace the demo numbers on KPI Input – Actual, – Target and – PY with your own figures, month by month, MTD and YTD.
- Open KPI Dashboard and pick your month in cell D6. Adjust the 100 / 95 thresholds in columns L and U if your governance uses different bands.
- Use KPI Trend to talk through any single KPI, and KPI Analysis for the group roll-up and the top and bottom five.
What This Template Is Not
Worth being blunt about, because the topic is a regulated one.
- It is not a compliance tool. It makes no claim about FDCPA, FCRA, CFPB, TCPA, GDPR, UK FCA rules, state licensing, bonding or any other regime, and using it proves nothing to a regulator or an examiner.
- It is not a system of record for collections, not a dialler, not a payment processor and not a consumer-data store. It holds monthly aggregate numbers only – there is no account, debtor, name, address or phone field anywhere in the workbook.
- It does not score, rank or profile individual consumers, and it does not touch credit-bureau reporting, furnishing accuracy, dispute handling, validation notices or call recording.
- Dispute Rate and Complaints per 1K Accounts are management metrics you type in. They are not a regulatory return and they are not connected to any complaints database.
- Targets and thresholds in the file are placeholders, not industry benchmarks and not recommendations. Set your own.
- All figures visible in the screenshots are demo data generated to show the layout working. They describe no real agency and no real portfolio.
Frequently Asked Questions
Does this make my agency FDCPA or CFPB compliant?
No. It is a spreadsheet that displays monthly numbers you have typed in. It carries no compliance logic, no rule checks and no regulatory reporting, and nothing in it should be presented to a regulator, examiner, auditor or client as evidence of compliance. Compliance is a matter for your own legal and compliance function.
Does it store debtor or consumer data?
No. The workbook has no field for a consumer name, account number, address, phone number or balance. Its three input sheets take one MTD and one YTD number per KPI per month – fourteen rows of aggregate figures. If you choose to add columns of your own containing personal data, that is your decision and your data-protection responsibility, and you would need to handle the file accordingly.
Is the data in the screenshots real?
No. Every number you can see is demo data included so you can open the file and watch it work immediately. Replace it with your own on the three input sheets.
Do I need Power Query, Power Pivot or macros?
None of them. It is plain worksheet formulas – VLOOKUP, MATCH, INDEX, COUNTIF – in an .xlsx file. There is no add-in to install, no data model, no macro to enable and no refresh step.
Which Excel versions does it work in?
Excel 2013 and later on Windows and Mac, and Excel for the web. It also opens in Google Sheets, although the chart formatting will shift.
Can I add my own KPIs?
Yes. The sheets are wired for 22 KPIs and 14 are filled in, so six more need no work at all beyond typing them on KPI Definition. To go past 22, select the last data row on each sheet, fill down, and widen the ranges in the summary cards on KPI Dashboard row 4 and in the helper columns on the Support sheet – the Read Me page walks through it.
Can I change the traffic-light bands?
Yes. On Target from 100%, At Risk 95-99% and Missed below 95% are written into the formulas in columns L and U on the KPI Dashboard sheet. Edit them there and every status cell and every summary card follows.
Is this the same as your Credit Recovery analytical dashboard?
No – they are different templates. This is the month-picker scorecard: fourteen KPI rows, achievement %, traffic lights and a trend page. An analytical dashboard takes a transaction-level table and gives you slicers and charts. Plenty of teams run both; see the table above to decide which you want.
Is it locked or protected?
No. Every sheet, formula, chart and colour is open. Rebrand it, restructure it, add sheets – it is yours.
What is in the download?
One ZIP containing the .xlsx workbook and a PDF user manual for the Excel KPI dashboard range.
Related Templates
- Loan Recovery Services KPI Dashboard in Excel – the closest sibling in this range, built around lender-side recovery.
- Debt Management KPI Dashboard in Excel – the same scorecard idea from the debtor-portfolio side.
- Accounts Receivable KPI Dashboard in Google Sheets – AR ageing and collection metrics for teams that live in Sheets.
- Loan Recovery Services Dashboard in Power BI – the analytical counterpart, if you have row-level data to explore.
- Loan Portfolio KPI Dashboard in Power BI – portfolio-level KPIs in Power BI.
- Executive & Operations Scorecard Bundle – nine Excel scorecards together if you report on more than one function.
What You Get
- One .xlsx workbook, 10 sheets, unlocked and fully editable
- 14 pre-built credit-recovery KPIs across 4 groups, expandable to 22 with no formula work
- A PDF user manual for the Excel KPI dashboard range
- Demo data included so the file works the moment you open it
- Lifetime access to the file you buy
A full walkthrough of every page, including an honest note on the file’s current cosmetic quirks, is on the blog: Credit Recovery Agencies KPI Dashboard in Excel.
Need a different KPI set, your own branding or a Power BI or Google Sheets version? Tell us the measures that matter to you and we will build the scorecard around them – [email protected].







Reviews
There are no reviews yet.