

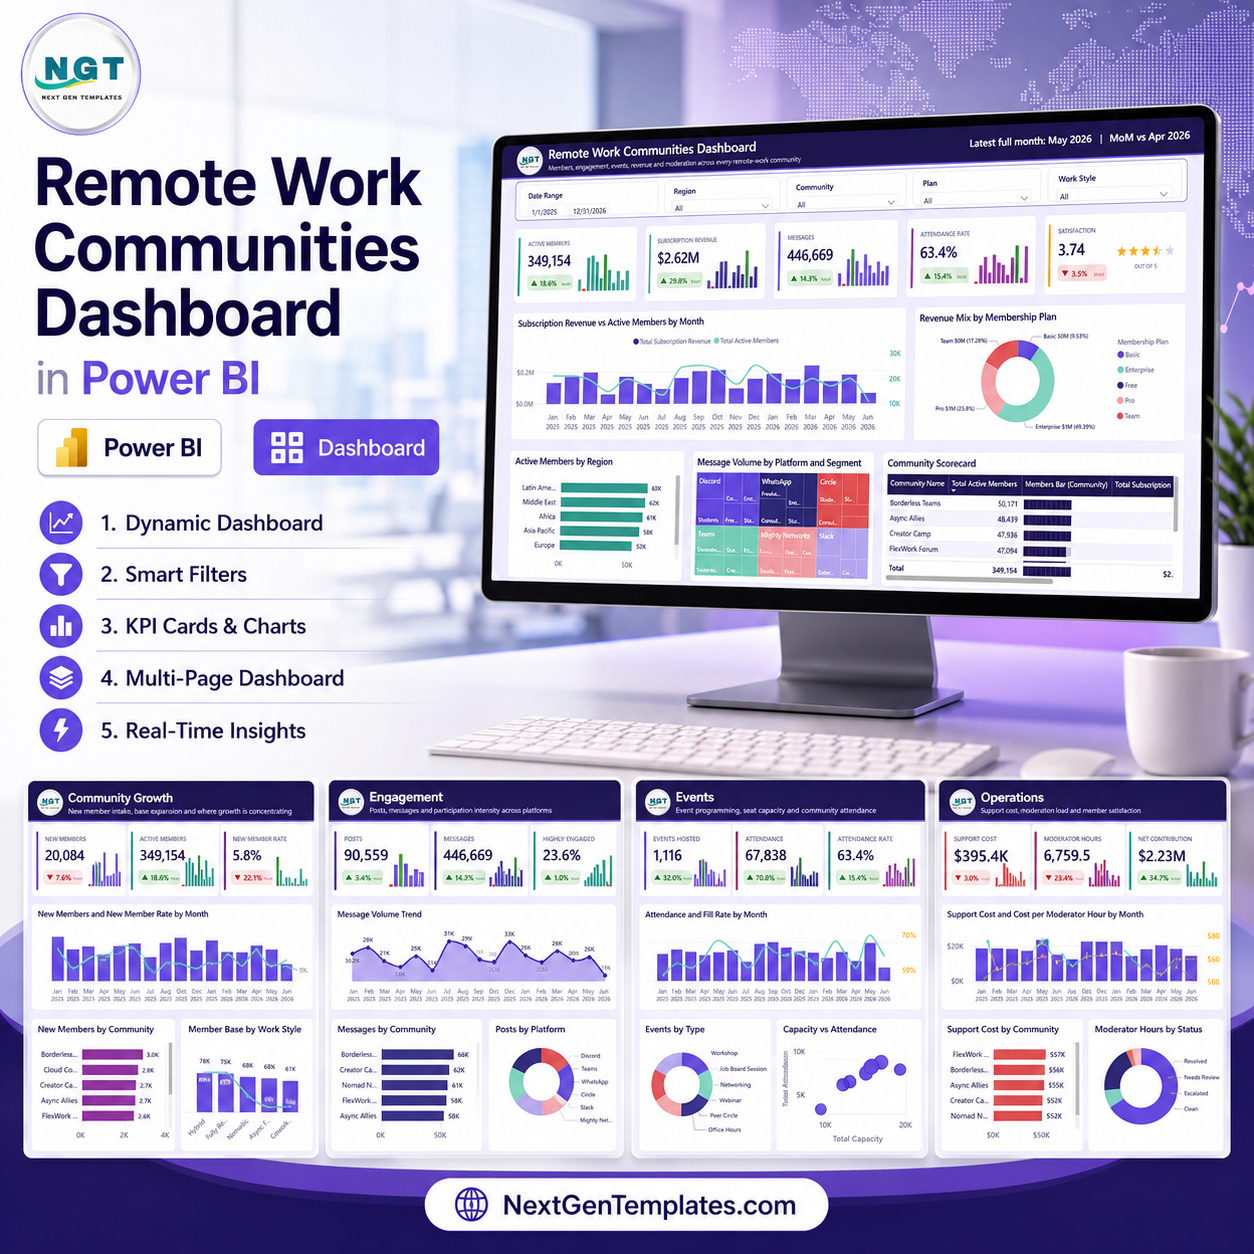
Remote Work Communities Dashboard in Power BI helps community managers, remote-work platform teams, coworking operators, membership leaders, creator community owners, and analysts track member growth, subscription revenue, messages, event attendance, support cost, and satisfaction in one editable PBIX report. A community with 1,000 active members, 4 platforms, 5 membership plans, and monthly events can create 12,000+ message, attendance, support, and engagement records in a year. This dashboard gives those records a ready Power BI reporting structure for $17.99 one-time, backed by PK’s 15+ years of dashboard-building experience and a practical digital-download workflow.
Key Features of Remote Work Communities Dashboard in Power BI
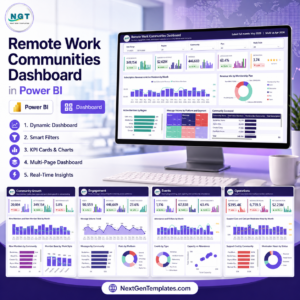
- 5 Power BI pages: Overview, Community Growth, Engagement, Events, and Operations.
- 5 executive cards: Active Members, Subscription Revenue, Messages, Attendance Rate, and Satisfaction.
- Interactive slicers: Filter quickly by month, region, community, platform, segment, membership plan, work style, event type, and status fields.
- Membership revenue view: Review active members and subscription revenue by month, plan, region, and community.
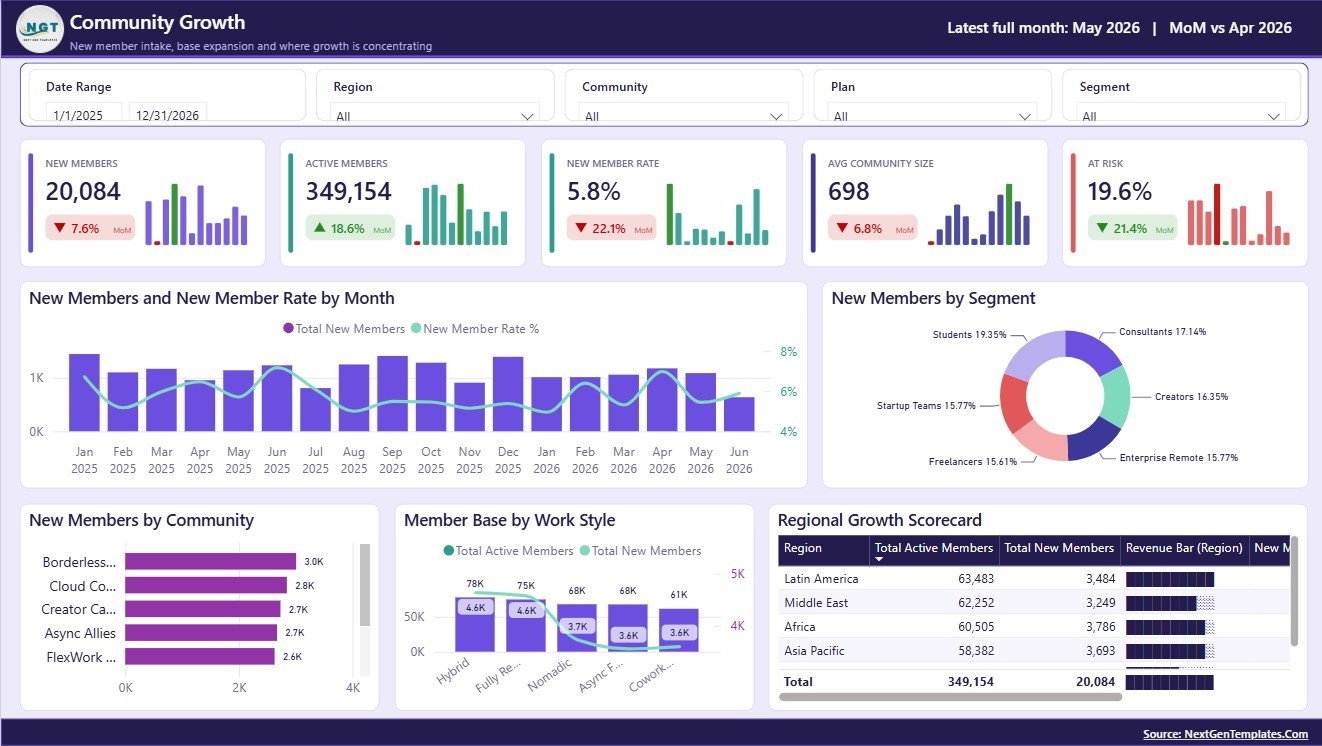
- Growth analysis: Track new members, new member rate, segment growth, community growth, work style, and regional expansion.
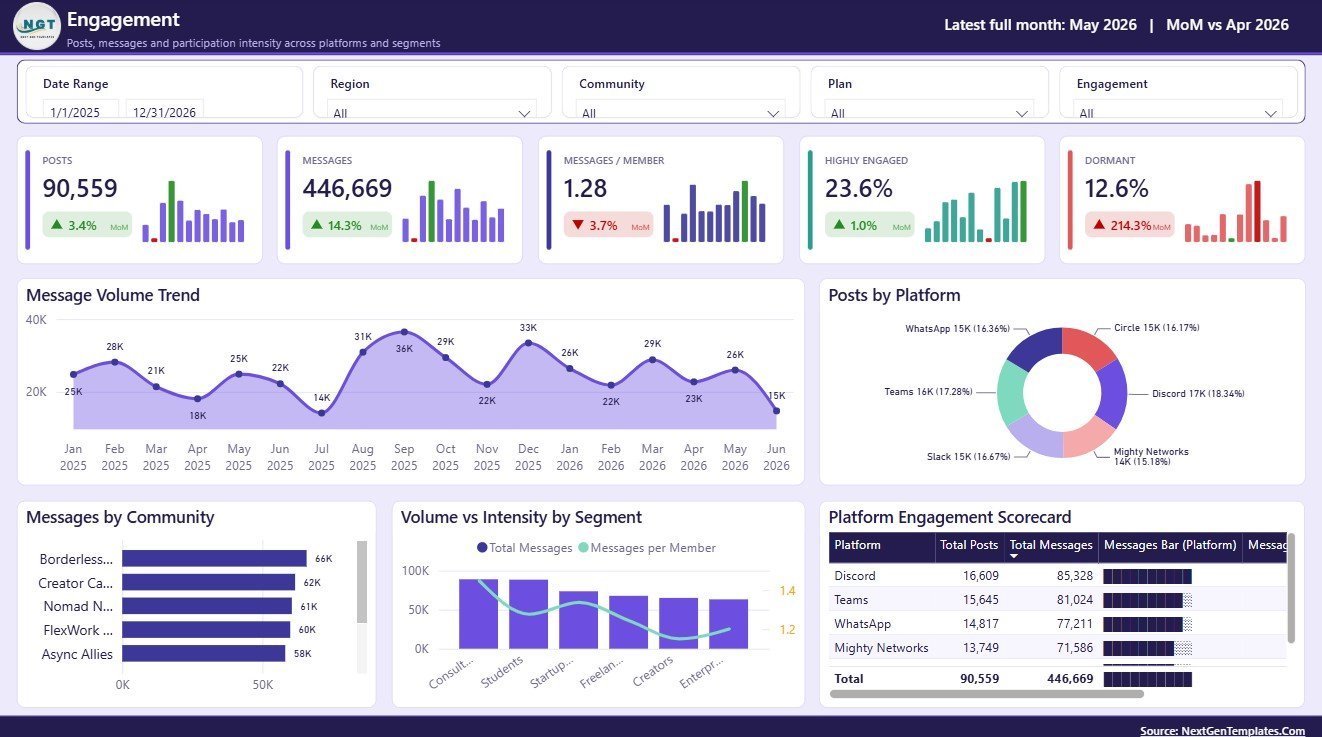
- Engagement reporting: Analyze messages, posts, platforms, segments, and messages per member.
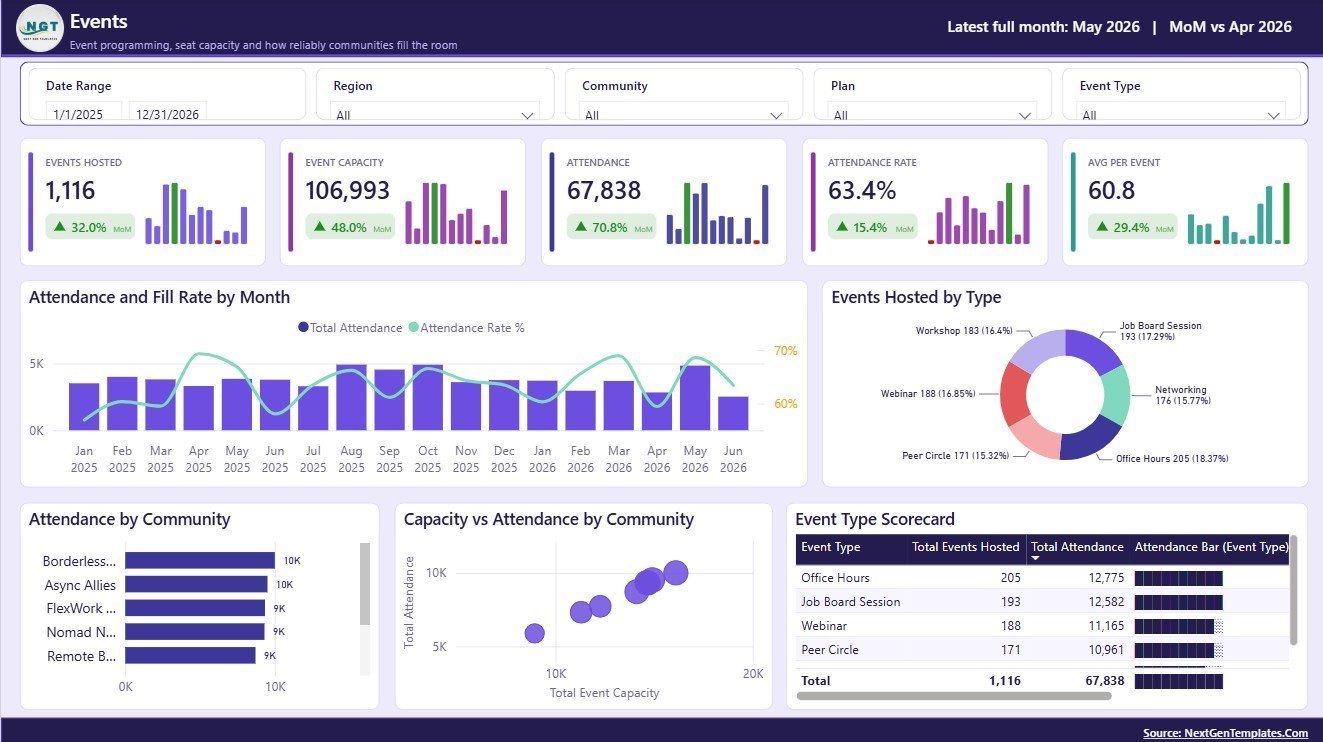
- Event and operations reporting: Review attendance, fill rate, hosted events, support cost, moderator hours, and community P&L.
What’s Inside the Remote Work Communities Dashboard in Power BI
1. Overview Page
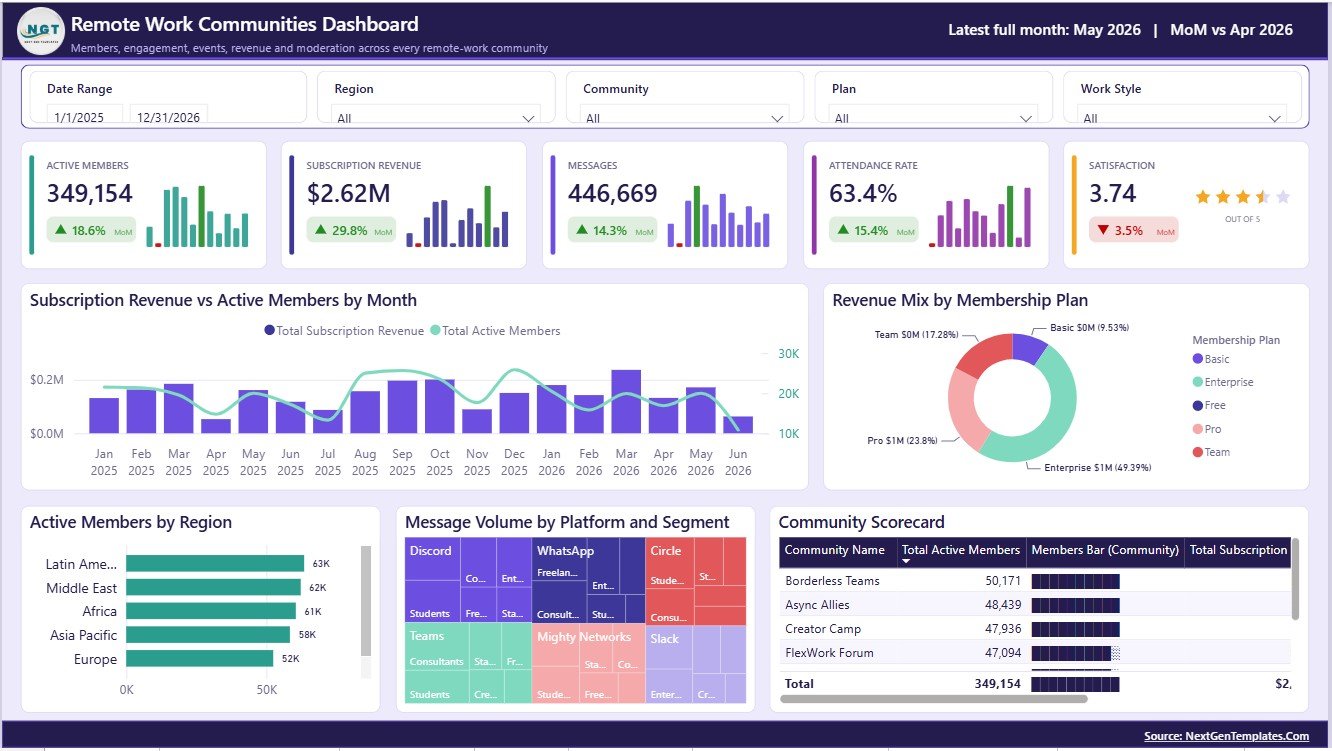
The Overview page gives leadership a fast view of community health. The top cards show Active Members, Subscription Revenue, Messages, Attendance Rate, and Satisfaction so users can review scale, monetization, participation, events, and member sentiment together.
Subscription Revenue and Active Members by Month: This chart shows whether membership size and revenue move together over time. It helps teams spot retention dips, revenue gains, and seasonal activity.
Subscription Revenue by Membership Plan: This chart compares paid revenue across plans. It helps operators understand which plans support the strongest monetization.
Active Members by Region: This visual shows where members are concentrated geographically. It helps plan regional programming, ambassadors, and community expansion.
Message Volume by Platform and Segment: This chart compares conversation volume by platform and member segment. It helps managers see which audiences and channels need more attention.
Active Members and Subscription Revenue by Community: This view compares community-level scale and revenue side by side. It helps identify strong communities and underperforming groups.
2. Community Growth
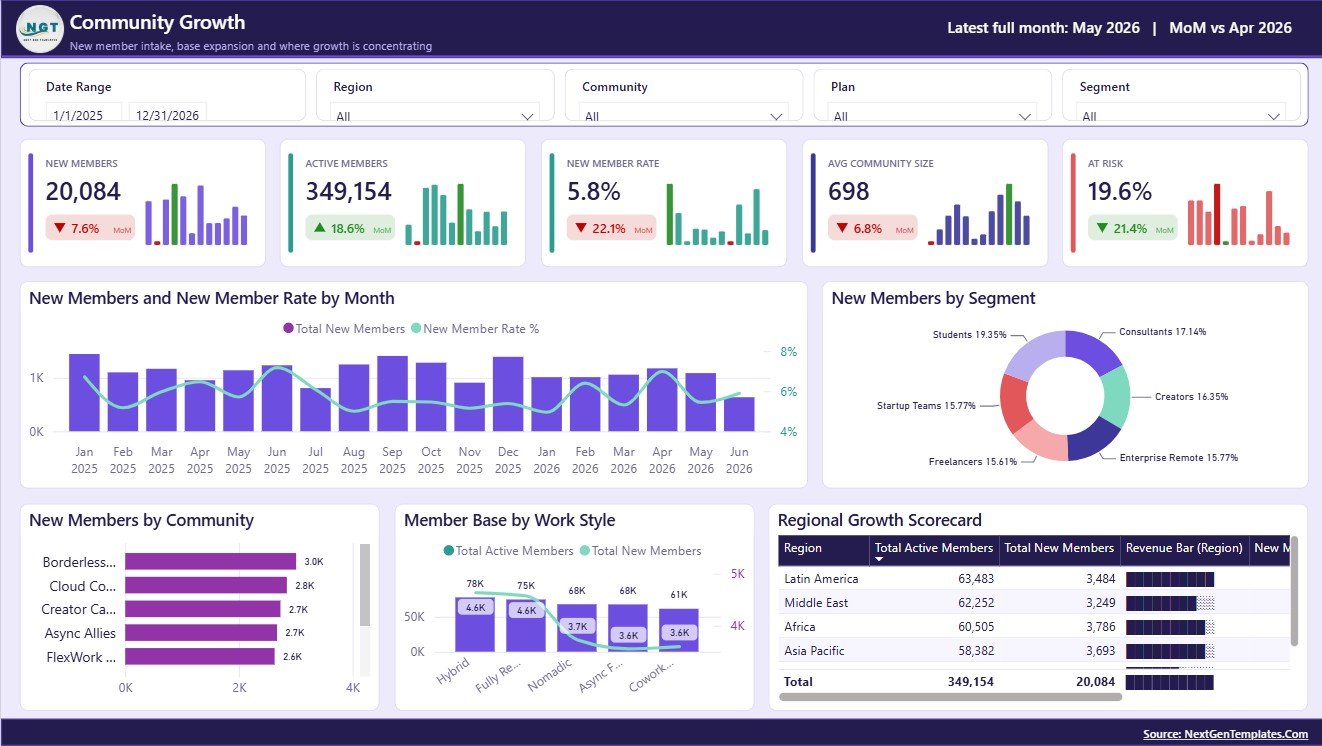
The Community Growth page focuses on acquisition and expansion. It includes New Members and New Member Rate by Month, New Members by Segment, New Members by Community, Member Base and New Members by Work Style, and Regional Growth by Region.
3. Engagement
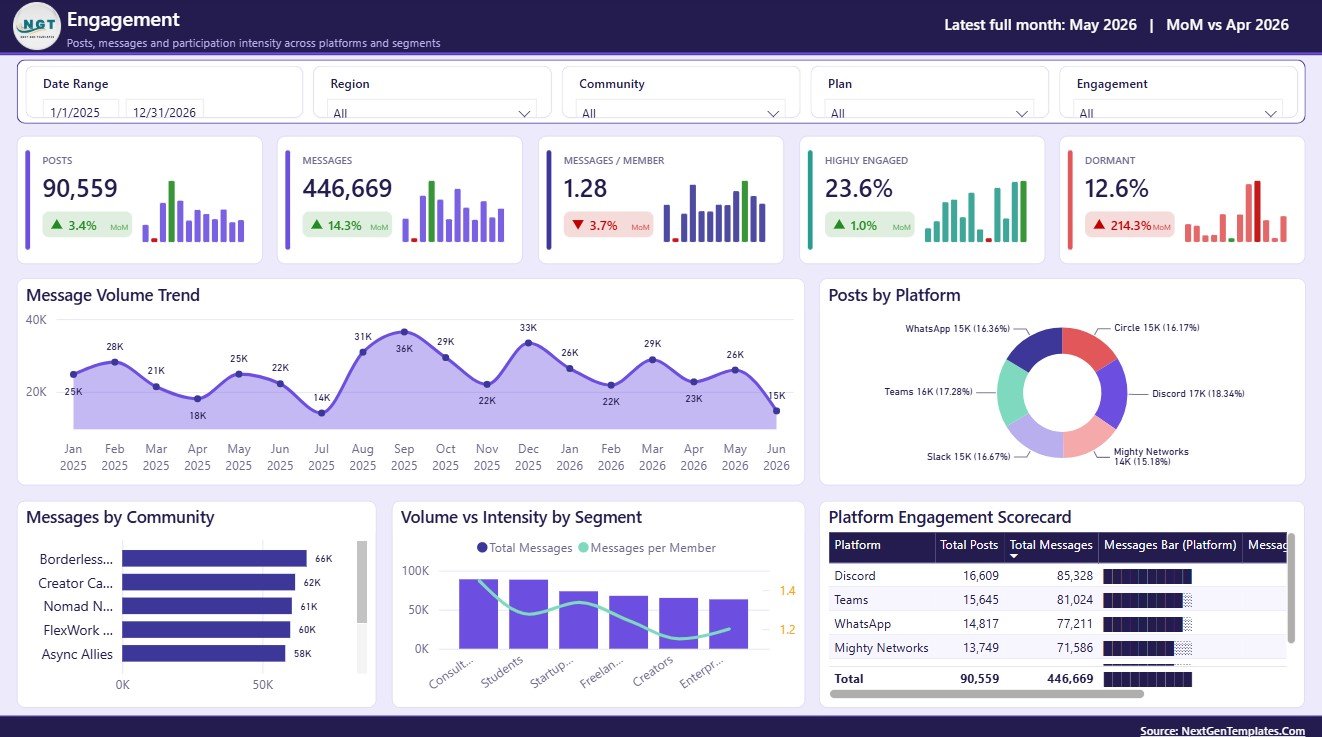
The Engagement page explains how members participate after joining. It includes Messages by Month, Posts by Platform, Messages by Community, Messages and Messages per Member by Segment, and Platform Engagement by Platform.
4. Events
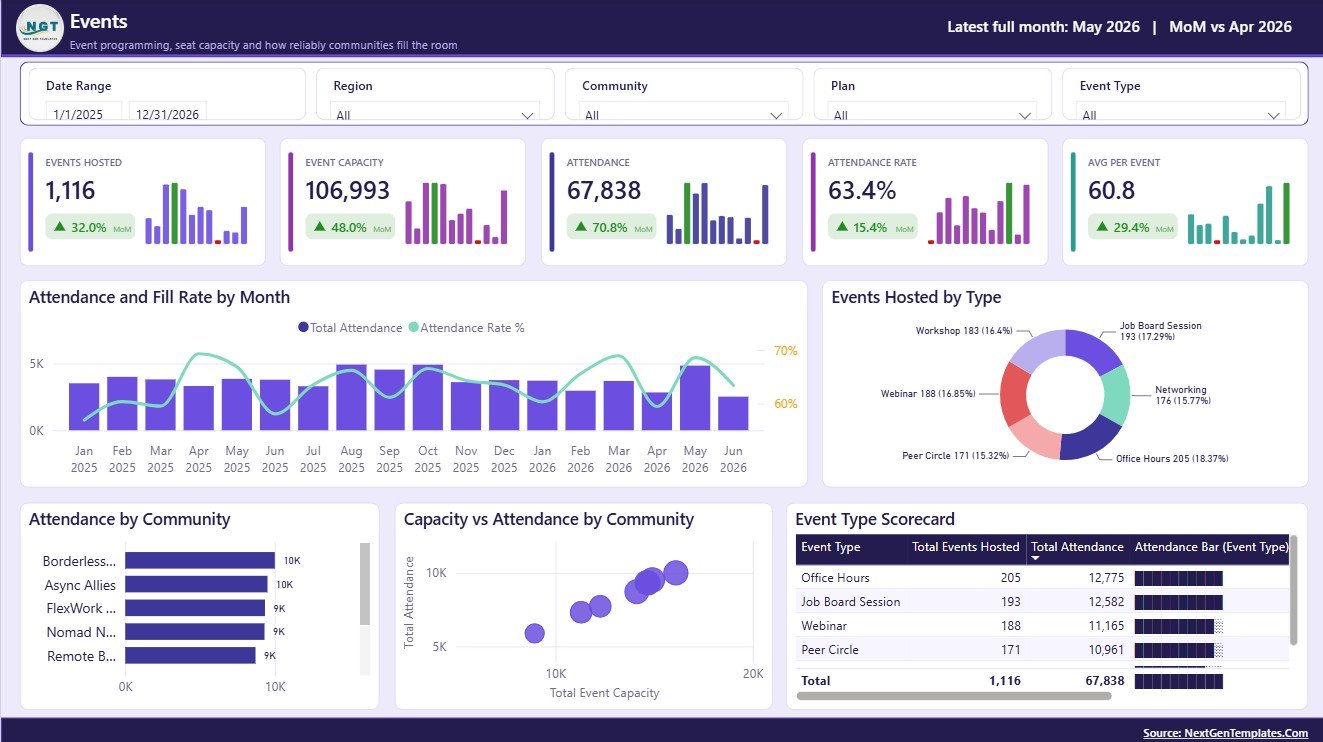
The Events page supports event planning and attendance review. It includes Attendance and Fill Rate by Month, Events Hosted by Type, Attendance by Community, Capacity and Attendance by Community, and Event Type Performance by Event Type.
5. Operations
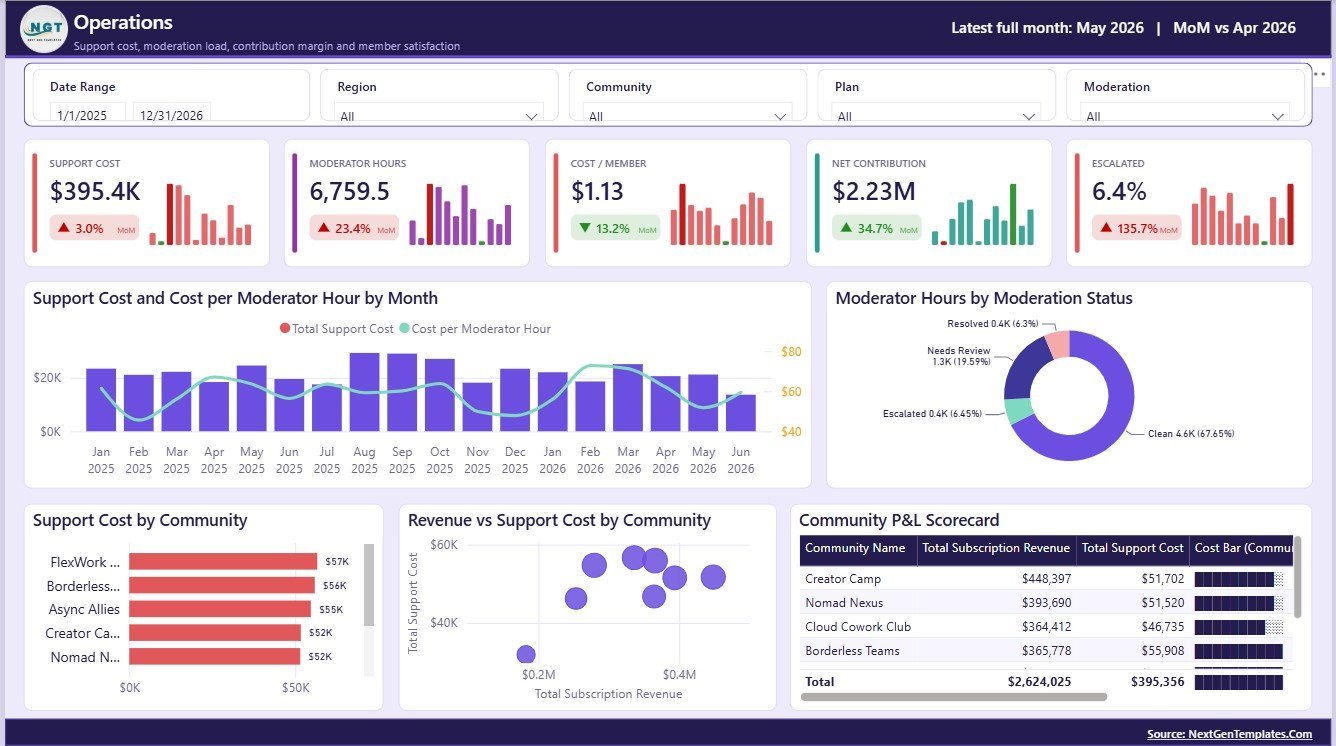
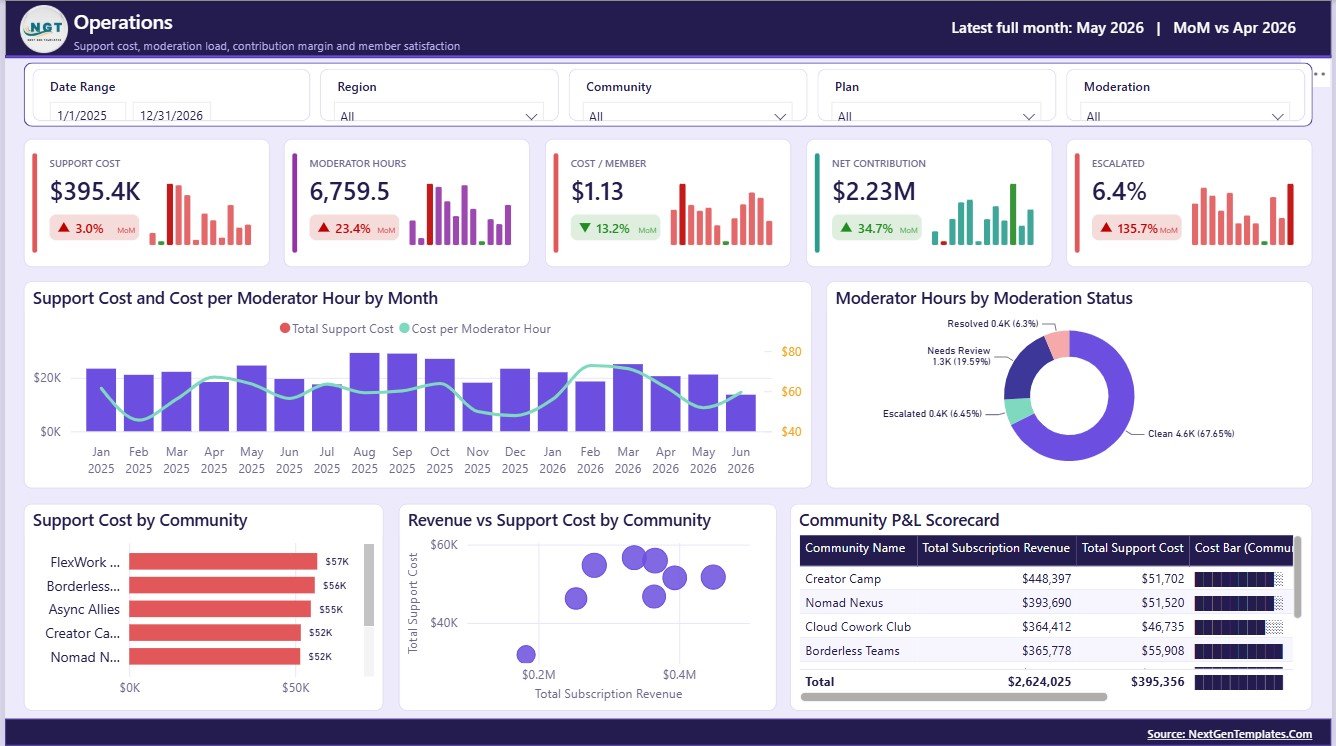
The Operations page connects support workload with revenue and cost. It includes Support Cost and Cost per Moderator Hour by Month, Moderator Hours by Moderation Status, Support Cost by Community, Revenue and Support Cost by Community, and Community P&L by Community.
Remote Work Communities Dashboard in Power BI vs. Tableau vs. Paid CRM/SaaS – Where This Fits
| Feature | This Power BI template | Tableau or Qlik alternative | Paid community SaaS |
|---|---|---|---|
| Cost | $17.99 one-time sale price | License cost plus report build time | Recurring subscription |
| Platform | Power BI Desktop and optional Power BI Service | Tableau or Qlik environment | Vendor-hosted web app |
| Setup time | Open PBIX, connect source, and refresh | Build model and visuals manually | Onboarding and configuration |
| Real-time team collaboration | Available after publishing to Power BI Service | Available by license plan | Usually included |
| Mobile access | Available through Power BI mobile after publishing | Available by platform | Usually included |
| Customizable fields | Edit model, measures, visuals, pages, and slicers | Editable with analyst skills | Often limited by vendor settings |
| Share with link | Available through workspace permissions | Available through server permissions | Usually login controlled |
| Year-1 cost at 5 users | Template cost plus Microsoft licensing choice | License cost plus analyst time | Often hundreds or thousands per year |
| Community metrics | Members, revenue, messages, posts, attendance, events, support cost, moderator hours, satisfaction, and P&L | Must be designed manually | Depends on purchased modules |
Who This Template Is For – and Who It’s Not For
This dashboard is for community managers, remote-work platform operators, coworking networks, membership teams, creator communities, event coordinators, support managers, and Power BI analysts who need a reporting layer for prepared community data. It is not a live chat tool, billing processor, moderation platform, member portal, or customer support ticketing system.
How to Use the Remote Work Communities Dashboard in Power BI
- Download and unzip the product file.
- Open the PBIX file in Power BI Desktop.
- Review the Overview, Community Growth, Engagement, Events, and Operations pages.
- Replace the sample source with your community data.
- Refresh the report and validate the KPI cards.
- Use slicers to filter by community, month, region, platform, segment, plan, work style, event type, and status.
- Publish to Power BI Service if your team needs browser access, sharing, or scheduled refresh.
Real-World Use Cases
Maya, community operations lead: reviews active members, revenue, attendance, and satisfaction before a monthly leadership meeting.
Arjun, platform manager: compares messages by platform and segment to decide where moderators and facilitators should focus.
Leena, membership analyst: studies revenue, support cost, and community P&L before pricing and retention discussions.
Frequently Asked Questions
What does this dashboard track?
It tracks active members, subscription revenue, messages, attendance rate, satisfaction, new members, posts, events hosted, support cost, moderator hours, community P&L, regions, platforms, plans, segments, and work styles.
Do I need Power BI Desktop?
Yes. Open and edit the PBIX file in Power BI Desktop, which is free from Microsoft. Power BI Service is optional for sharing and scheduled refresh.
Can I use my own community data?
Yes. Replace the sample source with your structured community records and refresh the report.
Can I customize the visuals?
Yes. You can edit measures, pages, visuals, slicers, titles, colors, relationships, and data connections in Power BI Desktop.
Is this a live community platform?
No. It is a Power BI reporting template for prepared community data, not a chat, billing, ticketing, or moderation system.
Is this a subscription?
No. It is a one-time downloadable Power BI dashboard template.
About the Author
Built by PK – Microsoft Certified Professional with 15+ years of Excel, Google Sheets, and Power BI experience. Founder of NextGenTemplates, reaching 300K+ subscribers across YouTube channels. Every template is hand-built and tested before release.
Explore Related Templates
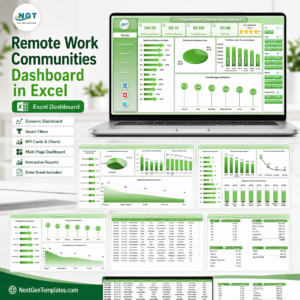
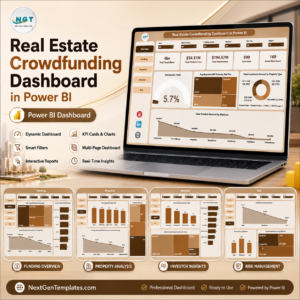
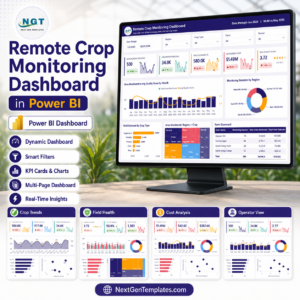
Pair this report with Remote Work Communities Dashboard in Excel, Remote Crop Monitoring Dashboard in Power BI, and Real Estate Crowdfunding Dashboard in Power BI. Browse more Power BI Dashboard templates and Power BI templates.
Detailed blog post: Remote Work Communities Dashboard in Power BI.
Download the Remote Work Communities Dashboard in Power BI today and start reviewing member growth, engagement, events, revenue, support cost, and satisfaction in one editable PBIX report.
Last updated: August 4, 2026.










Reviews
There are no reviews yet.