

A logistics dashboard is no longer a nice-to-have report for transportation teams; it is the control room for fleet utilization, on-time delivery, freight cost, maintenance planning, and 3PL performance. In the U.S. market, trucking still carries the majority of domestic freight by weight, while high operating costs mean a few missed maintenance events, late shipments, or unprofitable lanes can quickly eat into margin. Full fleet software can help, but even entry plans can start around $4 per vehicle per month, so a 25-vehicle operation may be looking at about $1,200 per year before add-ons, implementation time, and workflow changes. These NextGenTemplates tools give lean teams a faster starting point: focused Excel and Power BI templates from $4.99 to $17.99 each, built for practical reporting instead of enterprise rollouts. This roundup compares 8 logistics dashboard and transportation KPI templates for trucking, freight forwarding, port logistics, fleet-as-a-service, e-logistics startups, and vehicle fleet maintenance.
Quick recommendation: If you want the broadest trucking KPI view, start with the Trucking and Logistics Dashboard in Power BI. If your team lives in spreadsheets, choose the Trucking and Logistics Dashboard in Excel. If downtime is your immediate risk, add the Vehicle Fleet Maintenance Calendar in Excel.
Related guide: To see the exact formulas and benchmarks behind these dashboards, read the 12 logistics & OTIF KPIs to track in 2026. Running a 3PL or distribution center specifically? See our 3PL & distribution center dashboard templates buyer guide.
Why Logistics Dashboard Templates Matter in 2026
Trucking still dominates freight movement. The American Trucking Associations reports that trucks moved roughly 72.7% of U.S. freight by weight in 2024, representing 11.27 billion tons of freight. That scale makes transportation KPI visibility a daily operating requirement, not a monthly finance exercise.
Operating cost pressure is real. The Transportation Research Board record for ATRI’s 2025 operational cost update reports average motor carrier operating cost at $2.26 per mile in 2024, with costs per hour at $90.89. A logistics dashboard that separates fuel cost, route profitability, driver performance, and maintenance activity helps teams see where margin is leaking.
Cross-border logistics is a trillion-dollar workflow. The Bureau of Transportation Statistics reported $1.6 trillion in U.S. freight flows with Canada and Mexico in 2024, with trucks moving $1.0 trillion of that freight. For port, freight forwarding, and international shipping teams, this is exactly why cargo, shipping line, service type, and monthly trend dashboards matter.
Port operators and container lines have a separate shortlist: see our port dashboard and shipping line templates for throughput, vessel turnaround, demurrage and shipping line profit. Running rail or metro operations instead of road freight? See our rail and public transit dashboard templates roundup for project cost, KPI and passenger revenue tools built for metro and railway teams.
Fleet software can become a recurring line item. Fleetio’s public pricing lists plans from $4 to $10 per vehicle per month when billed annually. A one-time $17.99 Power BI logistics dashboard template will not replace every fleet management system, but it can give small teams a useful reporting layer before committing to a larger SaaS contract.
Manual reports slow down decisions. When dispatch, finance, maintenance, and operations each maintain separate spreadsheets, teams lose time reconciling route names, truck IDs, customer types, shipment status, and cost categories. A structured fleet management Excel or Power BI template gives every stakeholder the same KPI language. If your focus is the vehicles themselves (fuel, maintenance, downtime), see our ranked fleet management dashboard templates.
 Launch offer
From your first Pivot Table to the Data Model, DAX, Power Query and a one-page KPI dashboard. 11h 51m of video by PK, with practice files, quizzes and a capstone.
Compare the 8 Logistics and Transportation Templates
| Template | Format | Best For | Price |
|---|---|---|---|
| Trucking and Logistics Dashboard in Power BI | Power BI | Fleet managers tracking revenue, fuel cost, routes, drivers, and truck-level performance | $17.99 |
| Trucking and Logistics Dashboard in Excel | Excel | Spreadsheet-first trucking teams that want slicers, pivots, and route analysis | $17.99 |
| Vehicle Fleet Maintenance Calendar in Excel | Excel | Maintenance scheduling, service reminders, inspections, and fleet service calendars | $4.99 |
| Port Logistics Dashboard in Power BI | Power BI | Port authorities, shipping companies, import/export teams, and cargo performance reviews | $17.99 |
| Fleet-as-a-Service Dashboard in Power BI | Power BI | Fleet-as-a-service, mobility, contract, package, fuel, and driver rating analysis | $17.99 |
| Digital Freight Forwarders Dashboard in Power BI | Power BI | Freight forwarders analyzing shipments, margins, service types, and shipment modes | $17.99 |
| E-logistics Startups Dashboard in Power BI | Power BI | Delivery startups needing visual analytics for vehicles, teams, cities, and revenue | $17.99 |
| E-logistics Startups Dashboard in Excel | Excel | Startup logistics teams that prefer Excel reporting for delivery and fleet KPIs | $13.99 |
8 Logistics Dashboard Templates to Compare
1. Trucking and Logistics Dashboard in Power BI
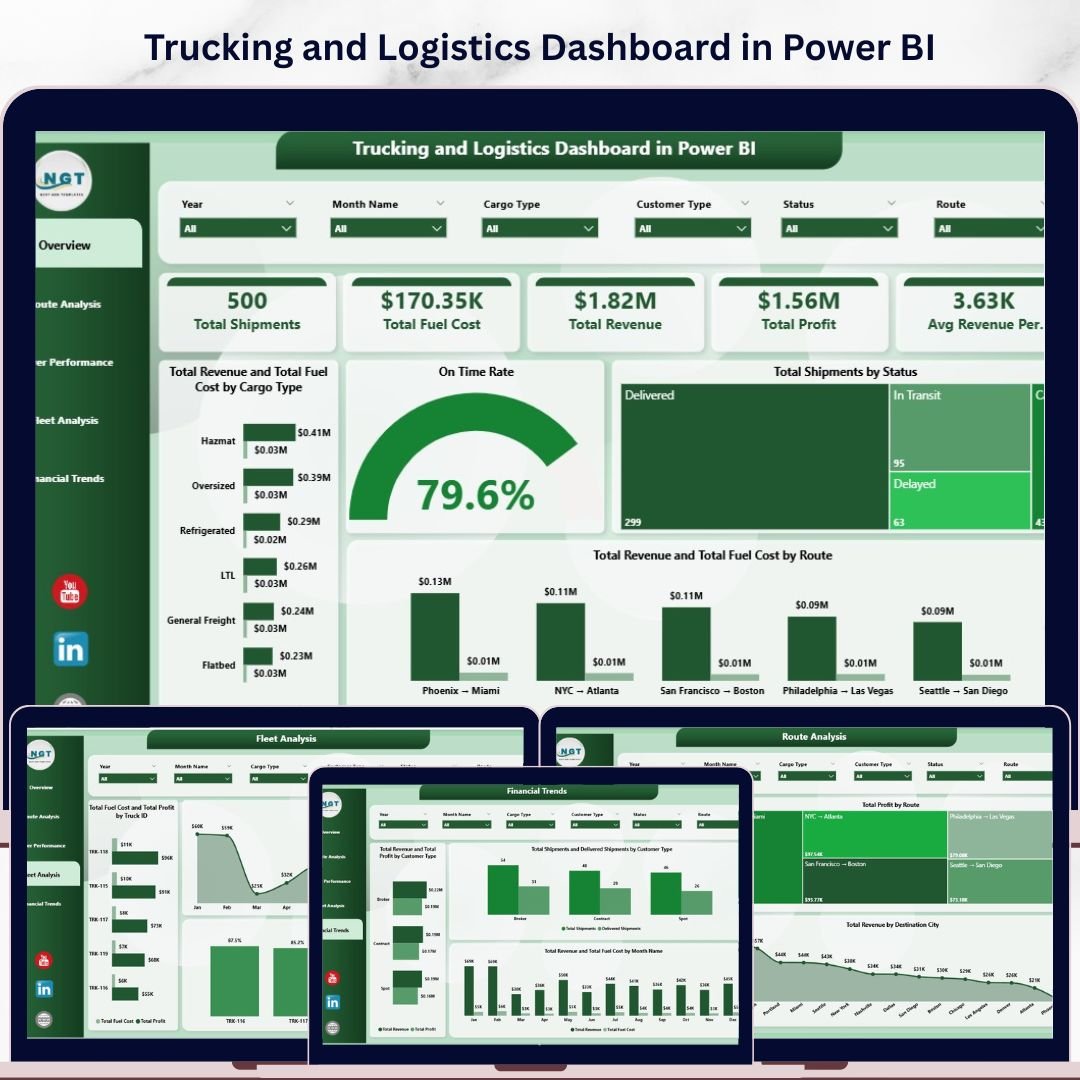
The Trucking and Logistics Dashboard in Power BI is the best starting point for transportation teams that want a full logistics dashboard without building a data model from a blank Power BI file. It is built around five analysis pages: Overview, Route Analysis, Driver Performance, Fleet Analysis, and Financial Trends. That makes it useful for teams that want to connect shipment records, fuel costs, truck IDs, routes, drivers, customer types, and delivery status into one reporting view.
Screenshot preview: The product screenshots show KPI cards for total shipments, total fuel cost, total revenue, total profit, and average revenue per shipment, plus visual breakdowns by cargo type, route, driver, truck, customer type, and month. This is especially helpful when leadership wants to know whether low-margin lanes are a route problem, fuel problem, driver utilization problem, or customer mix problem.
Specific use cases: Monitor on-time delivery by driver, compare fuel cost and profit by truck ID, identify profitable routes by destination city, and review monthly revenue versus fuel cost trends. At $17.99, it gives Power BI users a low-cost reporting layer for fleet utilization, freight cost, and transportation KPI review. Get the Trucking and Logistics Dashboard in Power BI.
2. Trucking and Logistics Dashboard in Excel
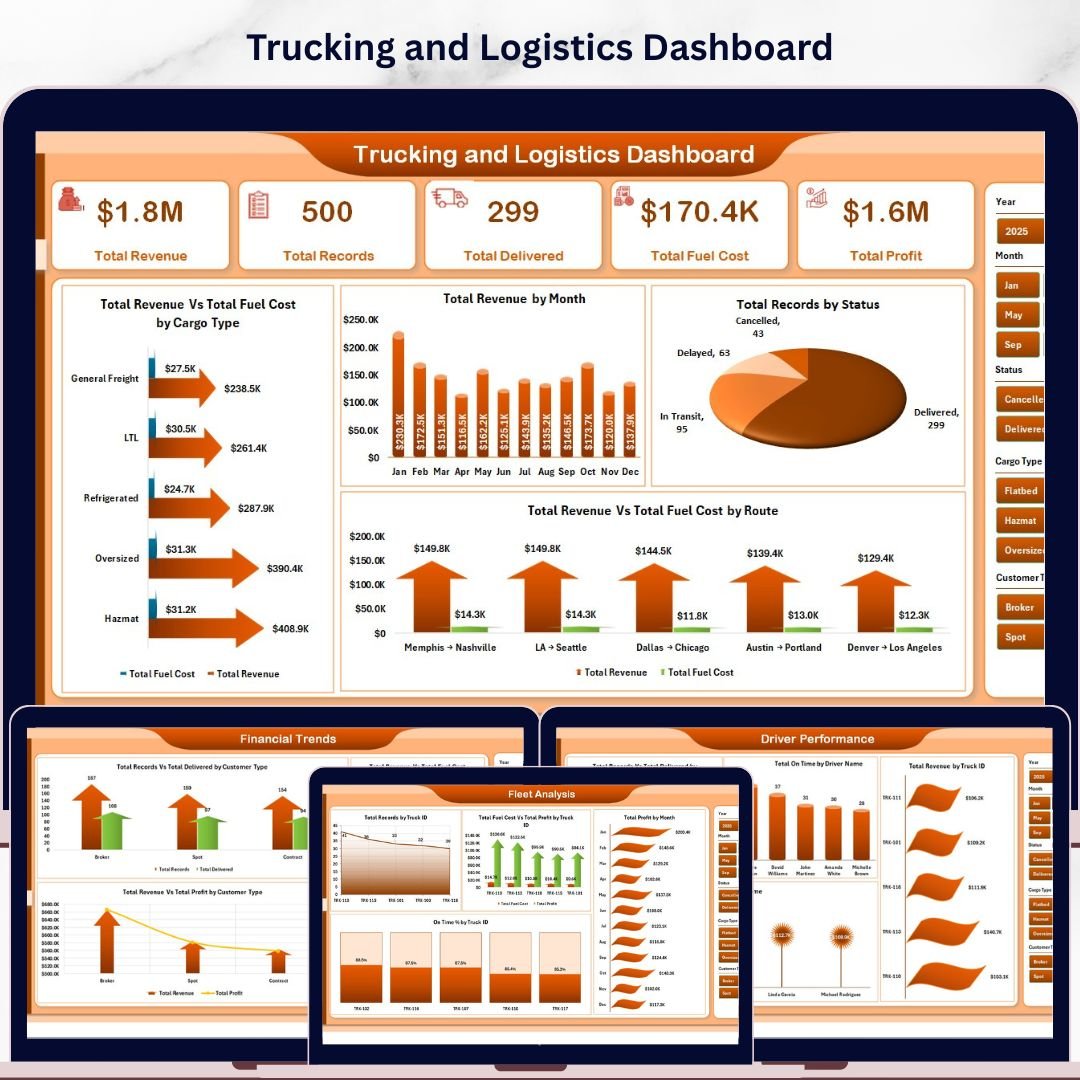
The Trucking and Logistics Dashboard in Excel is a strong choice when your logistics operation already depends on Excel files, exported dispatch data, or manually maintained shipment records. Instead of asking the team to adopt a new BI workflow, this fleet management Excel dashboard uses familiar worksheets, pivot-powered charts, and slicers to turn trucking data into route, driver, fleet, and financial insights.
Screenshot preview: The workbook includes overview reporting, route analysis, driver performance, fleet analysis, financial trends, a data sheet, and a support sheet. The screenshots show KPI cards for total revenue, total records, total delivered, total fuel cost, and total profit. It also includes visuals for revenue by month, records by status, profit by route, on-time percentage by truck, and revenue versus fuel cost.
Specific use cases: Paste monthly trucking records into Excel, refresh pivot tables, filter by cargo type or route, compare driver-level profit, and prepare weekly transportation KPI reviews without a Power BI refresh workflow. It is priced at $17.99 and works well for small and midsize teams that need fast reporting in a spreadsheet format. Get the Trucking and Logistics Dashboard in Excel.
3. Vehicle Fleet Maintenance Calendar in Excel
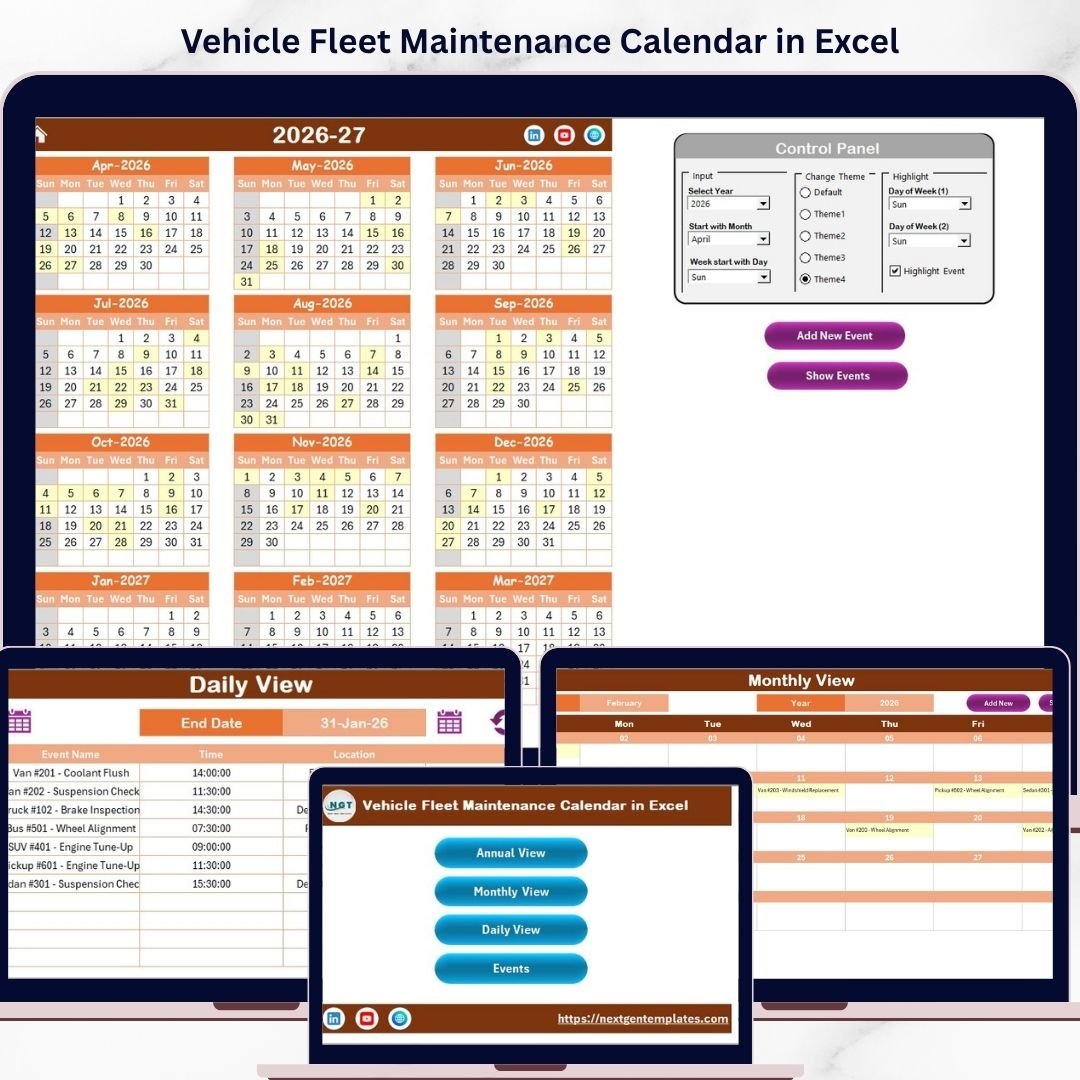
The Vehicle Fleet Maintenance Calendar in Excel is the most affordable template in this roundup and fills a different but critical gap: planned maintenance. A logistics dashboard can show what happened to fuel, delivery, and revenue performance, but maintenance calendars help prevent the failures that cause downtime, missed routes, emergency repairs, and customer delays.
Screenshot preview: The template includes five worksheets: Home, Annual View, Monthly View, Daily View, and Events. The screenshots show calendar-style planning views, event highlighting, add-event controls, date filters, and an events database for maintenance records. This structure is useful for tracking oil changes, tire rotations, inspections, service appointments, registration renewals, compliance checks, and recurring vehicle tasks.
Specific use cases: Plan preventive maintenance by vehicle, review all service events for a date range, maintain a central fleet service log, and give managers an annual view of upcoming maintenance load. At $4.99, this fleet management Excel calendar is a practical add-on for any trucking, delivery, rental, service, or logistics team that wants fewer surprises. Get the Vehicle Fleet Maintenance Calendar in Excel.
Mid-post CTA: Want a low-cost logistics reporting stack? Pair the Trucking and Logistics Dashboard in Excel with the Vehicle Fleet Maintenance Calendar in Excel to cover both performance reporting and service scheduling.
Browse more Excel dashboard templates and Power BI dashboard templates.
4. Port Logistics Dashboard in Power BI
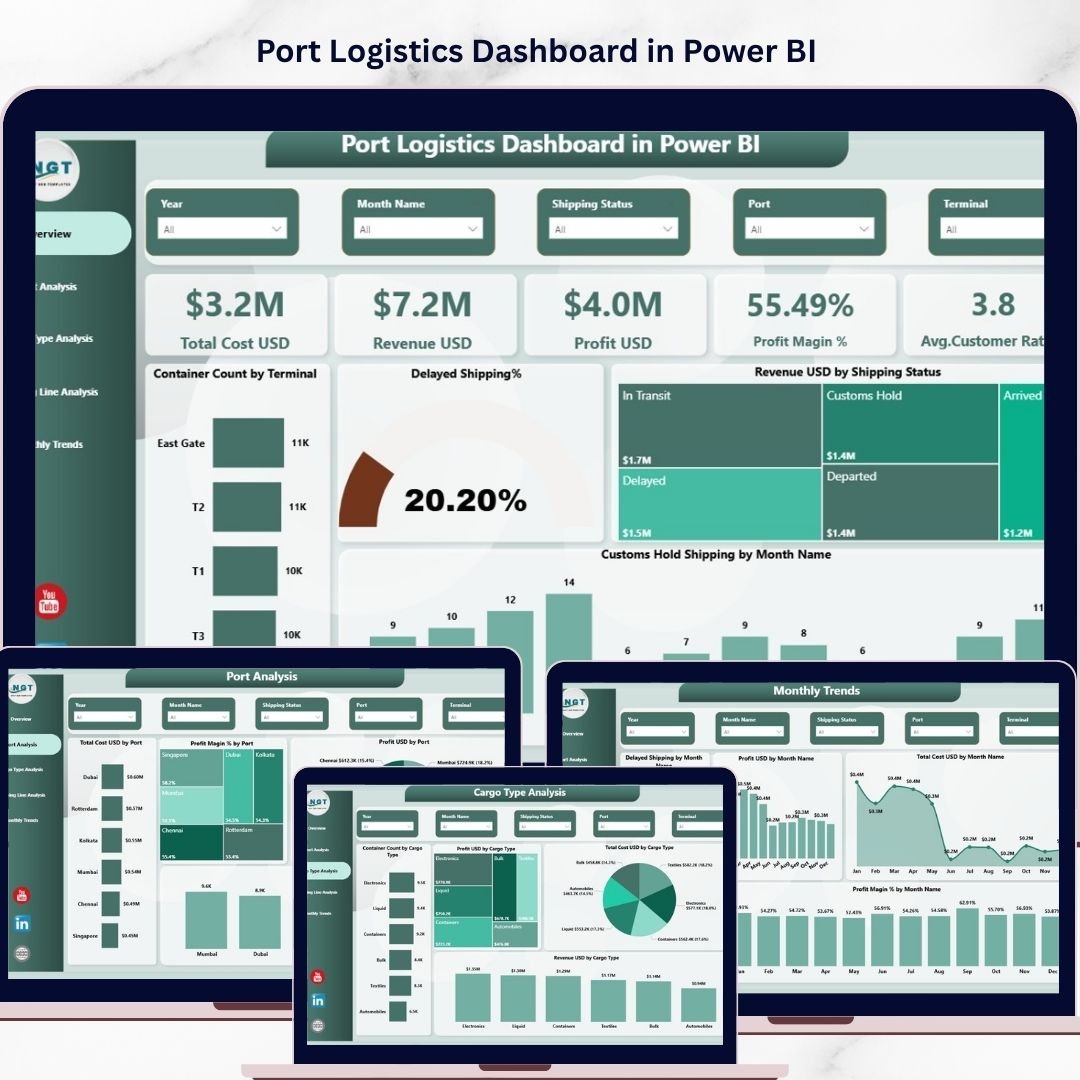
The Port Logistics Dashboard in Power BI is designed for port authorities, shipping companies, import/export teams, and logistics managers who need to track cargo performance, cost, revenue, profit, delay hours, customer rating, and shipping line results. It is more specialized than a general trucking dashboard because the KPI language is built around port activity and maritime logistics workflows.
Screenshot preview: The product screenshots show five dashboard pages: Overview, Port Analysis, Cargo Analysis, Shipping Line Analysis, and Monthly Trends. The visuals include KPI cards for total cost, revenue, profit, profit margin, and customer rating, plus charts for container count, cargo type, delay monitoring, port comparison, and monthly trend analysis. For teams working with terminals, shipping partners, and cargo categories, this is a cleaner fit than a generic fleet dashboard.
Specific use cases: Compare cost and profit by port, identify delayed shipping lines, analyze cargo type profitability, and review monthly delay or margin trends. At $17.99, it gives port and trade operations a focused Power BI reporting layer for cargo and shipping performance. Get the Port Logistics Dashboard in Power BI.
5. Fleet-as-a-Service Dashboard in Power BI
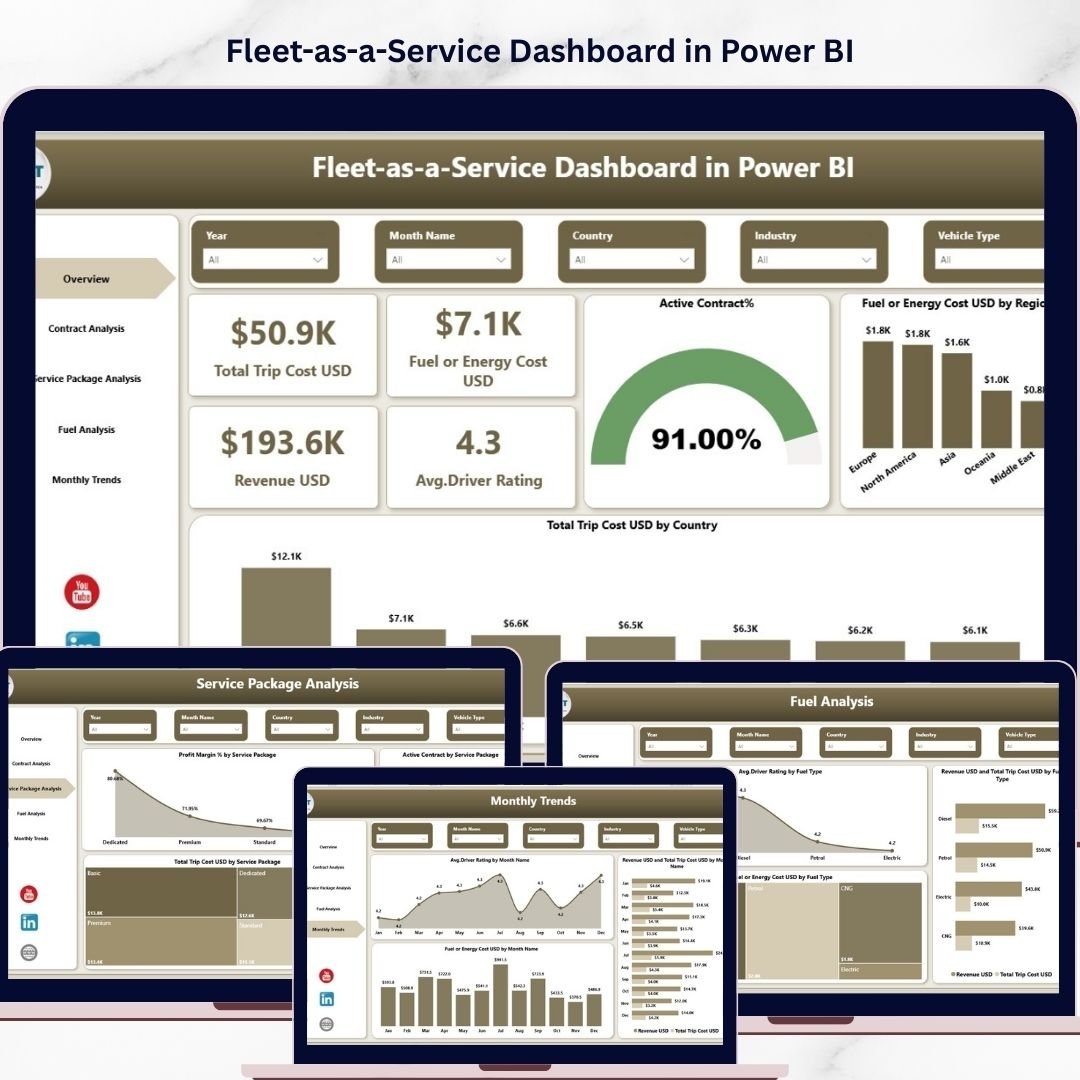
The Fleet-as-a-Service Dashboard in Power BI is a better fit when the fleet itself is part of a service model. Instead of only tracking deliveries, it helps analyze contracts, service packages, region, fuel or energy type, revenue, trip cost, and driver rating. That makes it useful for mobility providers, fleet service operators, corporate transportation programs, ride-sharing support teams, and companies selling fleet access as a managed service.
Screenshot preview: The dashboard screenshots show pages for Overview, Contract Analysis, Service Package Analysis, Fuel Analysis, and Month Analysis. KPI cards include total trip cost, fuel or energy cost, revenue, and average driver rating. The visuals support questions about active contracts, revenue by contract type, profit margin by service package, fuel cost by fuel type, driver rating by month, and region-level cost patterns.
Specific use cases: Evaluate contract profitability, compare service packages, monitor fuel or energy cost by vehicle type, and track driver rating trends across months. At $17.99, it is ideal when fleet utilization and service profitability matter as much as shipment volume. Get the Fleet-as-a-Service Dashboard in Power BI.
6. Digital Freight Forwarders Dashboard in Power BI
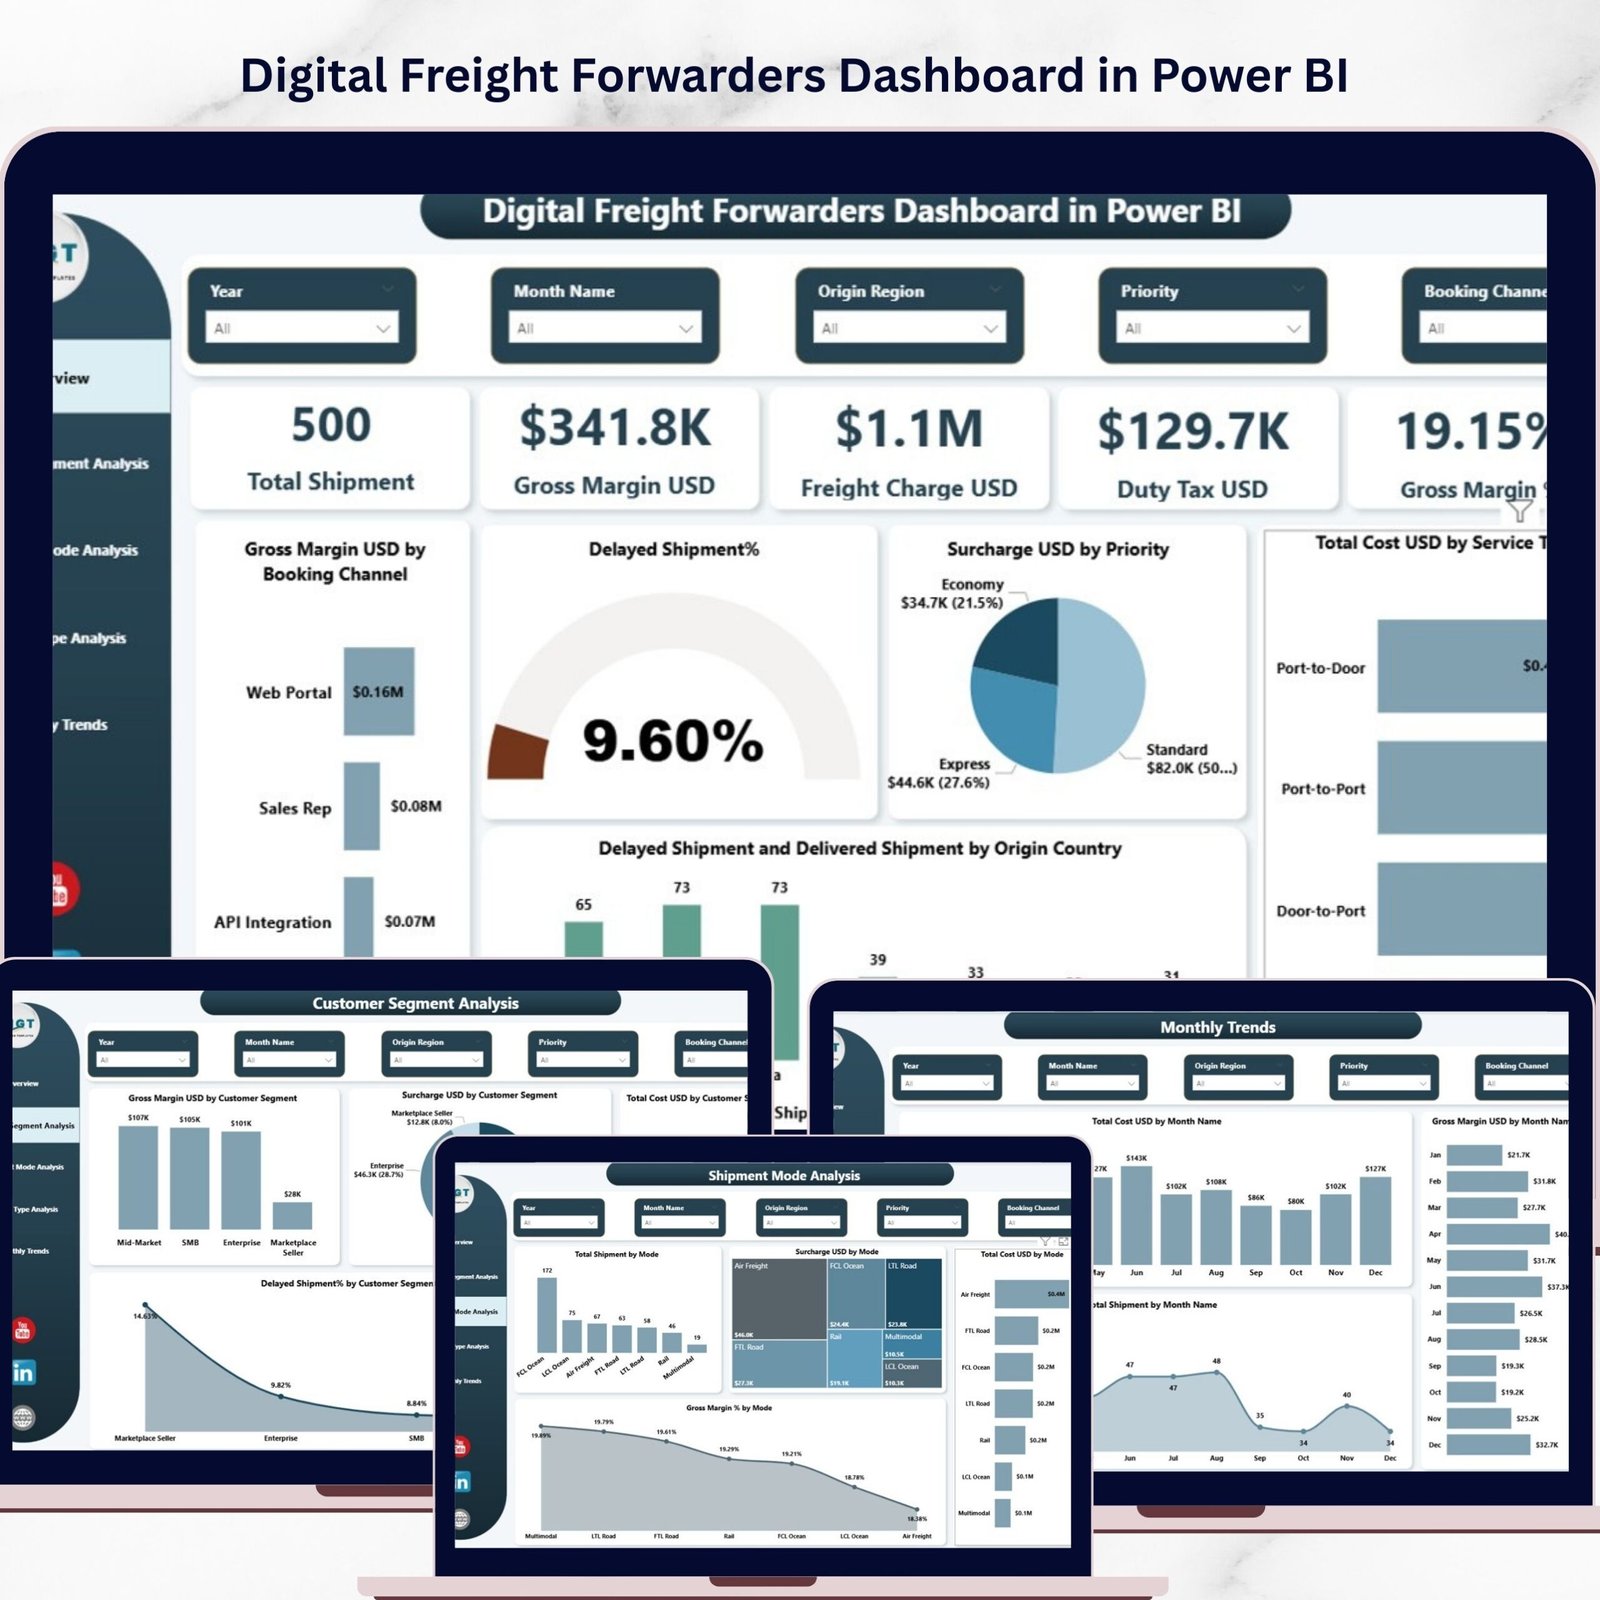
The Digital Freight Forwarders Dashboard in Power BI is built for freight forwarding companies that need to track shipment performance, gross margin, freight charges, duty tax, surcharges, service type, shipment mode, booking channel, and customer segment. If your logistics team manages international shipments across air, sea, road, and rail, this dashboard speaks that operational language directly.
Screenshot preview: The screenshots show five analytical pages: Overview, Customer Segment Analysis, Shipment Mode Analysis, Service Type Analysis, and Month Analysis. KPI cards cover total shipments, gross margin USD, freight charges, duty tax, and gross margin percentage. Supporting visuals help users identify delayed shipment percentages, total cost by service type, profit by booking channel, shipment mode performance, and monthly cost or profit trends.
Specific use cases: Compare air versus sea freight performance, monitor gross margin by customer segment, track delayed shipments by origin, and review duty tax or surcharge impact on profitability. At $17.99, it is a focused Power BI option for forwarders that need margin visibility beyond basic shipment counts. Get the Digital Freight Forwarders Dashboard in Power BI.
7. E-logistics Startups Dashboard in Power BI
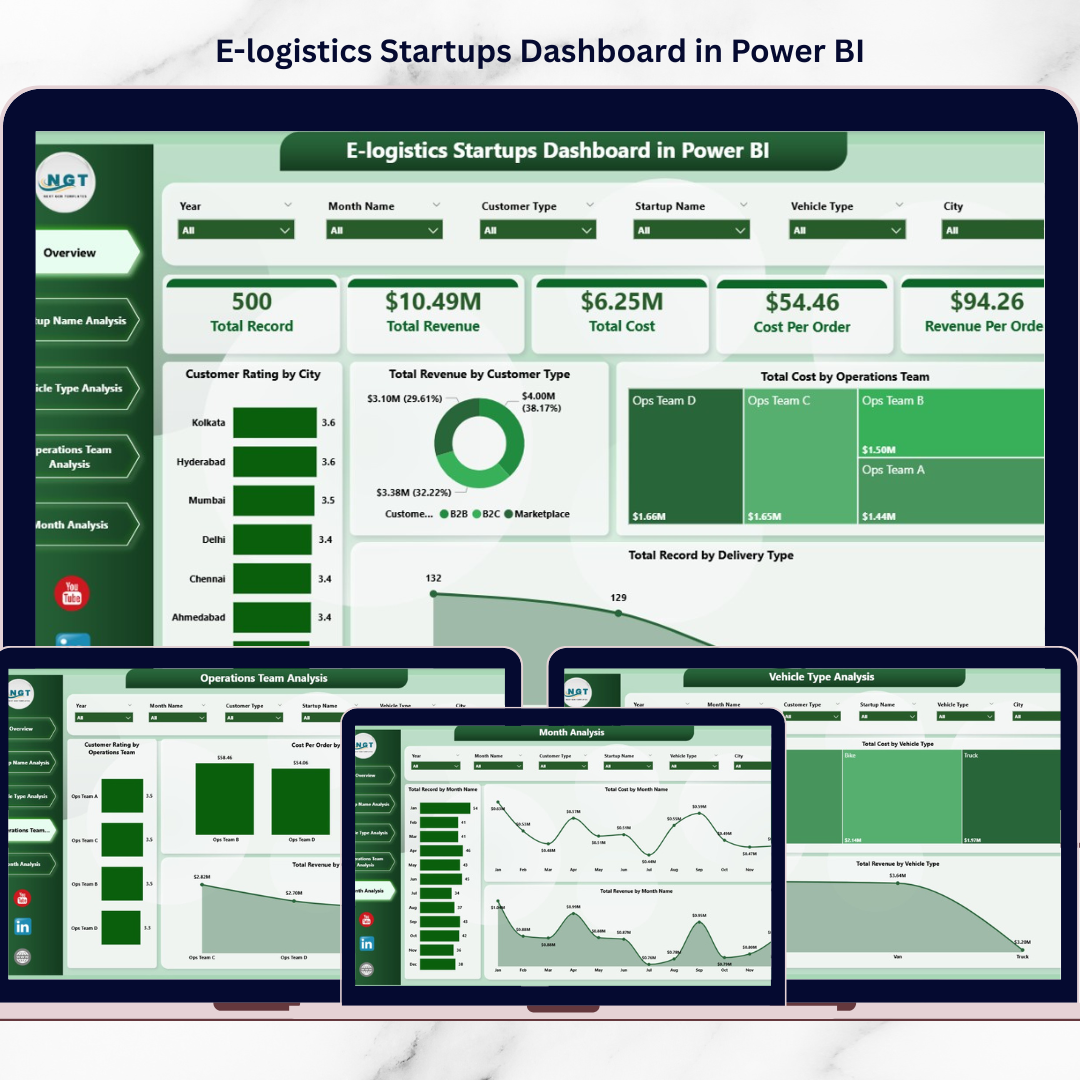
The E-logistics Startups Dashboard in Power BI is designed for fast-moving delivery, e-commerce fulfillment, quick commerce, and logistics startup teams. These teams often need to compare delivery types, startup brands, vehicle types, operating teams, cities, customer ratings, revenue, cost, and month-level performance without waiting for a custom BI build.
Screenshot preview: The screenshots show five dashboard pages: Overview, Startup Name Analysis, Vehicle Type Analysis, Operations Team Analysis, and Month Analysis. The dashboard uses KPI cards, charts, and slicers to highlight delivery performance, revenue by customer type, customer satisfaction by city, vehicle type profitability, operations team efficiency, and monthly performance trends. This layout is useful for founders and operations managers who need to see service performance and unit economics together.
Specific use cases: Compare delivery volume by delivery type, identify high-cost operations teams, review customer rating by city, and analyze revenue or cost trends by month. At $17.99, it is a strong fit for startups ready to move from raw exports to visual Power BI analysis. Get the E-logistics Startups Dashboard in Power BI.
8. E-logistics Startups Dashboard in Excel
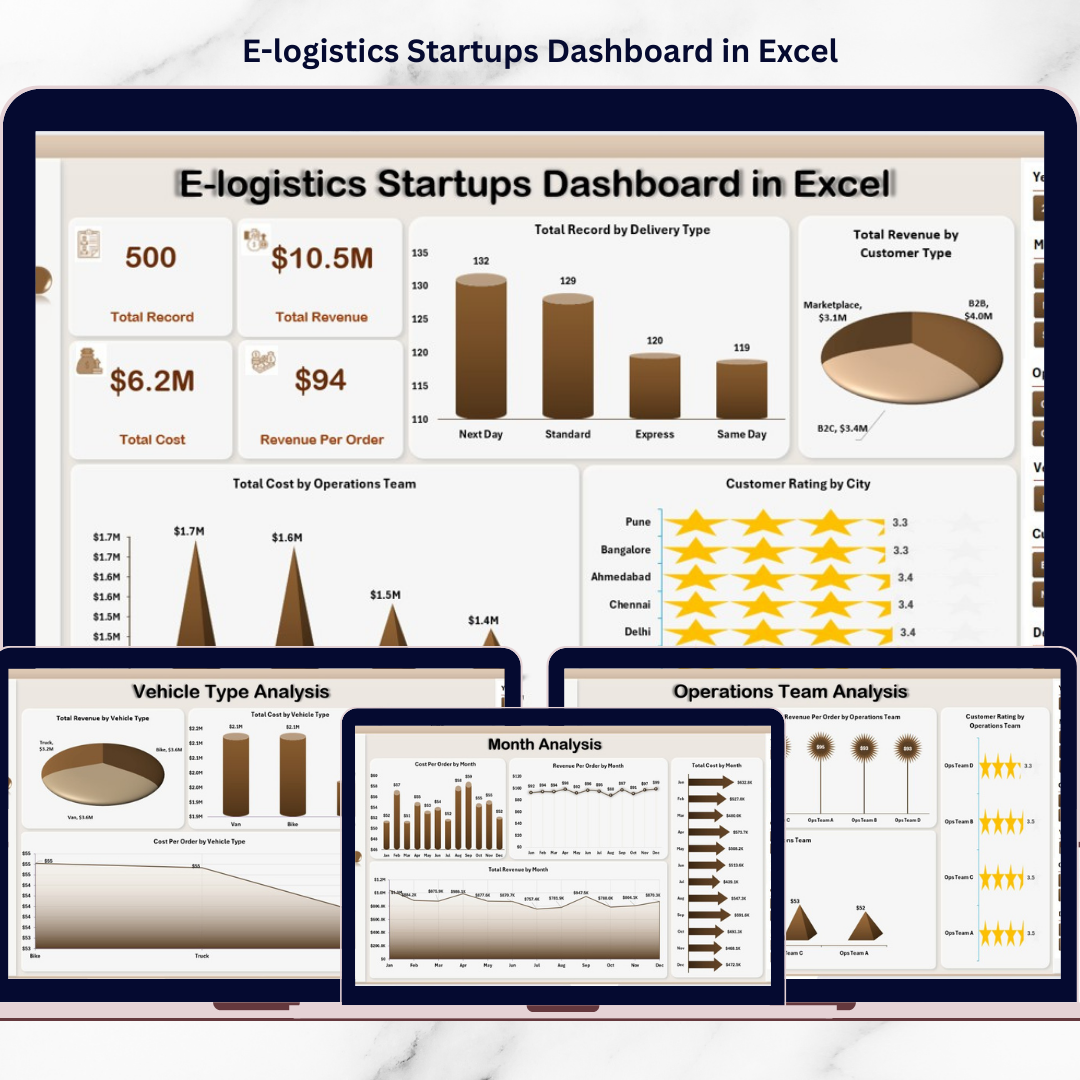
The E-logistics Startups Dashboard in Excel gives startup logistics teams a spreadsheet-based alternative to the Power BI version. It is useful when the team is not ready for a BI workspace, when source data is still exported manually, or when managers prefer reviewing delivery and fleet KPIs inside Excel. It keeps the same business focus: deliveries, revenue, cost, vehicle types, operating teams, cities, customer ratings, and monthly trends.
Screenshot preview: The workbook screenshots show an Overview page, Startup Name Analysis, Vehicle Type Analysis, Operations Team Analysis, Month Analysis, Support Sheet, and Data Sheet. The dashboard is built to help users paste or maintain delivery data, refresh the reporting layer, and use filters to compare operational and financial performance. It is especially useful for small teams that need reporting discipline before investing in a full analytics stack.
Specific use cases: Track delivery count by type, compare revenue and cost by startup brand, monitor customer satisfaction by city, and prepare founder or operations reviews from Excel. At $13.99, it is the lower-cost startup logistics dashboard option in this set. Get the E-logistics Startups Dashboard in Excel.
How to Choose Between These Logistics Dashboard Templates
Choose Power BI when you need interactive reporting at scale. The Power BI templates are best for transportation teams that want richer filtering, stakeholder-ready visuals, and a reporting model that can connect to larger datasets over time. Pick the trucking template for fleet operations, the port template for cargo and shipping line analysis, the fleet-as-a-service template for contracts and service packages, the freight forwarder template for shipment mode and margin analysis, and the e-logistics Power BI template for startup delivery operations.
Choose Excel when the team already works in spreadsheets. The Excel templates are easier to adopt when analysts export CSV files, maintain workbook trackers, or need a lightweight fleet management Excel file that does not require a Power BI publishing workflow. The trucking Excel dashboard is best for route and driver reporting, the e-logistics Excel dashboard is best for delivery startup KPIs, and the maintenance calendar is best for service planning.
Choose by KPI problem, not by software preference alone. If your pain is on-time delivery, route profitability, or driver performance, start with the trucking dashboard. If the pain is downtime, missed inspections, or service planning, start with the maintenance calendar. If the pain is customer-segment margin, shipment mode, or freight charges, choose the digital freight forwarders dashboard. If the pain is cargo flow and delay hours, choose the port logistics dashboard.
Choose by reporting audience. Operations managers need daily route, delivery, driver, and team views. Finance teams need freight cost, profit, revenue, duty tax, fuel cost, and gross margin views. Executives need trend pages, customer type analysis, and quick KPI summaries. The best logistics dashboard is the one that matches the decision your team needs to make this week.
Hauling crude, fuel or drilling supplies? Our oil and gas dashboard templates roundup ranks 8 Excel, Google Sheets and Power BI tools for production, cost and safety reporting.
Frequently Asked Questions
What is a logistics dashboard?
A logistics dashboard is a visual reporting tool that tracks transportation and supply chain KPIs such as shipment volume, on-time delivery, route profitability, freight cost, fuel cost, driver performance, fleet utilization, cargo performance, and customer satisfaction. It helps managers see operational performance in one place instead of switching between spreadsheets.
Which template is best for trucking companies?
The best overall trucking option is the Trucking and Logistics Dashboard in Power BI if your team uses Power BI. If your team prefers Excel, choose the Trucking and Logistics Dashboard in Excel. Both focus on routes, drivers, trucks, fuel cost, profit, and shipment status.
Which template is best for fleet management Excel users?
For fleet management Excel users, the Trucking and Logistics Dashboard in Excel is best for performance reporting, while the Vehicle Fleet Maintenance Calendar in Excel is best for scheduling service events, inspections, and maintenance reminders.
Do these templates replace fleet management SaaS?
No. These templates are reporting and planning tools, not full telematics, dispatch, ELD, or work order systems. They are useful when you need affordable dashboards, spreadsheet reporting, or Power BI analytics before investing in a larger fleet management platform.
How much do these logistics dashboard templates cost?
The templates in this roundup range from $4.99 to $17.99. The Vehicle Fleet Maintenance Calendar in Excel is $4.99, the E-logistics Startups Dashboard in Excel is $13.99, and the other featured Excel or Power BI dashboard templates are $17.99 each.
Which template should a freight forwarder choose?
A freight forwarder should choose the Digital Freight Forwarders Dashboard in Power BI. It is built around shipments, gross margin, freight charges, duty tax, customer segments, shipment modes, service types, and monthly logistics trends.
Which template is best for port logistics?
The Port Logistics Dashboard in Power BI is the best choice for port logistics. It focuses on port analysis, cargo analysis, shipping line performance, delay monitoring, container activity, cost, revenue, profit, and monthly trends.
Can small logistics startups use these dashboards?
Yes. Small logistics startups can use the e-logistics Power BI or Excel dashboards to track delivery performance, vehicle type, operating team, city, customer rating, revenue, cost, and monthly trends. The Excel version is simpler for teams that are still managing data manually.
What transportation KPIs should I track first?
Start with on-time delivery rate, total shipments or delivery records, fuel cost, freight cost, revenue, profit, cost per route or trip, driver performance, vehicle utilization, maintenance events, and customer rating. Then add customer type, service type, cargo type, or shipment mode depending on your operation.
Are Excel or Power BI logistics dashboards better?
Excel is better for fast adoption, manual data entry, and spreadsheet-first teams. Power BI is better for interactive analysis, larger datasets, richer filtering, and executive reporting. Many teams use both: Excel for input and quick operational tracking, Power BI for visual dashboards and stakeholder reporting.
Ready to Build Your Logistics Dashboard
Closing CTA: Choose the logistics dashboard template that matches your immediate reporting problem: trucking performance, fleet maintenance, port logistics, freight forwarding, fleet-as-a-service, or e-logistics startup operations.
Start with the Trucking and Logistics Dashboard in Power BI for the broadest transportation KPI view, or use the Trucking and Logistics Dashboard in Excel when your team wants a spreadsheet-first workflow.
For tutorials and walkthroughs, visit YouTube.com/@NextGenTemplates.
About the Author
Built by PK – Microsoft Certified Professional with 15+ years of Excel, Google Sheets, and Power BI experience. Founder of NextGenTemplates, reaching 300K+ subscribers across YouTube channels. Every template is hand-built and tested before release.
Deciding between one format and several? Compare the options in our multi-format dashboard bundle pricing guide, with a worked bundle-vs-single example across Excel, Google Sheets and Power BI.
New to buying dashboards? Read our buyer guide on how to choose an Excel dashboard template – a five-point checklist, real prices, and the bundle-vs-single maths before you pay.
On a smaller budget? See our guide to affordable Power BI templates under $20 for cheaper reporting options.
Related: Want the metrics behind these dashboards? Read 15 supply chain KPIs to track in 2026, with the formula, benchmark and common mistake for each of Perfect Order Rate, On-Time Delivery, Inventory Turnover and more.