
Executive Coaching Dashboard in Power BI gives coaches, HR leaders, and leadership development teams a ready analytics file with 5 dashboard pages, 5 executive KPI cards, 13+ chart views, and slicer-based filtering for session fees, program costs, completion rate, coach performance, program mix, revenue trends, and client outcomes. For $17.99 one-time, you get an editable Power BI dashboard without committing to a monthly coaching CRM or SaaS subscription. Built by PK, Microsoft Certified Professional with 15+ years of Excel, Google Sheets, and Power BI experience and 300K+ YouTube subscribers, this template is designed for fast reporting, practical customization, and manual review before leadership, client, or board meetings.
Key Features of Executive Coaching Dashboard in Power BI
- 5 Power BI report pages covering Overview, Coach Analysis, Program Mix, Revenue Trend, and Client Outcomes.
- 5 high-level cards for Total Session Fee, Total Program Cost, Completion Rate, Total Engagements, and Total Sessions.
- Portfolio profitability view that highlights margin across the overall coaching portfolio.
- Coach performance analysis by completion rate, total session fee, and average client rating.
- Program mix reporting by program type, industry, and client level.
- Revenue trend analysis by month, quarter, and year for clearer financial tracking.
- Client outcome views by industry, status, and region to connect coaching activity with delivery results.
- Multiple slicers help users filter the report quickly by the relevant business dimensions.
What’s Inside the Executive Coaching Dashboard in Power BI
1. Overview Page
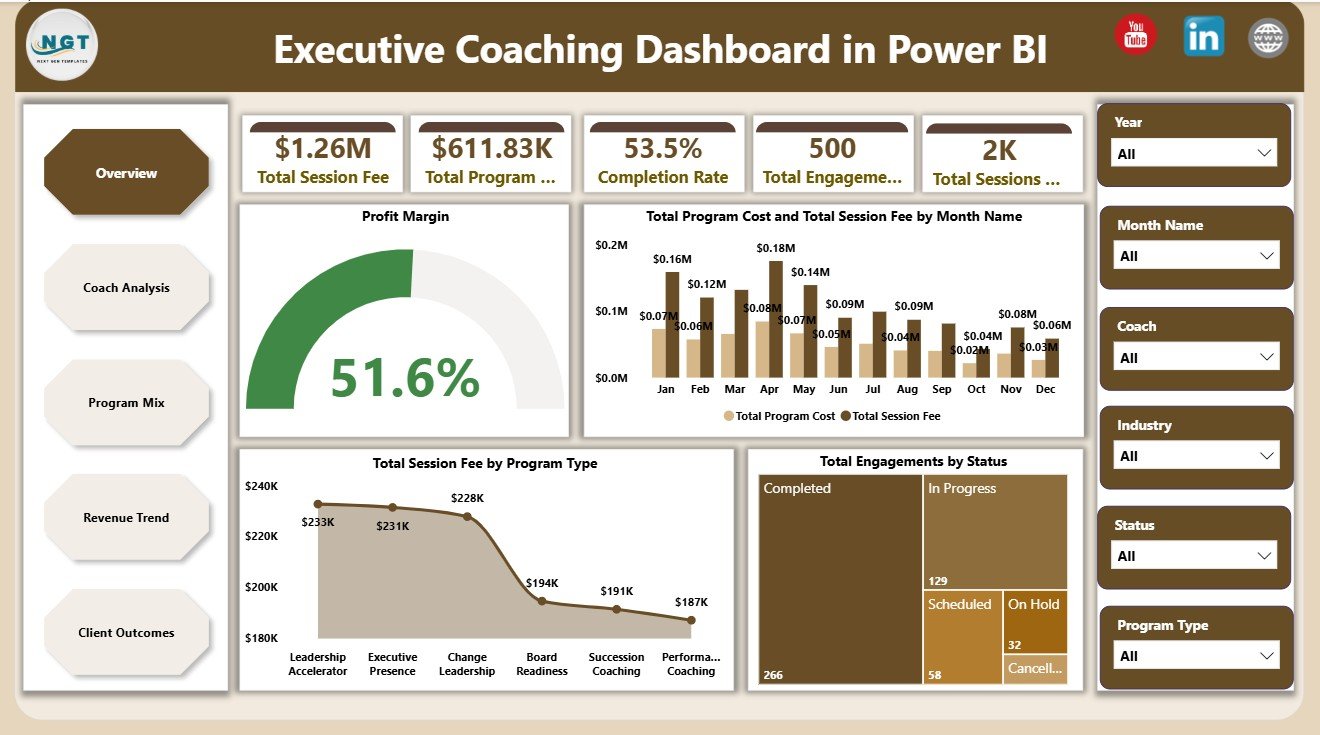
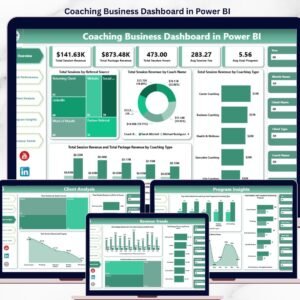
The Overview Page gives users a leadership-level summary of the coaching portfolio. The top cards show Total Session Fee, Total Program Cost, Completion Rate, Total Engagements, and Total Sessions so users can review scale, cost, and delivery performance in one view.
Profit Margin by Overall Coaching Portfolio: This chart shows whether the coaching portfolio is producing a healthy margin after program costs. It helps leaders quickly understand financial efficiency before reviewing individual programs or coaches.
Total Program Cost and Total Session Fee by Month Name: This monthly comparison shows how fee income and delivery costs move over time. It helps identify high-demand months, cost spikes, and periods where profitability needs attention.
Total Session Fee by Program Type: This visual shows which coaching program types generate the most fee revenue. It is useful for deciding where to focus sales, delivery capacity, and leadership development investment.
Total Engagements by Status: This chart separates engagements by current status. It helps teams distinguish active, completed, pending, paused, or cancelled work without manually scanning records.
2. Coach Analysis
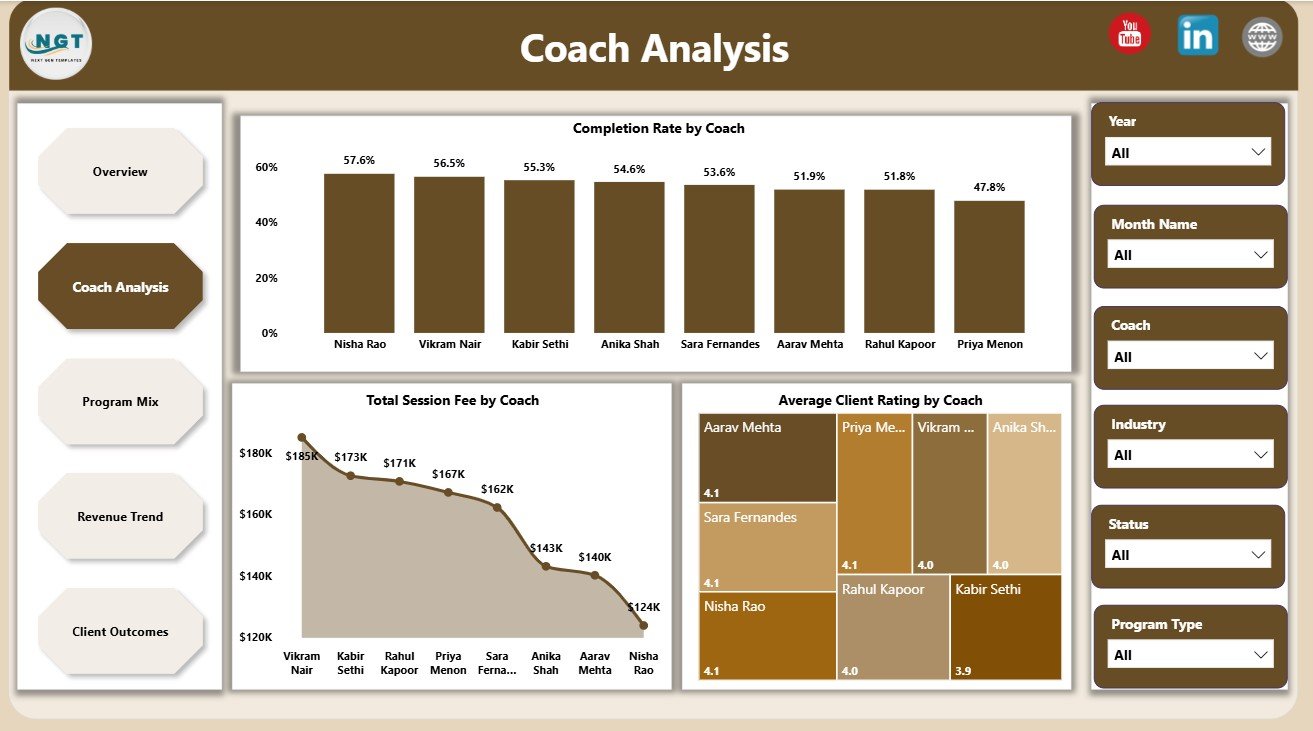
The Coach Analysis page compares coach-level performance across delivery quality and financial contribution. Completion Rate by Coach shows reliability, Total Session Fee by Coach highlights revenue contribution, and Average Client Rating by Coach helps managers review service quality.
3. Program Mix
The Program Mix page explains where coaching demand, revenue, and cost are coming from. It includes Total Program Cost and Total Session Fee by Program Type, Total Session Fee by Industry, and Net Coaching Revenue by Client Level.

4. Revenue Trend
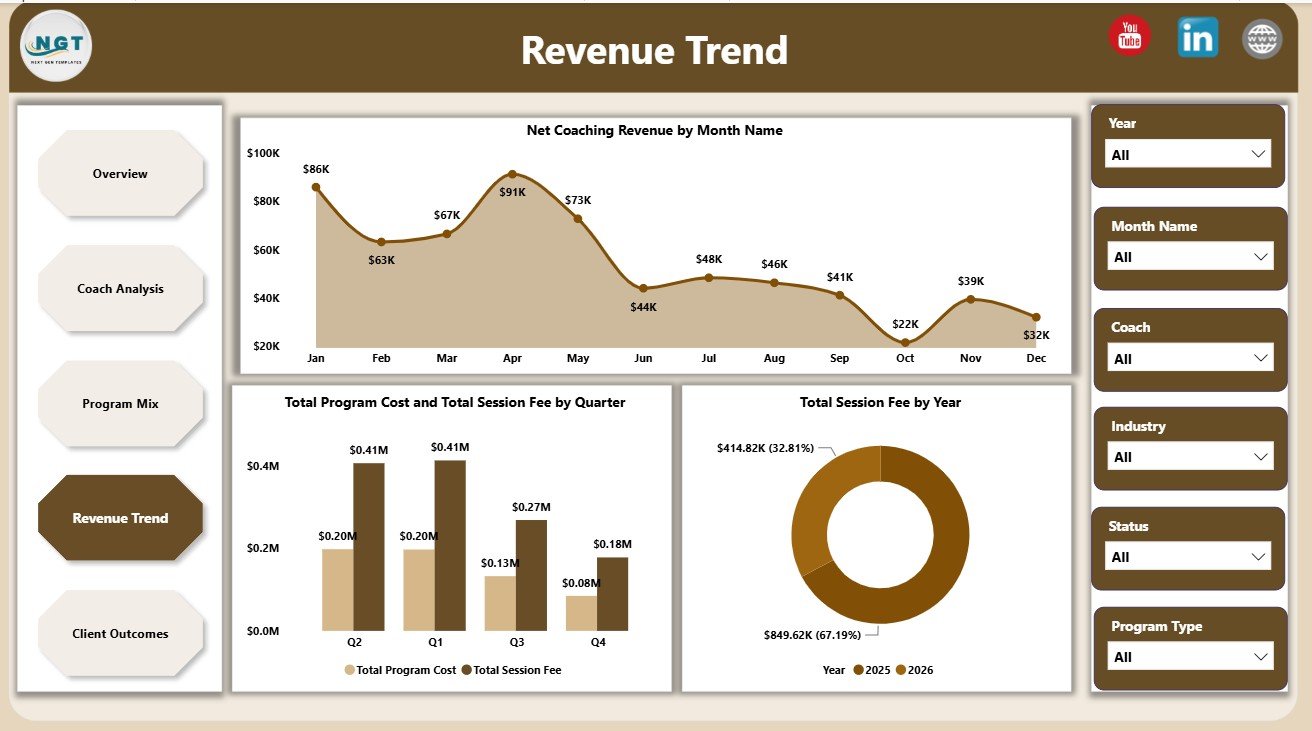
The Revenue Trend page focuses on financial movement over time. Net Coaching Revenue by Month Name, Total Program Cost and Total Session Fee by Quarter, and Total Session Fee by Year help users compare short-term movement with longer-term growth.
5. Client Outcomes
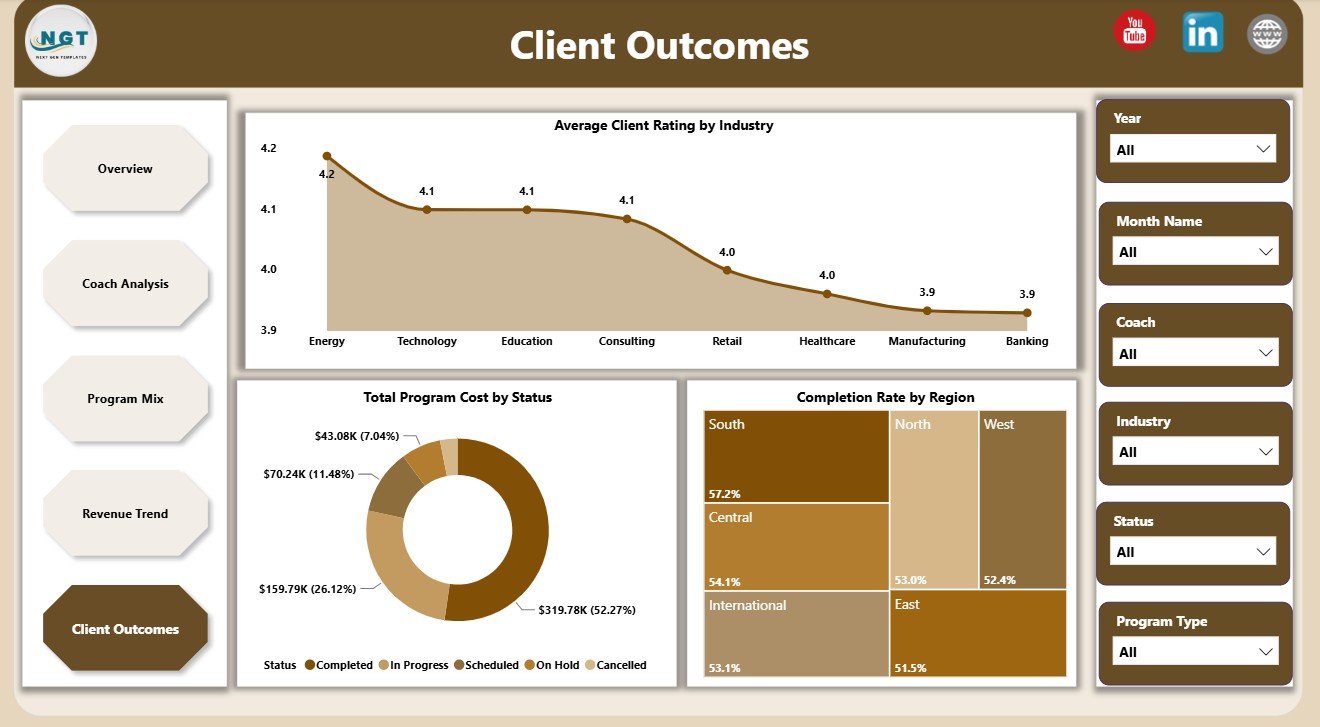
The Client Outcomes page connects coaching activity with satisfaction, completion, and delivery status. Average Client Rating by Industry, Total Program Cost by Status, and Completion Rate by Region help teams identify where results are strong and where delivery may need attention.
Executive Coaching Dashboard in Power BI vs. Tableau vs. Paid CRM/SaaS – Where This Fits
| Feature | This Power BI Dashboard | Tableau Alternative | Paid Coaching CRM/SaaS |
|---|---|---|---|
| Cost | $17.99 one-time | Requires Tableau setup or license | Monthly or annual subscription |
| Platform | Power BI Desktop | Tableau Desktop or Cloud | Vendor cloud platform |
| Setup time | Replace data source and refresh | Build or adapt workbook | Onboarding and configuration |
| Real-time team collaboration | Available with Power BI Service setup | Available with Tableau Cloud | Usually built in |
| Mobile access | Available after publishing | Available after publishing | Usually built in |
| Customizable fields | Editable Power BI model and visuals | Editable if you own the workbook | Limited by vendor settings |
| Share with link | Available through Power BI Service | Available through Tableau Cloud | Login controlled |
| Coaching analytics pages | 5 ready report pages | Requires build or template | Depends on plan |
| Year-1 cost at 5 users | $17.99 plus any Microsoft licensing | License and development cost | Often hundreds or thousands |
Who This Template Is For – and Who It’s Not For
This template is for executive coaches, coaching firms, HR directors, talent development teams, leadership development consultants, L&D analysts, and business analysts who need a structured Power BI view of coaching fees, costs, sessions, completion, coach performance, program mix, revenue, and outcomes.
It is not a booking system, client portal, learning management system, payment processor, or full CRM replacement. It works best when coaching engagement data is already available in clean rows and columns and the user is comfortable refreshing a Power BI report.
How to Use the Executive Coaching Dashboard in Power BI
- Download and unzip the Power BI dashboard package.
- Open the .pbix file in Power BI Desktop.
- Replace the sample source data with your own executive coaching records.
- Keep the same field structure where possible so visuals continue working.
- Refresh the report to update cards, slicers, and charts.
- Review each page for overview, coach, program, revenue, and client outcome insights.
Real-World Use Cases
Meera, HR director: Meera uses the Overview and Client Outcomes pages before quarterly leadership reviews to show fees, program cost, completion rate, and client satisfaction by region and industry.
Daniel, coaching firm owner: Daniel uses Coach Analysis to compare session fees, completion rates, and client ratings by coach before assigning new engagements.
Asha, L&D analyst: Asha uses Program Mix and Revenue Trend to understand which program types, client levels, industries, quarters, and years are driving the strongest coaching revenue.
Frequently Asked Questions
What does the Executive Coaching Dashboard in Power BI track?
It tracks session fee, program cost, completion rate, engagements, sessions, profit margin, coach performance, program type, industry, client level, month, quarter, year, status, region, and client rating.
Do I need advanced Power BI skills?
No. The main workflow is to open the .pbix file, connect or replace the sample data, and refresh the report. Advanced users can still edit measures, visuals, slicers, and pages.
Can I add my own coaches and program types?
Yes. You can use your own coaches, programs, industries, regions, client levels, and statuses as long as the source data remains structured for the report model.
Is this different from the Executive Coaching KPI Dashboard?
Yes. This dashboard focuses on coaching portfolio, session fee, program cost, coach analysis, program mix, revenue trends, and client outcomes. The Executive Coaching KPI Dashboard in Power BI focuses on KPI target-versus-actual monitoring.
Can this dashboard be published online?
Yes. You can publish it to Power BI Service if you have the required Microsoft account and licensing. Sharing permissions are controlled in your Power BI workspace.
Is the file editable?
Yes. The Power BI report is editable, so users can adjust visuals, fields, colors, calculations, and report pages to match their coaching data.
About the Author
Built by PK – Microsoft Certified Professional with 15+ years of Excel, Google Sheets, and Power BI experience. Founder of NextGenTemplates, reaching 300K+ subscribers across YouTube channels. Every template is hand-built and tested before release.
Explore Related Templates
- Executive Coaching Dashboard in Excel
- Executive Coaching KPI Dashboard in Power BI
- Browse Power BI Dashboard Templates
- Browse Power BI Templates
Download the Executive Coaching Dashboard in Power BI and turn coaching engagement data into clear portfolio, coach, revenue, and client outcome reporting.
Last updated: June 10, 2026.


Reviews
There are no reviews yet.