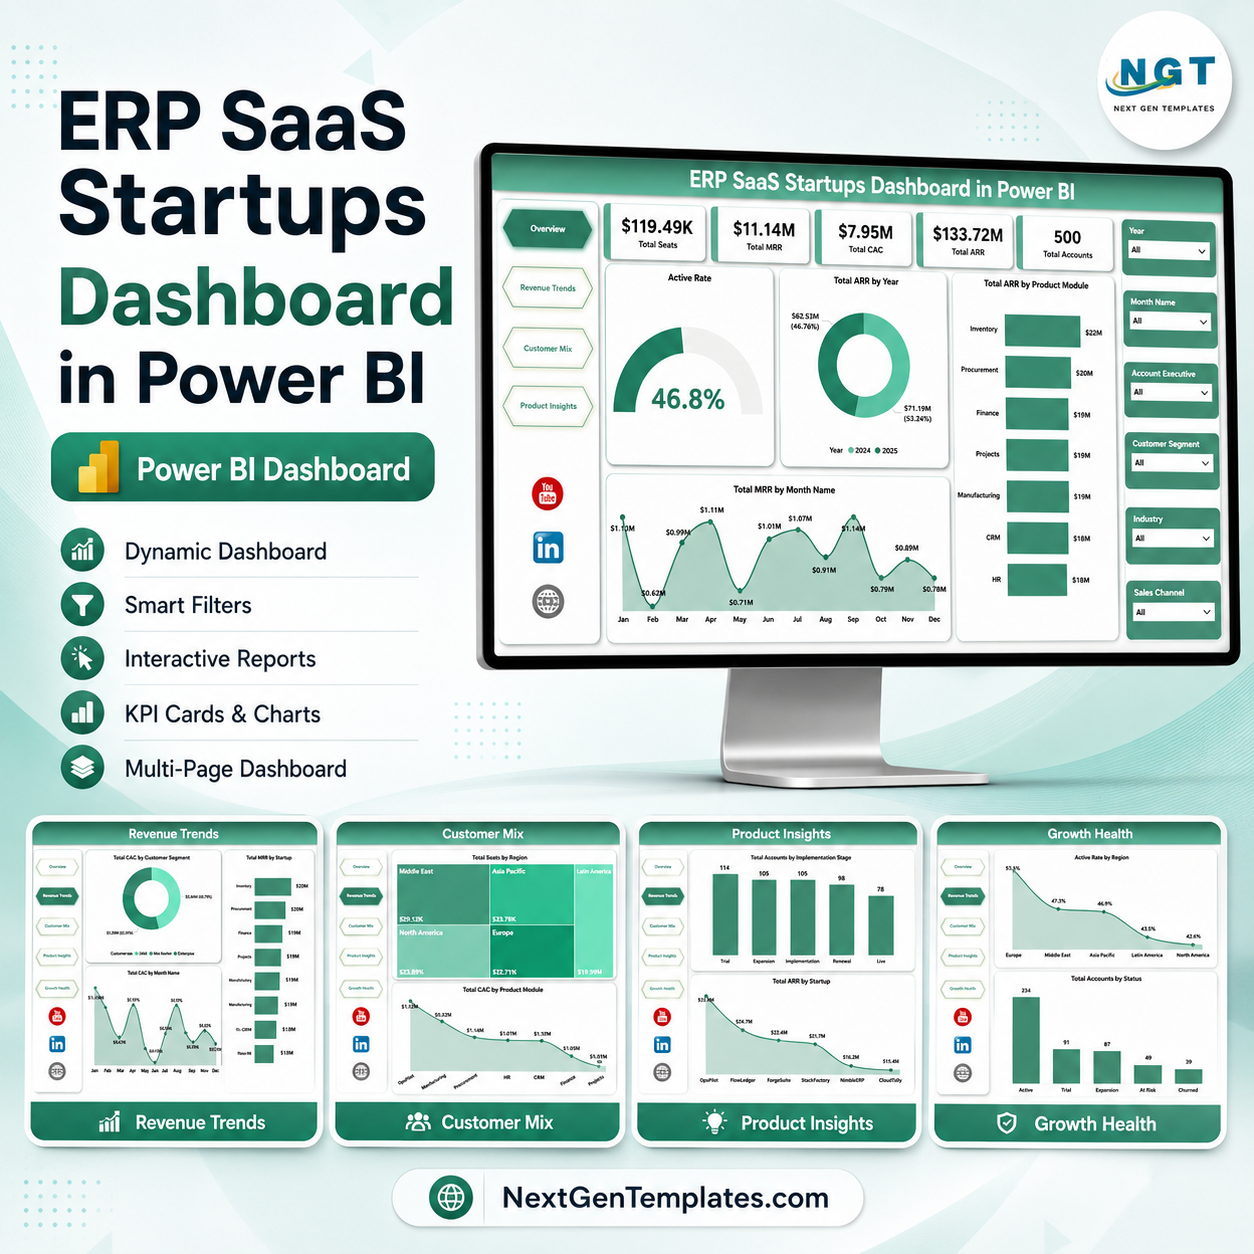
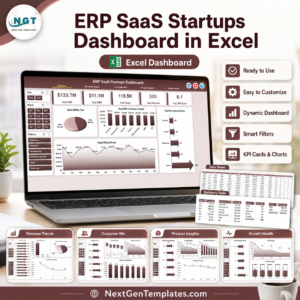
ERP SaaS Startups Dashboard in Power BI helps SaaS founders, RevOps teams, customer success leaders, product managers, and startup analysts review seats, MRR, CAC, ARR, accounts, product modules, customer mix, and growth health in one editable PBIX report. For $17.99 one-time, you get 5 Power BI report pages with KPI cards, slicers, and ready visuals for recurring revenue, acquisition cost, customer segmentation, product adoption, and active account health. Open it in Power BI Desktop, replace the sample data with your own source, refresh the model, and review the business without rebuilding every page from scratch.
Key Features of ERP SaaS Startups Dashboard in Power BI
- 5 Power BI report pages covering Overview, Revenue Trends, Customer Mix, Product Insights, and Growth Health.
- Executive KPI cards for Total Seats, Total MRR, Total CAC, Total ARR, and Total Accounts.
- Interactive slicers for quick filtered views across startup, region, customer, module, month, status, and sales dimensions.
- Revenue analysis for ARR by year, ARR by product module, and MRR by month.
- Customer acquisition views for CAC by customer segment, CAC by month, and CAC by product module.
- Customer mix reporting by region, industry, seats, and product module.
- Growth health tracking for active rate, account status, and churned accounts by sales channel.
- Editable PBIX file so you can adjust pages, visuals, fields, relationships, colors, and DAX logic in Power BI Desktop.
What’s Inside the ERP SaaS Startups Dashboard in Power BI
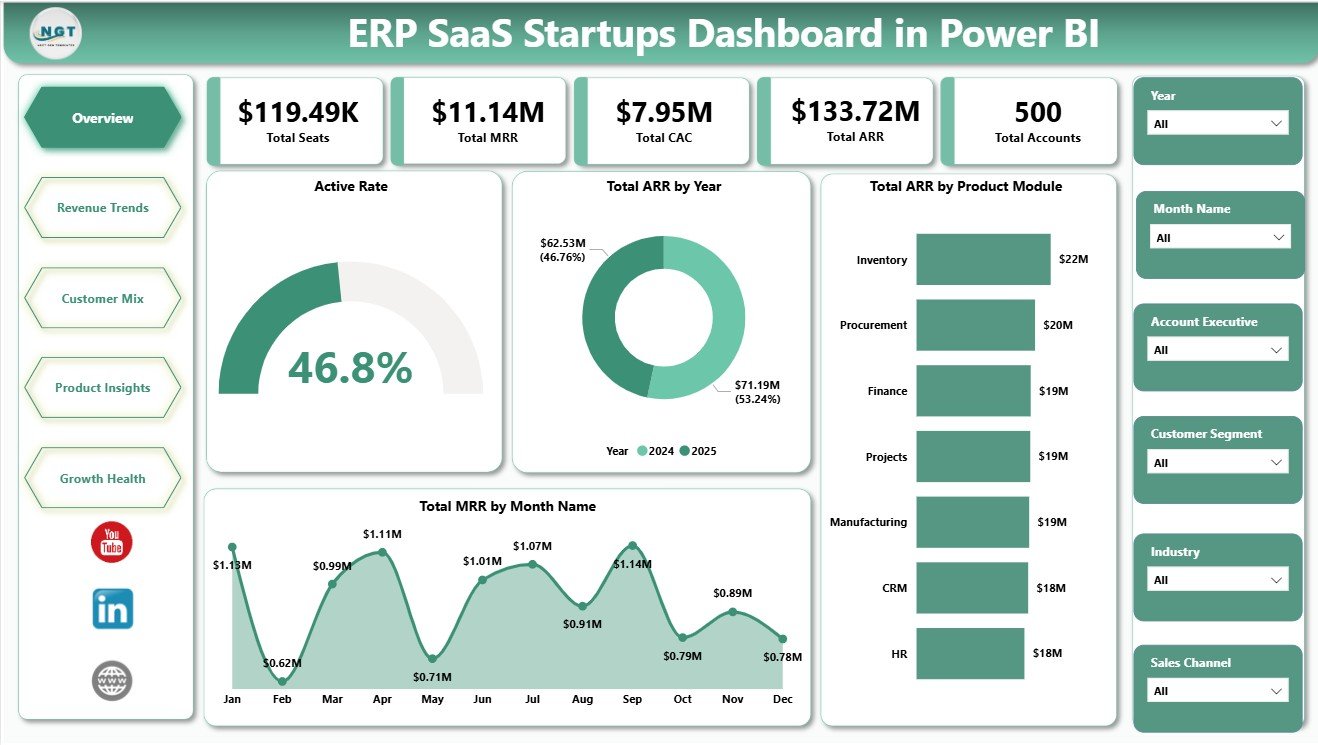
1. Overview Page
The Overview Page gives leadership a high-level view of the ERP SaaS startup business. KPI cards at the top summarize Total Seats, Total MRR, Total CAC, Total ARR, and Total Accounts so teams can quickly understand scale, recurring revenue, acquisition spend, and customer count.
Active Rate: This chart shows the share of accounts that are active within the selected filters. It helps customer success and leadership teams see whether usage health is improving or weakening.
Total ARR by Year: This visual tracks annual recurring revenue by year. It is useful for board reviews, investor updates, and long-term growth analysis.
Total ARR by Product Module: This chart highlights which ERP modules contribute the most annual recurring revenue. It helps product and revenue teams see whether finance, HR, CRM, inventory, or other modules are driving account value.
Total MRR by Month Name: This chart reviews monthly recurring revenue across the calendar months. It helps identify trend movement, seasonal patterns, and months that need closer attention.
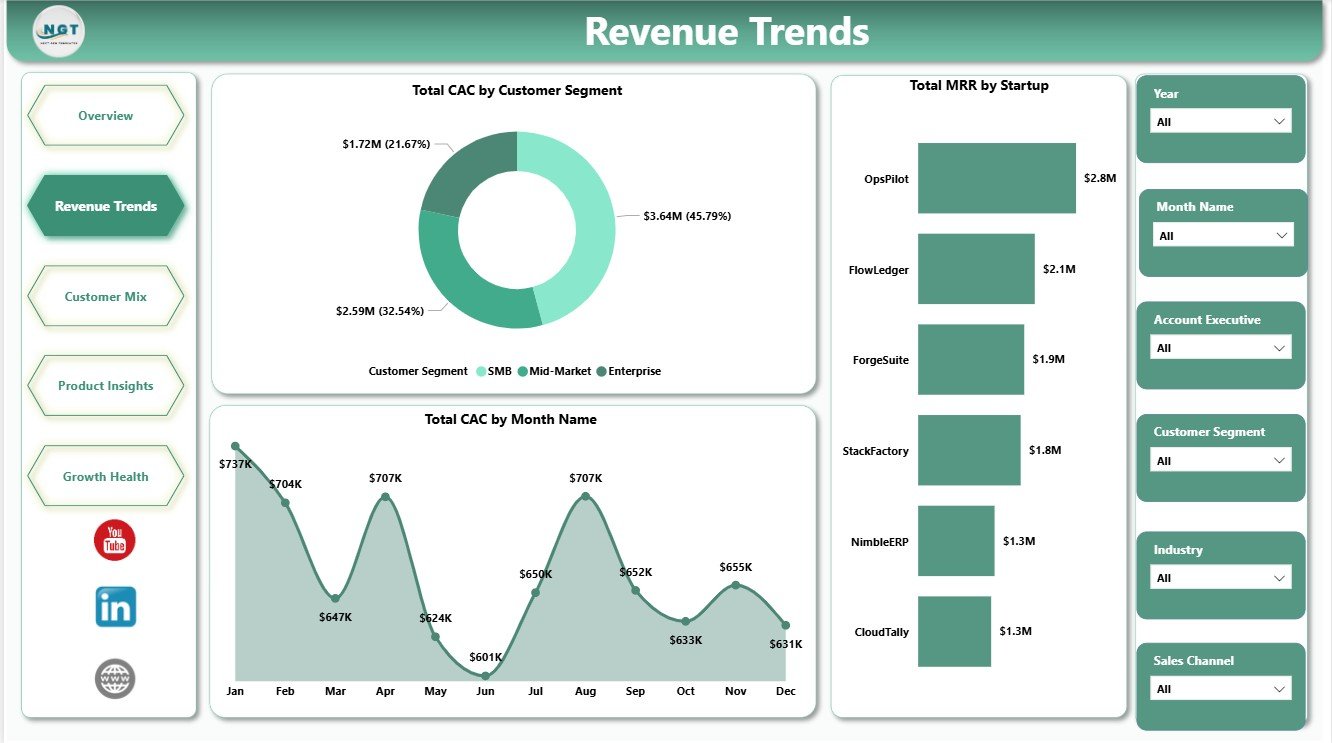
2. Revenue Trends
The Revenue Trends page focuses on CAC and MRR movement. It includes Total CAC by Customer Segment, Total CAC by Month Name, and Total MRR by Startup.
Use this page to compare acquisition spend by segment, review how CAC changes by month, and identify which startups or accounts contribute the highest MRR. It is built for finance, RevOps, and founder-level revenue reviews.
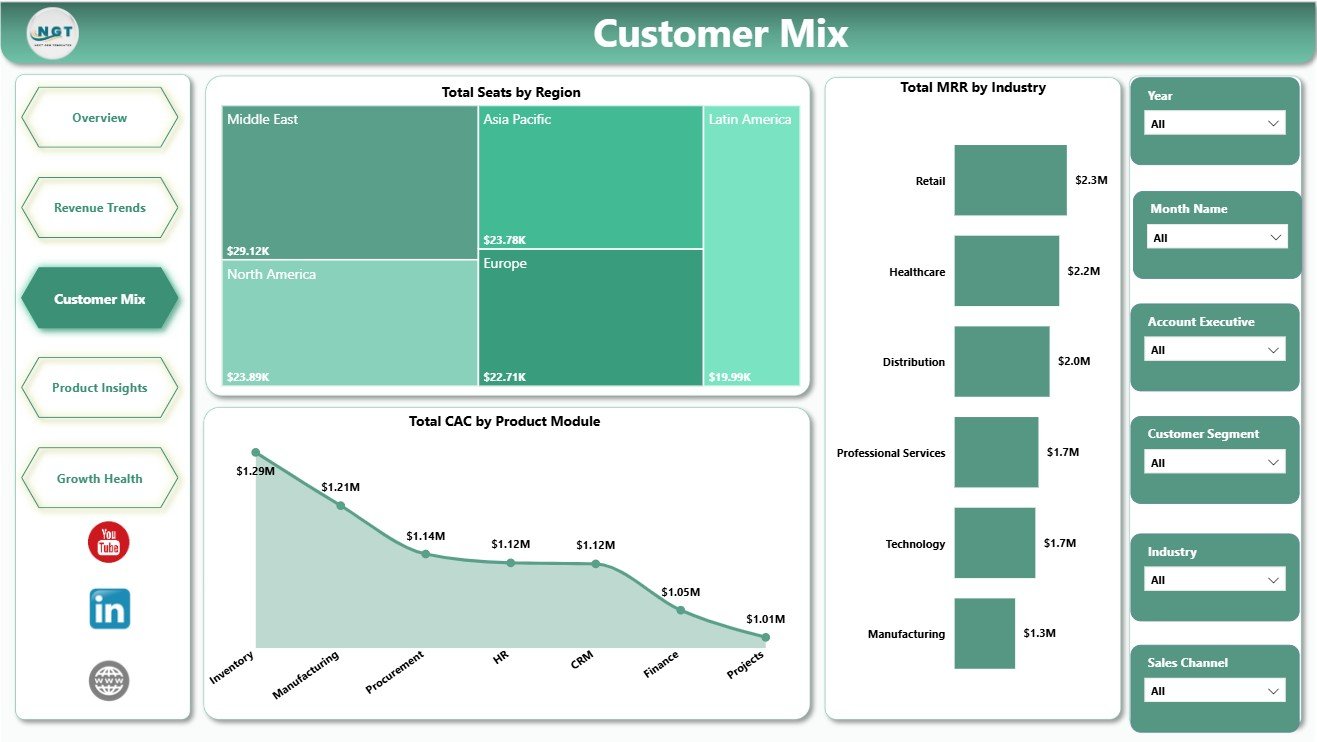
3. Customer Mix
The Customer Mix page explains where customers, seats, revenue, and acquisition cost are distributed. It includes Total Seats by Region, Total MRR by Industry, and Total CAC by Product Module.
This page helps teams understand regional adoption, industry-level recurring revenue, and acquisition cost by product module. It is useful for segmentation, territory planning, and go-to-market discussions.
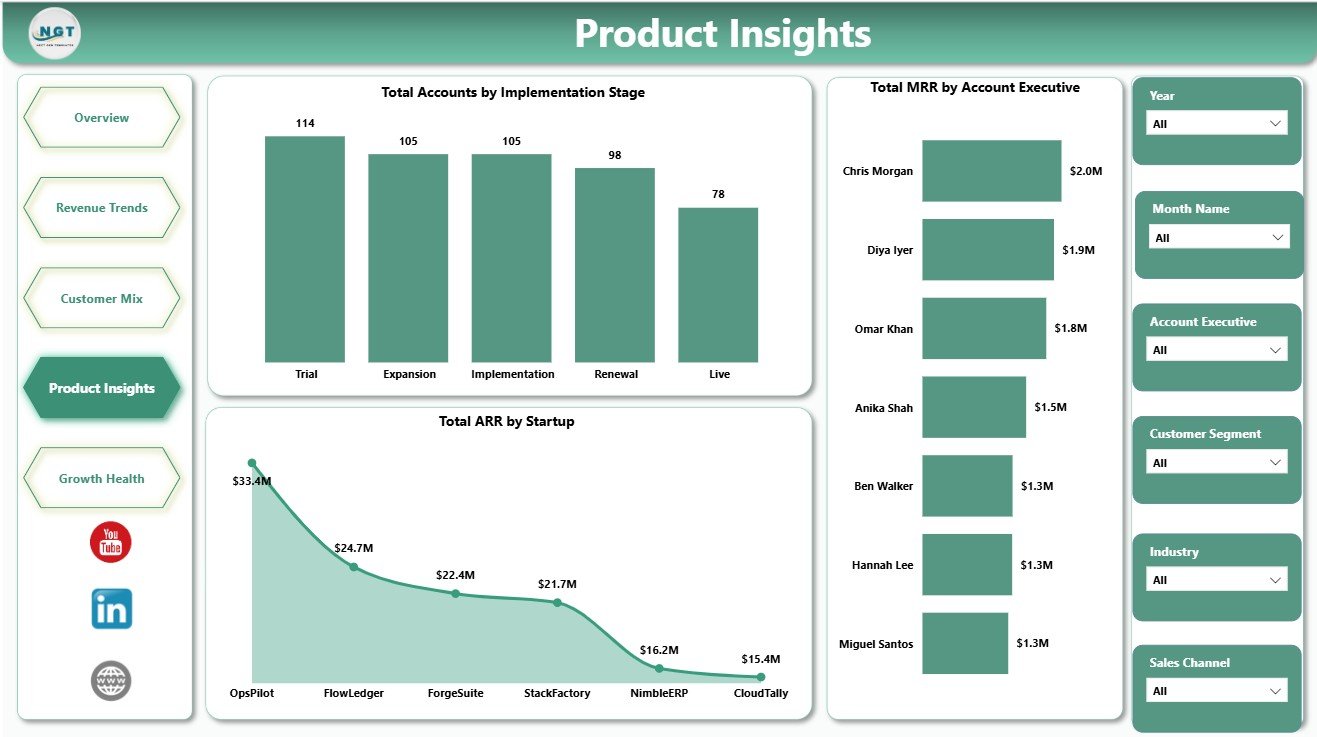
4. Product Insights
The Product Insights page connects implementation, startup-level revenue, and account ownership. It includes Total Accounts by Implementation Stage, Total ARR by Startup, and Total MRR by Account Executive.
Use this page to review onboarding progress, ARR concentration by startup, and MRR contribution by account executive. It helps product, sales, and customer success teams discuss adoption and ownership with the same numbers.
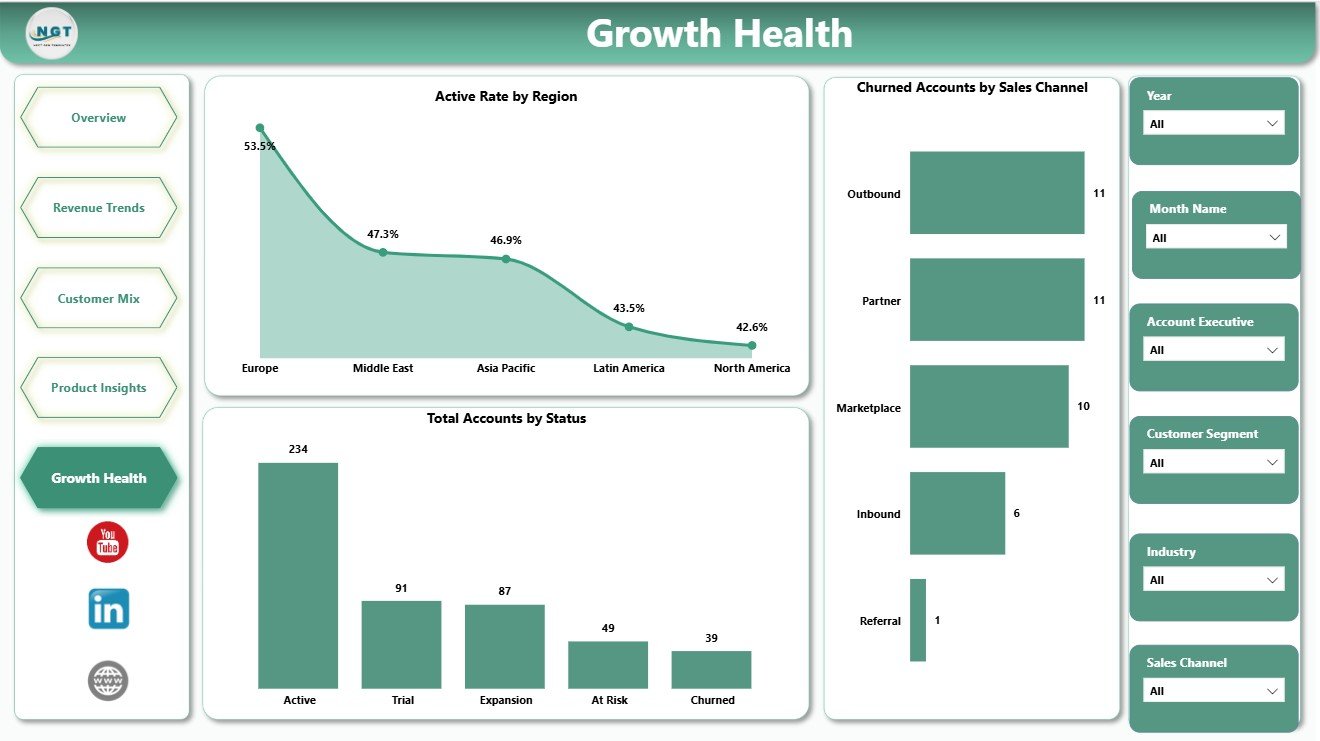
5. Growth Health
The Growth Health page focuses on account quality and churn visibility. It includes Active Rate by Region, Total Accounts by Status, and Churned Accounts by Sales Channel.
This page helps teams identify where active rate is strongest, how accounts are distributed by status, and which sales channels are associated with churned accounts. It is useful for renewal planning, channel review, and customer success prioritization.
ERP SaaS Startups Dashboard in Power BI vs. Tableau vs. Paid CRM/SaaS – Where This Fits
| Feature | This Power BI Template | Tableau Alternative | Paid CRM/SaaS |
|---|---|---|---|
| Cost | $17.99 one-time | Requires Tableau license or custom build | Monthly or annual subscription |
| Platform | Power BI Desktop / Power BI Service | Tableau Desktop / Cloud | Vendor cloud platform |
| Setup time | Open PBIX, replace or connect data, refresh | Build model and visuals manually | Implementation and onboarding |
| Real-time team collaboration | Available through Power BI Service with licensing | Available through Tableau Cloud with licensing | Usually included |
| Mobile access | Power BI mobile app when published | Tableau mobile when published | Vendor app or browser |
| Customizable fields | Editable model, visuals, pages, and DAX | Editable with Tableau skills | Limited by vendor settings |
| Share with link | Possible through Power BI Service permissions | Possible through Tableau Cloud permissions | Usually login controlled |
| Year-1 cost at 5 users | $17.99 plus Microsoft licensing if needed | Usually much higher | Often hundreds or thousands |
| ERP SaaS metrics | ARR, MRR, CAC, seats, accounts, active rate, churn, modules | Requires custom design | Depends on plan and integrations |
Who This Template Is For – and Who It’s Not For
This dashboard is for ERP SaaS founders, RevOps managers, SaaS finance analysts, product leaders, customer success managers, account executives, and consultants who need a practical Power BI report for recurring revenue, acquisition cost, seats, customer mix, product modules, implementation stage, and growth health.
It is not a replacement for a live ERP, CRM, billing system, customer success platform, data warehouse, or automated product analytics stack. It works best as a reporting layer on clean structured data exports or a prepared source table.
How to Use the ERP SaaS Startups Dashboard in Power BI
- Download and unzip the product file.
- Open the PBIX file in Power BI Desktop.
- Replace the sample data or connect the report to your own ERP SaaS data source.
- Refresh the model and validate the KPI cards on the Overview Page.
- Use slicers to filter pages by the available customer, account, module, region, month, status, and sales fields.
- Customize visuals, colors, fields, relationships, or DAX measures as needed.
Real-World Use Cases
Nina, SaaS founder: Nina uses the Overview and Revenue Trends pages before investor updates to explain seats, ARR, MRR, CAC, and account growth.
Omar, RevOps manager: Omar reviews Customer Mix to compare regional seats, industry MRR, and acquisition cost by product module before pipeline planning.
Leah, customer success lead: Leah checks Growth Health and Product Insights to understand implementation progress, active rate, churned accounts, and account executive ownership.
Frequently Asked Questions
What is included in this Power BI dashboard?
The PBIX report includes 5 pages, KPI cards, slicers, and visuals for seats, MRR, CAC, ARR, accounts, active rate, customer segment, startup, region, industry, product module, implementation stage, account executive, status, and churned accounts.
Do I need Power BI Desktop?
Yes. Open and edit the PBIX file in Power BI Desktop, which is available from Microsoft. Publishing to Power BI Service may require Microsoft licensing.
Can I use my own ERP SaaS startup data?
Yes. Replace the sample data or connect the report to your own structured source, then refresh the model.
Can the dashboard be customized?
Yes. You can edit pages, visuals, slicers, fields, colors, relationships, Power Query steps, and DAX measures in Power BI Desktop.
Does this replace a CRM or ERP system?
No. It is a reporting dashboard, not an operational CRM, ERP, billing platform, or customer success system.
Is this a subscription?
No. This is a one-time downloadable Power BI template purchase.
About the Author
Built by PK – Microsoft Certified Professional with 15+ years of Excel, Google Sheets, and Power BI experience. Founder of NextGenTemplates, reaching 300K+ subscribers across YouTube channels. Every template is hand-built and tested before release.
Explore Related Templates
- ERP SaaS Startups Dashboard in Excel
- SaaS Product Usage Dashboard in Excel
- SaaS Metrics Dashboard in Excel
- Browse Power BI Dashboard Templates
Download the ERP SaaS Startups Dashboard in Power BI and turn SaaS revenue, acquisition cost, account, module, and growth health data into clear Power BI reporting.
Last updated: June 9, 2026.


Reviews
There are no reviews yet.